During my lunch talk at the Technology, Diversity, and Democracy conference Mike has previously reported on, I used the case of Palm Beach County, Florida to discuss how metrics to gauge the quality of the voting process sometimes are right under our noses, and under-utilized.
Here is a little more detail about PB County (and all of Florida), along with a comparison with LA County (and all of California).
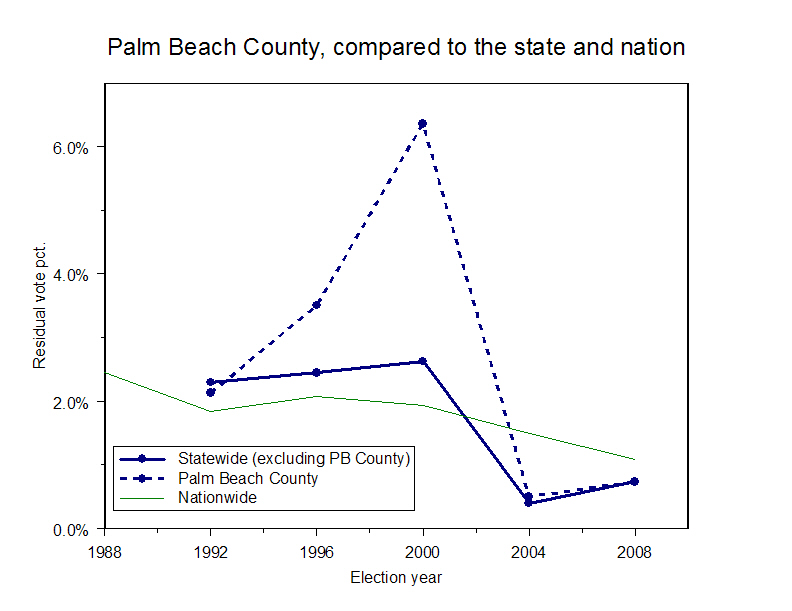
The accompanying graph shows the residual vote rate for Palm Beach County, Florida, from 1992 to 2008. (As far as I can tell, Florida did not gather separate turnout statistics prior to the 1992 presidential election, so we can’t calculate the residual vote rate earlier than 1992.) For the purpose of comparison, I also show the rate for the whole state (excluding PB County) and the nation.
The PB County residual vote rate surged in 1996 (perhaps an early sign of maintenance issues with the punch card devices?) and again in 2000. By comparison, the residual vote rate for all of Florida, while a bit above the national average, was basically flat.
After 2000, Florida not only quickly abandoned the antiquated systems they were using, but they also instituted a reporting system that tracks explicitly the residual vote rate for the top-of-the-ticket races every two years. Here, for instance, is the 2008 analysis of over- and under-votes. The results of these changes are evident after 2000. In PB County, the residual vote rate dropped from 6.4% in 2000 to 0.5% in 2004. In the rest of the state, the rate dropped from 2.6% to 0.4%. These numbers moved up a bit in 2008, but it’s clear that PB County, and the state as a whole, has entered a new regime in striving to make every vote count.
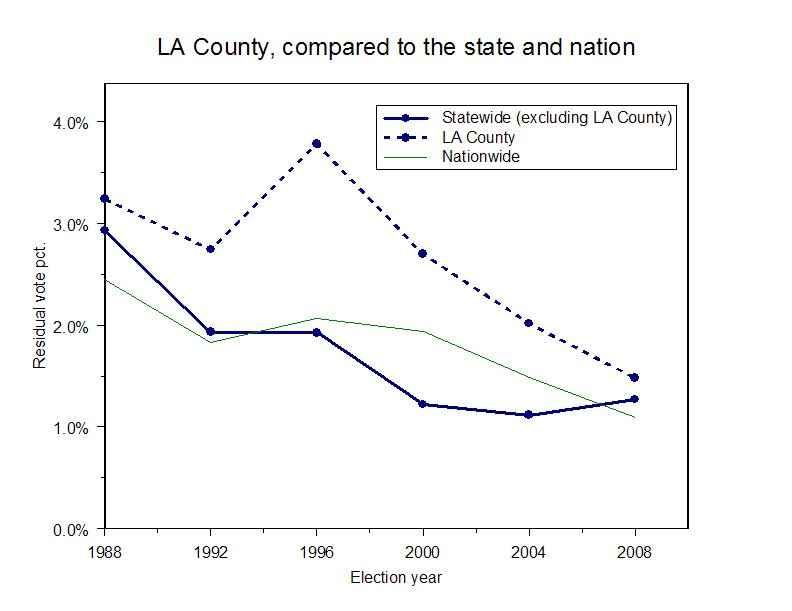
Now look at a similar graph for LA County, along with the rest of California. California’s residual vote rate has been trending downward since 1992, dipping down below the nationwide average before 2000. But as the rest of the nation has aggressively tried to reduce residual vote rates, the rest of the nation has now caught up with California. LA County, which started off significantly higher than the rest of the state — with a notable spike in 1996 — has seen its residual vote rate drop faster than the state as a whole, so that it is now fairly close to the statewide and nationwide averages.
Note, by the way, that there is no dramatic shift in the residual vote rate — absolutely or compared with the state as a whole — with the introduction of the Inkavote system in 2004. The downward trend just continues.
The differences between California and Florida, and between Los Angeles and Palm Beach counties, are significant, when we think about how elections are run in both states. However, there are many similarities. Both are large states that rely on fairly large counties to conduct elections. Leaving aside LA County, the average California county had a turnout of 179,000 voters in 2008, compared to an average of 126,000 in Florida counties. County election directors in both states are on the whole highly professional, even though they are chosen in different manners. Aside from the fact that California ballots are much longer than Florida ballots, one major difference is that Florida has institutionalized an effort to minimize “lost votes,” whereas California has not.
In 2008, the residual vote rate for Florida was 0.7%, compared to 1.3% in California. If California could reduce that rate to Florida’s, over 82,000 additional votes would be recovered among Golden State residents in presidential years. The number for LA County alone is over 20,000.