Author Archives: cstewart

Voter Confidence in the 2018 Election: So Long to the Winner’s Effect?

For the past two decades, Americans have consistently exhibited a “winner’s effect” in judging whether votes were counted fairly in elections.  The 2018 election broke that pattern.

In particular, prior to 2018, it was common for voters who identified with the prevailing party in a federal election to acquire much greater confidence post-election that votes were counted as intended.  Conversely, members of the vanquished party became much less confident.

Not in 2018.

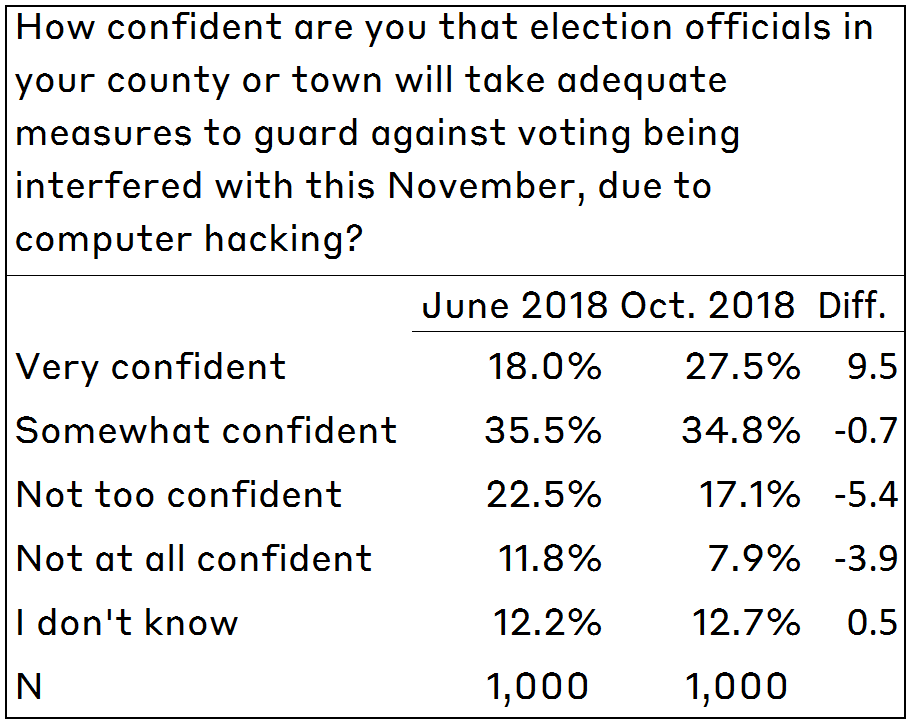
In a nationwide survey of adults I conducted in the days immediately after the 2018 federal election, 84% of voters stated they were either “very” or “somewhat” confident that their vote was counted as they intended.  (Throughout this post, I will refer to these respondents as “confident.”)  This is virtually identical to the response they gave a month before the election.  In contrast with patterns from past elections, the results of the election had no effect on overall levels of confident, and essentially no effect on differences between the parties.

The data in this post were taken from two surveys I conducted before the election (during May 14–16 and October 5–7) and one after (on November 7–9).  In each case, the surveys interviewed 1,000 adults as a part of the YouGov Omnibus survey.  The research was supported by a grant from NEO Philanthropy, which bears no responsibility for the results or analysis.  I will contrast the results I found in 2018 with similar research I performed in the 2014 and 2016 federal elections, plus a peer-reviewed article I published in 2015 with Mike Sances, which examined the history of voter confidence from 2000 to 2012.

Voter confidence in the 2018 election

The focus of this post is on two questions that form the core of research on attitudes about public confidence in election administration.  Asked after the election, the questions are:

  • How confident are you that your vote was counted as you intended?
  • How confident are you that votes nationwide were counted as intended?

The questions can also be asked before the election, in which case they are altered slightly to reflect the fact they are being asked prospectively.  (E.g., “How confident are you that your vote will be counted as you intend?”)  There are variations on this question across researchers, but they all tend to produce very similar response patterns.

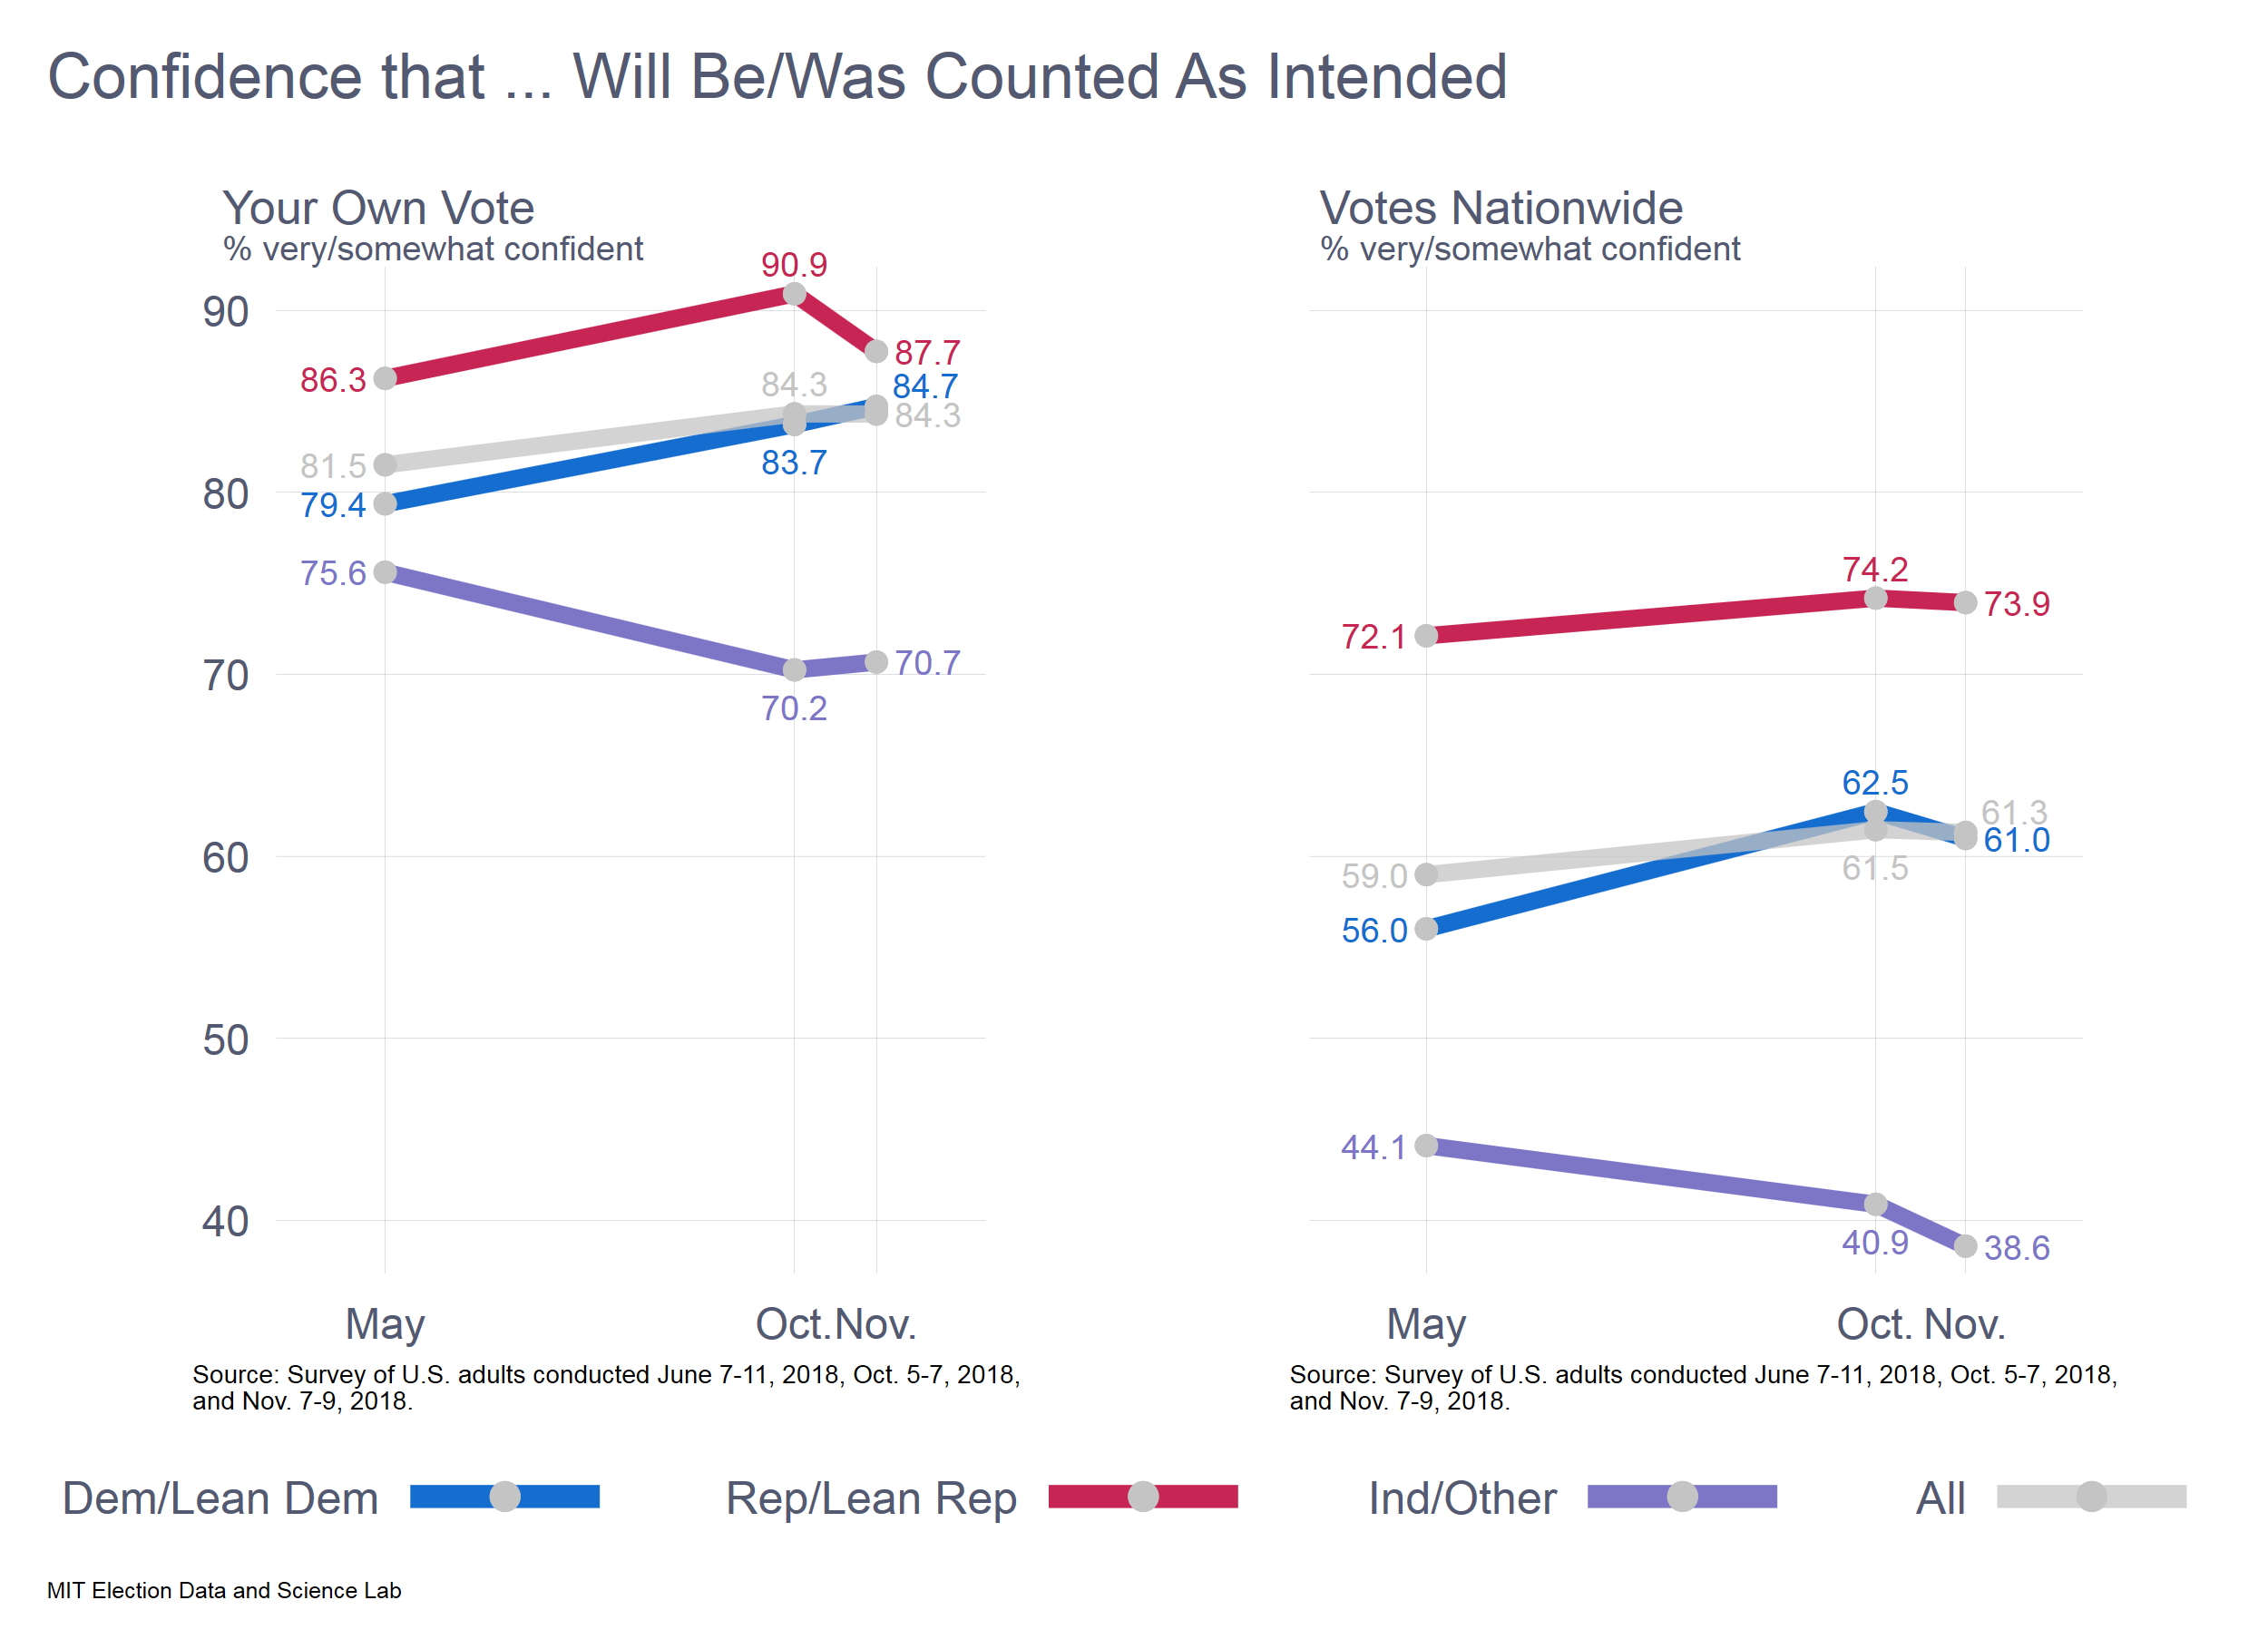
Voters in 2018 were like voters in past years in one important respect:  they expressed greater confidence that their own vote was (or would be) counted as intended, compared to opinions about vote-counting nationwide.  For instance, after the election, 84% expressed confidence that their own vote was counted as intended, compared to 61% of respondents who said the same about votes nationwide.

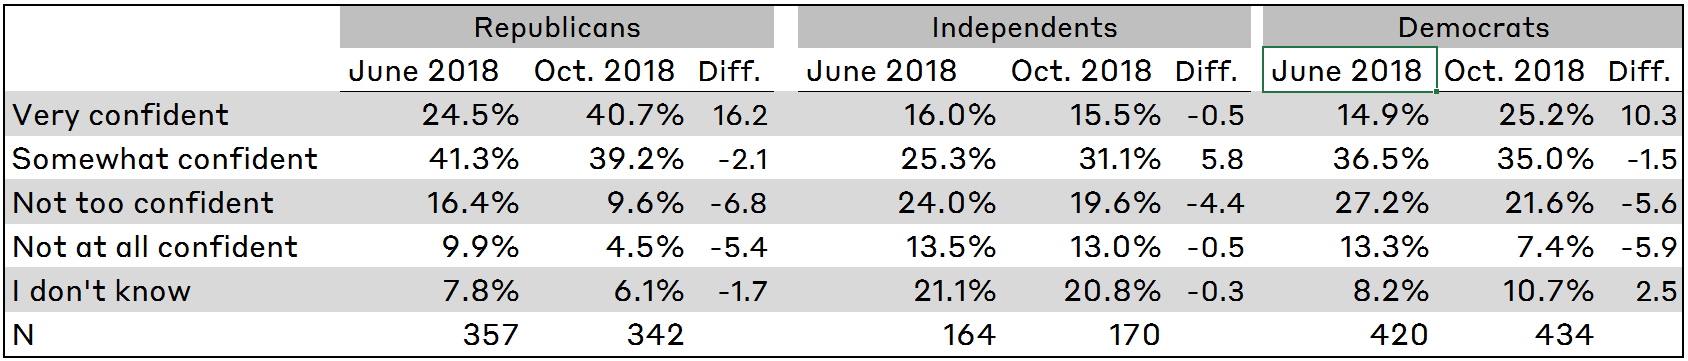
Ever since questions about voter confidence have been asked, starting with the 2000 election, answers have tended to divide along partisan lines, depending on who was in power and which party was perceived to have won the most recent election.  A partisan divide also appeared in 2018, both before and after the election. For both questions, Republicans expressed greater confidence than Democrats during the pre-election period.  After the election, the two parties converged when the question was about their own vote, but the divide remained when the question was about vote-counting nationwide.

Before exploring these patterns in more detail, it is notable that voter confidence grew between May and October among partisan identifiers, but it dropped among respondents who identified with neither of the major parties. The election itself seems to have deflected these patterns only a bit.  Yet, the movements in opinions after the election are so small that any changes in early November may have been due to random noise.

Comparison with past year

The patterns in voter confidence that emerged in 2018 are remarkable when we place them beside results from past years.  In an article that Michael Sances and I published in Electoral Studies in 2015, we found that starting in 2000, and running through 2012, there was a tendency for voter confidence to improve after elections.  We don’t see that in 2018.  We also found that there was a tendency for the “winning” party’s adherents to be especially confident in the quality of the vote count post-election.  We also don’t see that in 2018.

To help illustrate how unusual the 2018 patterns are, even compared to the recent past, I went back to research I conducted in 2014 and 2016, using data from my module in the the Cooperative Congressional Election Study (CCES).  In both years, I asked a sample of adults the voter-confidence questions I have been discussing here, before and after the election. In each election, all the patterns related to partisanship were consistent to what Sances and I found when we explored earlier years.  The patterns in 2014 and 2016 were also different from what we see in 2018.

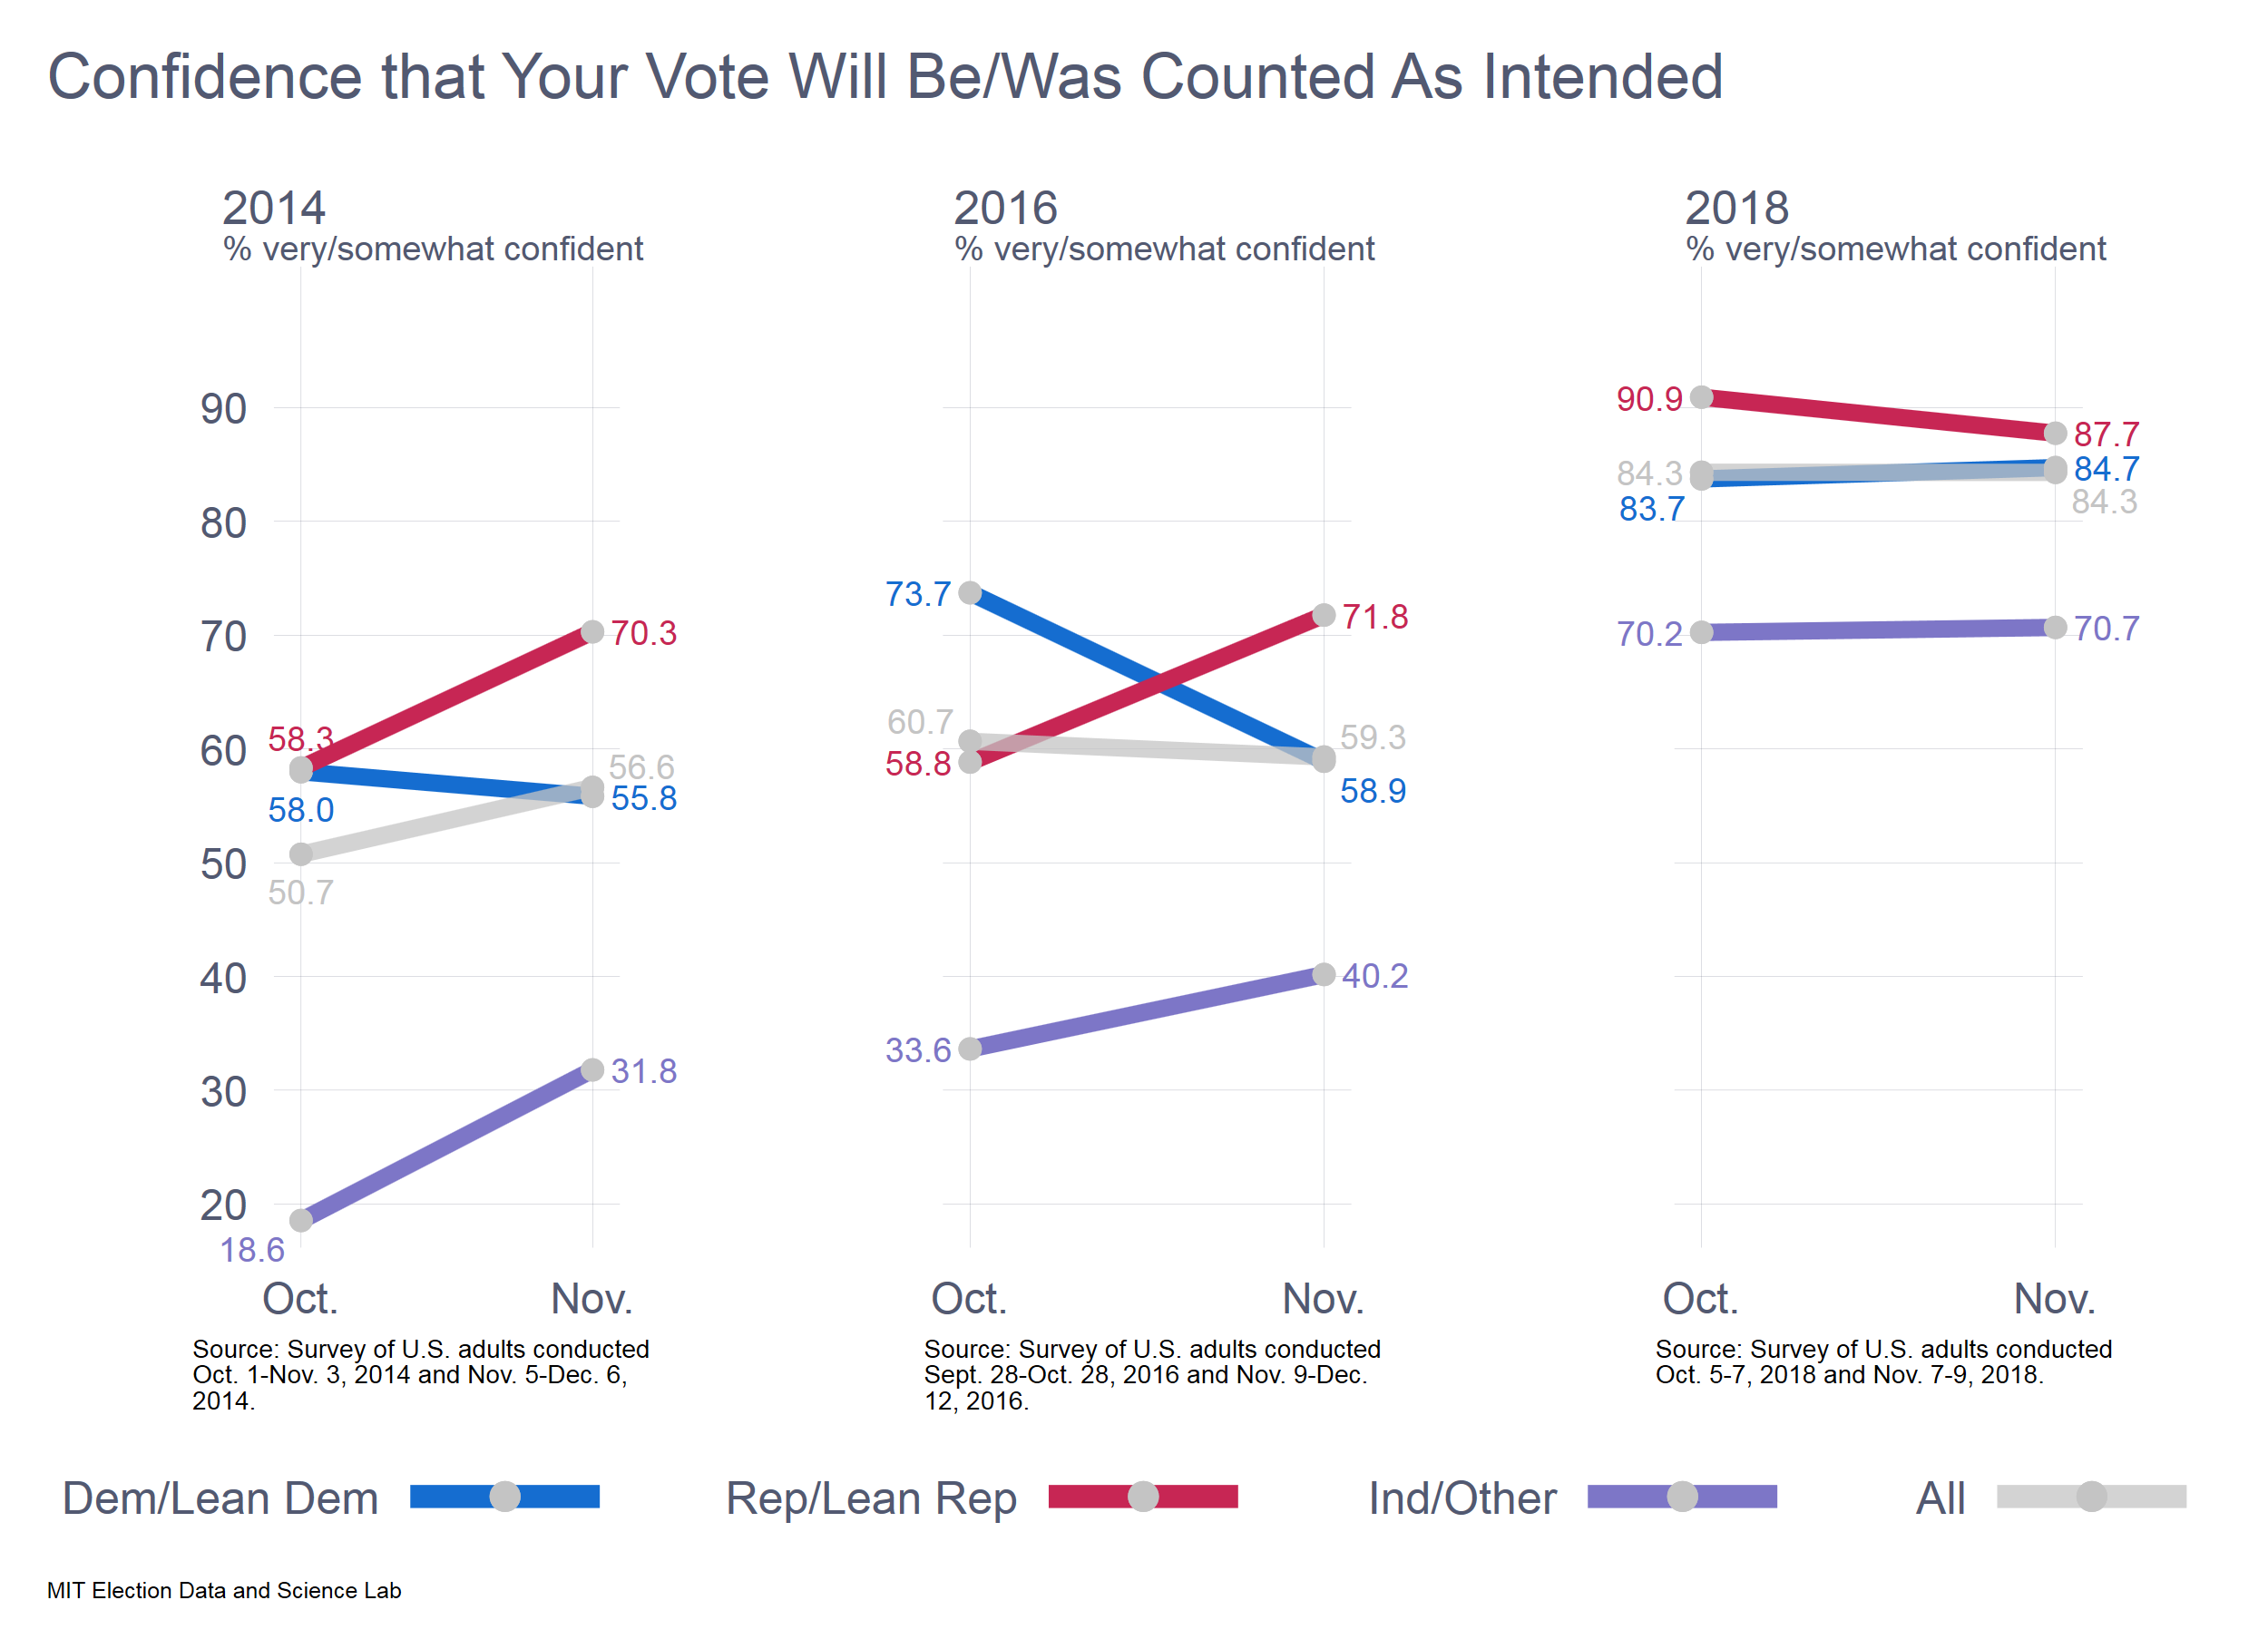
The accompanying graphs show how the question pertaining to confidence in one’s own vote was answered in 2014, 2016, and 2018.  The pre-/post-election change in confidence in 2018 stands in stark contrast with what we saw in 2014 and 2016.  In 2014, for instance, Democrats and Republicans were equally confident one month before the election.*  Just a month later, the results at the polls revealed a set of solid Republican victories in federal and state elections nationwide.  Good electoral news for Republicans was followed by a 14-point increase in Republican confidence and a slight decrease in confidence among Democrats.

In 2016, the even-more-dramatic electoral results produced an even greater shift in partisan confidence.  One month before the election, Democrats were more confident by a margin of 15 points.  Right after the election, Democrats were less confident, by 13 points.

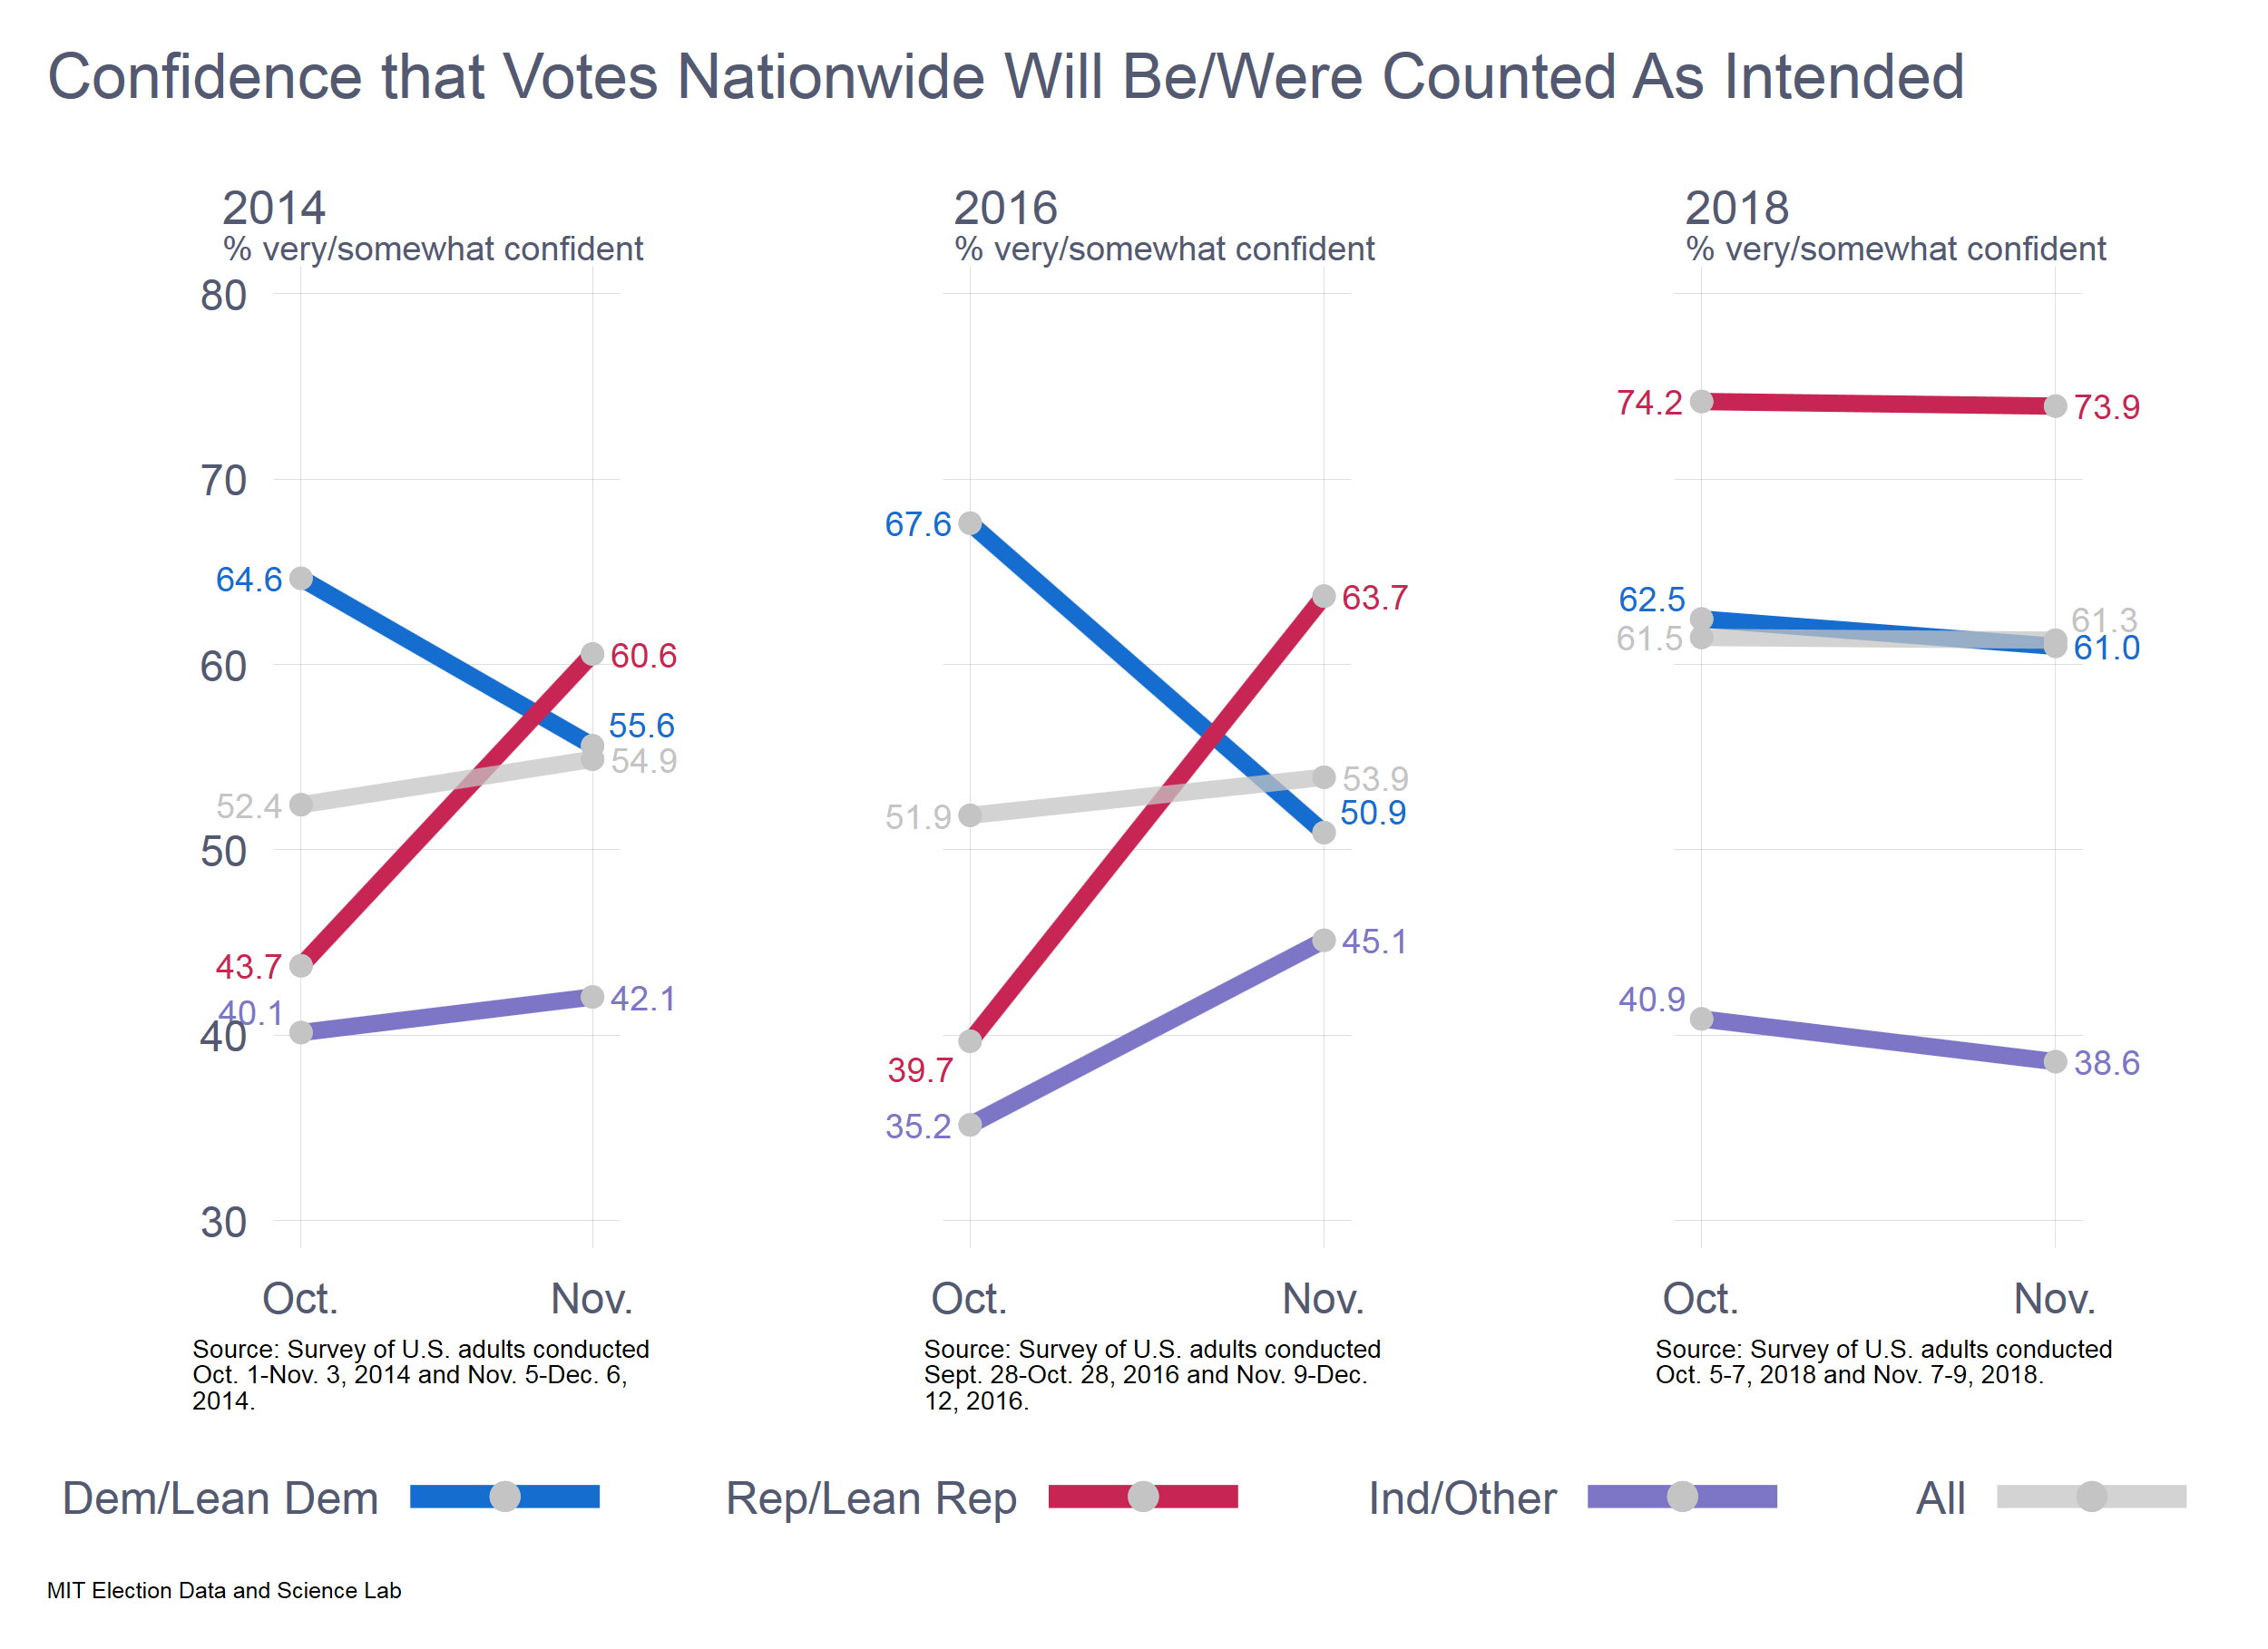
Turning our attention to the question about how the respondent felt about the vote-count nationwide, we see some interesting differences across the years, but the same stark contrast between 2018, on the one hand, the 2014 and 2016, on the other.

In shifting our attention away from local vote counting toward attitudes about elections nationwide, it is notable that in both 2014 and 2016, Democrats went into the election with a much more sanguine view about the state of election administration than Republicans did.  And, in each year, the partisan shifts in attitudes after the election were substantial.  Not so with 2018, where Republicans started out much more confident than Democrats before the election, and stayed that way afterwards.

Parting thoughts

These results just skim the surface of what we have yet to learn about voter confidence in the 2018 election.  As data from the large academic surveys come available in the new year, we’ll be able to explore the contours of voter confidence with much greater nuance than I’ve been able to do here.

I must underscore that the post-election results from 2018 are based on a survey that was in the field the two days after the election.  Responses, therefore, are largely unaffected by election-counting controversies that unfolded in the days and weeks ahead, in Florida, Georgia, and North Carolina. Nor do they reflect responses to the “blue shift” in the returns, as California and other west-coast states completed the count in the following weeks.

For the past two years, close observers of election administration have wondered whether the current political climate is corrosive to trust in our electoral process.  The results I’ve reported here are inconsistent with the view that Americans are less trusting of their elections — or at least the administration of elections.  Overall, Americans expressed more confidence that their votes were counted as intended in 2018 than in either 2014 or 2016.  Although there is a significant partisan divide between Republicans and Democrats in levels of confidence, both at a local and national level, it must be underscored that Democrats in 2018 were still more confident than they were in 2016, or even 2014 for that matter.

What is unusual about 2018 is the fact that Democrats did not become more confident after the election, despite the fact that the party retook the House and held its own in the Senate.  In past years, a blue wave in the election returns would have resulted in Democrats feeling much better about the electoral process than they apparently did in 2018. ** This might be a sign that Democrats have begun to internalize a critique of the electoral process that focuses on efforts to raise barriers to participation in some states.  Alas, we can’t probe questions like this with the data we have.

As questions of election administration become more politicized, it is natural to wonder whether this politicization is eroding confidence in the process among Americans.  The preliminary evidence here is that it has not.  However, the preliminary evidence is also that Americans may be changing how they think about whether they are confident in how elections are run.  If voters are beginning to think about confidence in the system in terms of the long-term political allegiances,  rather than in terms of short-term winners and losers,  then the world of voter confidence will have changed.

Notes

*The analysis here focuses on the difference between the October and November numbers because they are the most comparable data points.  Unfortunately, I did not have public opinion soundings from late spring/early summer, like I did this year.

**Of course, it might also be the case that the 2018 post-election survey was held too close to the election for the fact that this was a blue-wave year to sink in on Democrats.

Two More Thoughts about the NC 9th CD Situation

The North Carolina 9th congressional district controversy is an interesting case of how the data-rich environment of North Carolina elections allows election geeks to explore in great detail the dynamics of an election, using the incomparable North Carolina Board of Elections data website.  In particular, Nathaniel Rakich at FiveThirtyEight  and Michael Bitzer at Old North State Politics have mined the data deeply.

I don’t have much more to add, but I did want to put my oar in on two topics  that may have relevance to the unfolding scandal.  The topics are:

  • Unreturned ballots by newly registered voters
  • Unreturned ballots by infrequent voters

Thing # 1: Unreturned ballots by newly registered voters

The first topic is the return rate of absentee ballots by newly registered voters.  Robeson County officials noticed a large number of absentee ballot requests being dropped off in batches, along with new voter registration forms.  This apparently was one of the things that alerted officials to the possibility that something was up.  In all the analyses posted, I hadn’t seen any reports of the percentage of unreturned absentee ballots by newly registered voters.  Here it goes.

First, this pattern of batches of absentee ballots along with registration forms was reported in August.  It turns out that the non-return rate of absentee ballots requested in August in Robeson County when the registration was also received in August was quite high — 95%, compared to 33% in the rest of the county.  The number of affected ballots was quite small, 21, but this is still an eye-popping statistic when compared to other counties.

Second, broadening the window a bit, the non-return rate of absentee ballots among those who registered any time in 2018 in Robeson County was 81%, compared to 67% for those who had registered before 2017.

Thus, it’s likely that some sort of registration+absentee request bundling  was going on in Robeson.  However, the non-return rate is still high if we exclude the (possibly) bundled requests.  Clearly, if there was fraud, it was multi-strategy.


Thing # 2: Unreturned ballots by infrequent voters

The second topic is whether infrequent voters were more likely to request an absentee ballot and not return it.  This question occurred to me because it fits into a scenario I’ve talked about with other election geeks, about how absentee ballots might be used fraudulently.  The idea is that if someone wants to request a ballot to use it fraudulently, they need to request it for someone who is unlikely to vote.  Otherwise, when they — the actual legitimate voter — do go to vote, it will be noticed that they had already requested an absentee ballot.  If this happens a lot in a jurisdiction, the fraud is more likely to be noticed.

Were a disproportionate number of absentee ballot requests being generated among likely non-voters in the 9th CD?  Yes, but mostly in Bladen County.

To investigate whether this type of calculation may have played into the strategy, I looked a bit more closely at the unreturned absentee ballots in the recent North Carolina election.  I hypothesized that registered voters who had not voted in a long time would be more likely to have an absentee ballot request manufactured for them than a regular voter.  To test this hypothesis, I went to the North Carolina voter history file, and counted up the number of general and primary elections each currently registered voter had participated in since 2010.  There have been nine statewide elections in this time (5 primaries and 4 general elections, not counting November 2018).

Sure enough, frequent voters were less likely to have an unreturned absentee ballot  than non-voters.  Statewide, voters who had participated in the past 9 statewide elections had a non-return rate of 14%, compared to a non-return rate of 32% for those who had never voted.  (Among those who had never voted, but had registered in 2010 or before, the non-return rate was 38%.)  In the 9th CD, these percentages were 25% and 43%, respectively.  In Bladen, they were 22% and 72%

Interestingly enough, in Robeson County, which had the highest non-return rate in the district — and in the state — the relationship between being an infrequent voter and not returning the absentee ballot was not as strong.  Among registered voters who had not cast a ballot since 2010, 81% failed to return their absentee ballot.  Among those who had voted in every election, the non-return rate was 60%.

The accompanying graph shows the more general trend.  The grey circles represent each county in North Carolina.  (Counties in more than one CD show up more than once.)  Throughout the state, infrequent voters are more likely to request absentee ballots that are not returned.

Bladen County is highlighted with the blue hollow circles.  Robeson is highlighted with the hollow red circles.  All the other counties in the districts are the hollow green circles.

If the unreturned absentee ballots reflect, in part, artificial generation of absentee ballot requests, the logic of who was getting targeted looks to have been different in Bladen and Robeson Counties.  Bladen County’s non-returns look more like they were associated with the strategy of requesting absentee ballots from people who would not notice.  Something else was going on in Robeson County.

A Quick Look at North Carolina’s Absentee Ballots

News comes that North Carolina’s State Board of Elections and Ethic Enforcement has chosen not to certify the results of the 9th congressional district race, which was (provisionally) won by the Republican Mark Harris over Democrat Dan McCready by 905 only votes. News accounts provide speculation that this is related to “irregularities” among absentee ballots in the district.  Because North Carolina has such a great collection of election-related datasets, I thought I’d dive in quickly to see what we can see.

(For the data geeks out there, go to this web page, and enjoy!)

My interest is guided by a number of statements that have appeared in news sources and filings with the SBOE.  Among these are:

  • Charges of an unusually large number of mail absentee ballot requests in the “eastern” part of the district, especially Robeson and Bladen Counties.
  • Charges that an unusually high proportion of mail absentee ballots were unreturned.
  • Charges that “ballot harvesters” were gathering up ballots and collecting them in unsealed envelopes (presumably allowing the harvesters to fill in choices on the ballot and then submit them).

What do the data show?  Here are some quick takes.  This is certainly not the last word, but reveals what one can glean from the SBOE’s public data.

Number of ballots by county

It certainly is true that Bladen County had a disproportionately high level of absentee ballot usage in the 2018 congressional election, but it goes beyond Bladen County and beyond the 9th CD.  The accompanying graph shows the percentage of votes that were cast by mail absentee ballots for each district-county unit.  (For instance, Mecklenburg County is in two districts, so it appears twice in the graph,  once for each district.)  The part of Bladen County that is in the 9th District did cast the highest percentage of mail absentee ballots in a congressional race, at 7.3%.  In the entire district, 3.8% of ballots were cast absentee.  And in the part of Bladen County that is not in the 9th District, a lower percentage (4.6%) was cast by mail.

(As with all the graphs in this post, you can click on them to enlargify them.)

Note, however, that Mecklenburg County also cast a notably high percentage of mail ballots in the race — 5.8% of all votes.  Also, because Mecklenburg is about ten times larger than Bladen, it turns that that its absentee ballots (over 5500) swamped Bladen’s (nearly 700).

Finally, it should be said that one other county, Yancey, is an even bigger outlier, if what we’re looking for is a comparison of mail absentee ballot use with the rest of a district.  Nearly six percent (5.6%) of Yancey’s votes were cast by mail, compared to 2.4% in the rest of the 11th district.

Party composition of ballots by county

For absentee ballots to have a major influence on the outcome of a race, they need to overwhelmingly support one of the candidates.    Here, we encounter even more interesting and unexpected patterns.

In this case, the accompanying graph has two parts.  The left part is a scatterplot of the percentage of the two-party vote given to the Democratic congressional candidate in all mail absentee ballots (y-axis) against the percentage of the vote given to the Democratic -congressional candidate in all ballots.  Again, the unit is the county-district.  The red dashed line is set to 45-degrees (ignoring the aspect ratio).  Most counties are above the red line, indicating that in most counties, Democratic congressional candidates did better in the mail absentee vote than they did in the other voting modes.  The data tokens are clustered around the line.  There are outliers, to be sure — a few counties are below the line, where Republican candidates actually out-performed in the absentee ballots, and a few are well above the cloud of circles.

The right part of the graph pulls out the counties that are part of the 9th CD.  There are three counties of note (at least) in the graph.  The first is our friend, Bladen County, which is identified here as one of the few counties in the state in which the Republican congressional candidate actually did better in the mail absentee ballots than in the other modes.  No wonder Democrats were suspicious.  At the same time, Union and Anson Counties are outliers on the other side of the equation.  Union County’s absentee ballots were 21 points more Democratic than votes overall.

As an aside, in the part of Bladen County that is in the 7th congressional district, the Democratic share of the mail absentee vote was 86.6%, compared to an overall Democratic share of 61.3% in that part of the county.  It makes one wonder whether the Democrats and Republicans were concentrating their efforts to get their supporters to cast mail ballots at opposite ends of the county.

Unreturned ballots

This is where it gets interesting.  Some of the speculation that has been floating around suggests that there was a significant number of unreturned mail absentee ballots in the district.  This has been attributed to a number of things.  It could be that political activists were requesting ballots for voters without their consent, and those ballots simply went unreturned.  Another possibility is that “ballot harvesters” were going door-to-door asking people to give them their ballots — and then maybe not delivering them to the county.

I looked at the percentage of requested mail absentee ballots that were never returned for counting, and sure enough, Bladen and Robeson Counties stand out.  The pattern stands out in the accompanying graph, which really needs to be enlarged to be fully appreciated.  (Again, you can enbiggify the graph by clicking on it.)  The graph shows the percentage of mail absentee ballots requested by Democrats (blue dots), Republicans (red dots), and unaffiliated voters (purple dots) that were unreturned in each county.  I have made the dots associated with the counties in the 9th district a bit bigger.  Statewide, about 24% of mail absentee ballots were not returned after being requested — 27% of Democrats, 19% of Republicans, and 24% of unaffiliated.  In Anson, Bladen, and Robeson Counties, the nonreturn rates were 43%, 47%, and 69%, respectively.

Robeson County stands out, because not only is the overall nonreturn rate high, but the partisan discrepancy is so high, as well.  The overall nonreturn rate 69%, but it was 73% for ballots requested by Democrats and 66% for ballots requested by unaffiliated voters.  Still, the Republican nonreturn rate was also unusually high, at 49%.

Some news accounts remarked that Robeson County officials started noticing batches of absentee requests being delivered in August, and started keeping track.  This made me wonder whether the unreturned ballots were associated with these batch requests.  To explore this, I calculated the percentage of mail absentee ballots that were unreturned, based on the week of the year when they were requested.

That led to the accompanying graph.  The grey circles represent the fraction of mail ballots requested each week of 2018 that ended up not being returned for counting, in each county.  Note that the grey circles become a grey blob toward the end.  The black line shows the average nonreturn rate for the whole state, as a function of the week when the ballot was requested.  The hollow blue circles represent Robeson County.  Note the large number of unreturned ballots that appear after week 30 — the August period noted before.  After Labor Day, the nonreturn rate in Robeson fell, although it was still high by statewide standards.

I’ve also shown the Bladen and Anson nonreturn rates by week.  We don’t see the same patterns in these counties that we see in Robeson.

Some concluding remarks

The purpose of this post has been to show the reader the type of numerical exploration one can engage in, using data provided by the North Carolina elections board on its incredible data page.  The analysis seems to confirm the suspicious that “something’s going on” with absentee ballots in the 9th district, but it also suggests complications that aren’t always clear from news accounts.  It seems quite likely that the campaigns — or individuals acting to support them — targeted absentee ballots in some counties, and not just in the 9th district.  (I have generated similar graphs to the ones shown here for the 2016 election, and there are some stories to be told…)  Whether this was just a small bit of tactical political warfare or something more nefarious, we’ll have to wait to see.


Confidence in Election Cyber-Preparedness Sees Post-Election Improvements

Pre-election worries about the conduct of the 2018 election centered on the threats of cyber-attacks on election systems from abroad and hacking of voting machines from, well, everywhere.  Although the election produced the usual supply of stories that raised concerns about election administration overall, there was no verified successful attack on computerized election equipment this year.  The question this raises is whether this news percolated down to the general public.

Based on public opinion research I conducted after the election, it seems that it did.

However,the public was already becoming more optimistic about cyber-preparation before the election.  Last June, 53% of the public stated they were either very or somewhat confident that local election officials had “taken adequate measures to guard against voting being interfered with this November, due to computer hacking.” By October, this proportion had risen to 62%.  Immediately after the election, 68% of the public stated they were either very or somewhat confident that local officials had, in fact, taken adequate measures to guard against computer hacking in the election.

Not surprisingly, both before and after the election, attitudes about election cyber-preparation were structured along partisan lines. Republicans were more confident than Democrats in June (66% vs. 51%), October (80% vs. 60%), and November (79% vs. 71%).

What is probably more interesting is that attitudes about cyber-preparation also varied by respondent education and attention to the news.   As we will see, the pattern of responses by education was especially interesting.

The data in this post were taken from three surveys I conducted during June 7-11 and October 5-7, before the election, and during November 7-9, after the election.  In each case, I interviewed 1,000 adults as a part of the YouGov Omnibus survey.  The research was supported by a grant from NEO Philanthropy, which bears no responsibility for the results or analysis.

Partisan attitudes

Unsurprisingly, attitudes about election administration have become structured around partisanship for many years.  In the case of attitudes about cyber preparations, in June Republicans were 14 points more likely to agree that local officials were taking adequate precautions against computer hacking in the upcoming election.  By October, that gap had opened up a bit to 17 points, although both Democrats and Republicans had become more confident across those four months.

Experience from the election did not change how Republicans viewed cyber preparations, but it did alter the views of Democrats quite a bit.  Republicans were still more sanguine, but the gap between Democratic and Republican attitudes had been cut in half.

Respondents who were neither Democrats nor Republicans — which includes both “pure” independents (about 17% of respondents) and minor-party identifiers (6%) were much, much less likely to express confidence in preparations about computer hacking across all three surveys.  They were also immune to changing opinions across the five months.

Interest in the news

The fact that partisans of all stripes became more confident in the preparations of local election officials to handle computer security suggests there were other factors that led Americans to change their attitudes about cyber preparations. What might these be?  A couple come immediately to mind.  The first is attention to the news.  The second is education.

The YouGov omnibus has a question intended to measure how closely respondents pay attention to the news and public affairs: “Would you say you follow what’s going on in government and public affairs … most of the time/ some of the time/ only now and then/ hardly at all.”

Throughout the past five months, the respondents who were the most confident that local officials had taken adequate precautions against election hacking were also the most likely to follow what’s going on in government.  Right after the election, 78% of those who followed public affairs “most of the time” had confidence in these preparations, compared to 69% of those who followed public affairs “some of the time” or “now and then.”  Among those who followed public affairs “hardly at all” or who didn’t know, only 34% were confident.

In addition, respondents at all level of attention to public affairs increased their confidence in the adequacy of computer-hacking preparations over the three surveys.

The fact that high-information respondents — political junkies — have consistently expressed the greatest confidence in the adequacy of the response to potential election cyber attacks is interesting, considering the amount of negative press that election officials received before the election about their security preparations for the 2018 election.  This finding suggests that the negative tone of many of these articles did not sink into the consciousness of all readers.  Or, it could suggest that high-information respondents already are more likely to trust election officials as a general matter any way.

Education

The correlations between educational attainment and attitudes about cyber preparations are probably the most interesting in the surveys.  All educational groups became more confident over time in the degree of preparations to counter hacking the election.  However, one group stands out in how this correlation changed — those with postgraduate degrees.

Back in June, when the question about cyber preparation was first asked, respondents with postgraduate degrees were by far the most skeptical.  Only 43% of postgraduates had confidence in the level of preparation, compared to 54% of all other respondents.

As summer turned to fall, all groups, with the possible exception of those with no more than a high school education, became more confident, but the biggest movement came from those with postgraduate degrees.  Finally, in the month that bracketed the election, all educational group became more confident, but the increase in confidence among postgraduate degree-holders is especially striking.

Opinions and election machines

Finally, one of the major topics in the election security realm was the fact that about 20% of voters, including all in-person voters in five states, continued to cast ballots on paperless voting machines (direct-recording electronic machines, or DREs).  The past couple of years have seen a relentless attack on these machines by reform groups and expert bodies (including one I served on), and so it would be natural to see if voters from states with a high degree of DRE usage had a lower opinion about hacking preparations at the state and local level.

It is notable that in the five states that rely entirely on DREs without a voter-verifiable paper audit trail (Delaware, Georgia, Louisiana, New Jersey, and South Carolina), a majority of respondents were not confident in computer hacking preparations in the summer.  In June, 42% of respondents from these fives states expressed confidence, compared to 54% of respondents from all other states.  By October, these numbers had tightened up, to mere 58%/63% differential.   Finally, in the November poll, 67% of respondents from the all-DRE states were confident in their states’ preparations to combat computer hacking, compared to 69% of respondents in the non-DRE states.

The number of voters in the surveys from the DRE states is relatively small (only about 90), so I would not bet too much on this analysis.  However, as I have written before, (see this link, for instance) up until recently, voters in all-DRE states have been quite confident in the voting machines they use.  The fact that respondents in these states may have been less confident in overall computer hacking preparations during the summer may be further evidence in the gradual erosion of confidence in these machines, where they are being used.  Still, we don’t see evidence here of those voters being more worried about whether their states are adequately pushing back against the dangers of hacking elections.

Conclusion

Computer security is a new topic in the area of election administration for most of the public.  It is unsurprising, therefore, that attitudes are fluid.  Like other election-administration attitudes, they are amenable to being viewed through a partisan lens.  But, because the issue is so new, attitudes about hacking are also amenable to being changed by unfolding events.  No verifiable computer attacks on voting machines were reported in 2018, and some of the public picked up on it.  Whether this positive state of affairs remains unchanged is, of course, subject to the unfolding of history.  It will be interesting to see what happens, as we move into the 2020 election season, and the outcome of the election (and thus the threat environment) moves to a different level.

Boom or Bust in 2018 House Election

Every indication suggests that the 2018 midterm election will come in as expected from longstanding political models:  seat losses in the House for the president’s party in the midterm, like usual, and a standoff in the Senate, which is also to be expected, given the specific configuration of the president’s party in 2012 and 2018.  (On this latter point, see my post from yesterday by clicking here.

Despite the fact that the auguries are pointing toward a Democratic pick-up in the House, fretting is beginning to emerge over whether the pick-up might evaporate or, at the very least, may not be big enough to give the House Democrats the freedom they would like to dominate business in the House.  While the former is highly unlikely, the latter does have some basis in the facts about the marginal House seats in 2018 — that is, the seats on which control of the House will turn in this election.

To appreciate the situation, we first need to return to the election of 2016 and the distribution of returns from the House election.  The accompanying graph shows the percentage of the two-party vote received by the Republican candidate in each district. (Click on the graph to enlargify.)

The dashed line shows the location of the median district — the 218th from the left, or the district that would flip the House to Democratic control if we added the same percentage of Democratic votes to each district.  That district  (NC-2) had a Republican two-party vote share of 56.7% in 2016.  Thus, if we were to shift the entire distribution to the left by 6.7 points, we get a majority  of Democratic seats.

Note, however, that the median district is located right as the fat part of the two-party vote-share distribution begins for Republicans.  This means that if the shift in vote share from 2016 is just slightly less than 6.7 points, it won’t make much of a difference in the party distribution of the House — other than the fact that Republicans still control it — but if we shift it slightly more than 6.7 points, it makes a huge difference.  If, for instance, the shift is a point greater, at 7.7 points, Democrats control the House with 14 seats to spare; at a shift of 8.7 points, Democrats control the House with 25 seats to spare.

As of right now, the FiveThirtyEight models are consistent with a shift of about 8.5 points compared to 2016.  That’s consistent with a healthy Democratic majority, but also notice that because of the distribution of partisan support in the pivotal districts, it’s possible for the actual outcome to significantly over- or under-shoot that mark.  It’s for that reason that the Democrats’ fortunes are in “boom or bust” territory:  If they come in slightly ahead of expectations on the popular vote, they will have a healthy majority to control the chamber with.  If they come in slightly behind expectations, controlling the chamber will be very, very difficult, from a practical perspective.

Caveats and conclusions

The analysis I just performed is a simplistic version of “uniform swing analysis,” which has been around in political science for a century.  The advantage of uniform swing analysis is that it gives us intuitions about how more sophisticated modelling techniques work.  Without reference to the 2016 two-party vote distribution, for instance, it is not necessarily clear why the various modelers are hedging their predictions a bit.  All models are uncertain, of course, but 2018 is especially uncertain because of how partisan support arrays itself among the pivotal House districts.

On the whole, new- and old-school of models midterm elections are pointing to a Democratic pick-up of seats in the House.  The degree of that pick-up is hard to nail down at this point, mainly because of the districts that are in play.

Election Fundamentals in 2018

The modelers at FiveThirtyEight have made a compelling case that we should expect Republicans to pick up a seat or two in the upcoming U.S. Senate election.  The purpose of this post is to show that this is essentially the same prediction we would have made two years ago, once we knew a Republican would be president at the midterm.

Before launching in, I must do my political science duty by recommending a symposium on election forecasting that appeared in  the October edition of PS: Political Science and Politics.  You can access that symposium by clicking here.

In the interest of brevity, I am leaving aside the intellectual justifications for the two simple predictive models I will use here.  The first model, the presidential partisanship model, predicts the net change in seats experienced by the president’s party at midterm by taking into account (1) the party of the president who won when the current class of senators was last elected and (2) the party of the president at midterm.  The second model, the seats-at-risk model, substitutes the number of seats held by the incumbent president’s party for the party of the president who won the last time this class of senators were up for election.

Presidential partisanship model

The presidential partisanship model focuses on the role of the president in driving outcomes of national elections.  It is obvious that we would take into the account the party of the incumbent president in predicting the outcome of a midterm Senate election, because midterm elections are always, in part, a referendum on the incumbent’s performance.  We take into account the party of the previous president because the class of senators running for reelection in a midterm were last elected when the previous president was on the ballot.

For 2018, Republican Senate candidates are disadvantaged by the fact that the incumbent president is a Republican.  This would be true if the Republican were named Donald Trump or John Kasich.  Since 1946, Republicans have lost an average of 2.9 seats in the Senate when the president at midterm has been a Republican, compared to gaining 4.4 seats under Democratic presidents.

At the same time, Republican Senate candidates in 2018 are helped by the fact that the class of senators up in 2018 was last elected in 2012, which was a moderately good Democratic year — Barack Obama was elected president, Democrats picked up a net of eight seats in the House, and picked up two seats in the Senate.  Since 1946, Republicans have gained an average of 3.6 seats in the Senate when the previous president was a Democrat, compared to losing 2.0 seats when the previous president was a Republican.

We can put these two factors together.  The accompanying table shows the average change in Republican Senate seats since 1946, based on the party of the current and previous president.  The cell colored yellow is the one relevant to 2018 — Republican incumbent and Democrat previous president.  Note that the average change in Republican seats under these circumstances has been half a seat, which is essentially the same as FiveThirtyEight’s prediction of 0.8 as of this morning (Sunday before Election Day).

Seats-at-risk model

The seats-at-risk model can be thought of as modifying the presidential partisanship model in one important way.  Rather than just noting the partisanship of the previous president, we can note how much of a boost to that president’s party was experienced in the senatorial election.  It is reasonable to expect that Senate candidates swept into office on the coattails of a presidential candidate will do worse the next time the president is not on the ballot.  If the president has long senatorial coattails, that means the number of vulnerable Senate seats will be greater six years later (without the same president on the ballot)  than if the coattails were short.

The numbers bear this out.  Since 1946, 14.7 Republican seats have been “at risk” in each midterm Senate election.  In elections with more than 14 seats at risk, Republicans have lost an average of 1.7 seats; with fewer than 14 seats at risk, they have gained an average of 3.9 seats.  Not surprisingly, controlling for seats at risk, Republicans have done better when the incumbent president was a Democrat than when he was a Republican.

One way to illustrate this is in the accompanying figure.  The figure is a scatterplot that shows the net change in Republican seats plotted against the number of Republicans up for re-election.  Red circles are midterms with Republican incumbents; blue circles have Democratic incumbents.  The two lines are simply the result of fitting a linear regression through the data, with a dummy variable indicating whether the incumbent president is a Republican.

This graph illustrates the two major features of the seats-at-risk model.  First, fewer Republicans up for re-election are correlated with more Republican gains in the Senate.  Second, Republican presidents at midterm are associated with smaller gains/bigger losses.

On the x-axis I have indicated the number of Republican seats up for reelection in 2018, eight.  Note that the point prediction of the change in Republican seats in 2018 is a pick-up of 0.8, precisely what FiveThirtyEight is predicting today.

Caveats and conclusions

The point of this posting has been to provide a bit of historical context to the most likely outcome of the upcoming Senate election — Republicans might pick up a seat or two.  These models — and the much more sophisticated ones that one can read in the political science literature — don’t need to know anything about the factors that are currently the subject of so much discussion, such as the unpopularity of the president, political polarization, the mobilization of the resistance, and the counter-mobilization of the President’s base.

There are two things that this posting is not.  First, it is not a dig at more sophisticated models, such as one finds in the political science literature or on websites such as FiveThirtyEight.  In fact, it’s just the opposite.  The value of these more sophisticated models is that they allow us to probe generic “fundamental” expectations in more depth.

Second, this posting is not an effort to argue that campaigns don’t matter, or that current political activism doesn’t matter.  Yes, as I’ve noted, it’s possible to generate plausible predictions about the outcome of the 2018 Senate election without any reference to any “real world” politics.  But, it’s also important to note that these simple models work because they are characterizing a political system that is in a type of equilibrium, such that when one set of conditions is met — for instance, a Republican incumbent is in place at midterm following a Democratic president — the political environment shifts in predictable ways.  Those working pieces are difficult, if not impossible, to model with a high degree of confidence.  That’s why we work with the simpler models.

We won’t know whether these predictions work out until all the votes are counted, which won’t be until the days and weeks following Election Day.  We can be certain that the actual results will deviate from the predictions, at least somewhat.  But, I’m also feeling confident that the analytical tools at our disposal will help up to make sense of what can sometimes seem like chaos.

North Carolina Embraces Early Voting Like Never Before

The number of people voting early, in person, in North Carolina — what most of the country calls “early voting,” but what North Carolina calls “one-stop absentee voting” — has exploded in 2018.  (For this post, I will use the more common term “early voting” to refer to North Carolina’s one-stop process.)  As of last weekend, over 1.1 million Tar Heels had cast an early vote, which is essentially the total number of people who cast early votes in all of 2014, and roughly three times the number of early votes cast at comparable times in 2010 and 2014.

So what?

Two things make this interesting.  First, in most states, North Carolina included, early voting has been a presidential-year phenomenon, with early voting rates falling back in midterm years.  For instance, in 2012 56% of all North Carolina ballots were cast early; in 2014, that fell to 37%.  In 2016,  60% of ballots were cast early.  That would lead us to believe that something like 40% would be cast early in 2018 under normal circumstances.  Let’s say that a total of 3.5 million North Carolinians will vote this year, which is a 20% increase over 2014, and in any other year would be an outrageous prediction.  Forty percent of 3.5 million is 1.4 million early votes.  We’ve nearly achieved that number, and we’re more than a week away from Election Day.

The second reason the surge in early voting is interesting is that North Carolina is not on the national radar this year.  Its statewide offices are elected in presidential years, and neither U.S. Senate seat is up this cycle.  Conventional wisdom has held that up-ticks in convenience voting — early and absentee voting — are typically driven by the campaigns, especially the national campaigns.  The early voting surge in North Carolina is driven entirely by what’s happening in North Carolina, not by the mobilization efforts of the national campaigns.  This is interesting.

To return to the data, the accompanying graph shows the cumulative number of early voters at comparable points in the pre-election periods of the three most recent midterm elections.  (As always, click on the graph to enlarginate it.)  The cumulative number of early votes for each year are plotted against a comparable “countdown to election day.”  The three lines all start at different places along the x-axis, reflecting how the General Assembly has altered the early voting period over the past five years — reducing it by a week for 2014 (later struck down by the 4th Circuit) and then adding a day for 2018.  As of yesterday, the preliminary count is over three times greater than at a comparable time in 2010 or 2014, and has already surpassed the number of early votes in 2014.

What about party and race?

The total number of early voters is of interest to election geeks, both those interested in election administration and those interested in campaign mobilization.  What about the politics of the numbers we see thus far?

Trillions of electrons are currently being spilled, trying to divine next week’s election outcomes based on the early vote totals.  In North Carolina, at least, and probably elsewhere, that’s a fool’s mission.  At best, the early vote numbers, broken down by party, are only weakly predictive of the final election results.

Nonetheless, part of the discussion about early- and absentee-voting numbers revolves around the types of voters who gravitate toward these modes.  With that more minimalist perspective, what do the North Carolina numbers tell us?

Party

Let’s start with party.  Are Republicans or Democrats more likely to avail themselves of early voting this year?  Thus far, Democrats are more likely than Republican to use early voting, relatively speaking.  However, compared to 2014, the disproportionately greater use of early voting by Democrats has declined.  Thus, the surge in early voting in North Carolina is being driven more by the surge of Republicans than the surge of Democrats.

Here are some details.

As of yesterday, approximately 473,000 Democrats and 333,000 Republicans had voted early, which puts the Democrat-to-Republican ratio at 1.42:1 among early voters.  This party ratio in the use of early voting needs to be compared to the Democrat-to-Republican ratio among registered voters, which is currently 1.27:1.  Because 1.42 is greater than 1.27, we can say that Democrats are disproportionately using early voting.  But, hold that thought; we’ll come back to it..

The accompanying chart shows how the ratio of Democratic-to-Republican early voters has played out in 2018, and in comparison with 2010 and 2014.  The blue line in the graph essentially reproduces the calculation I performed in the previous paragraph for each day of early voting this year.  It takes the Democrat-to-Republican ratio of early voters and divides by the Democrat-to-Republican ratio of registrants.  Numbers greater than one indicate that early voting is being used disproportionately by Democrats; numbers less than one indicate early voting being used disproportionately by Republicans.

Note that this “ratio of ratios” measure has been quite different in 2010, 2014, and 2018.  In 2010, early voting was used disproportionately by Republicans, although there was a significant surge of Democrats toward the end that brought its use into something closer to parity.  In 2014, early voting was heavily favored by Democrats, especially at the beginning of the early voting period, with Republicans disproportionately coming in at the end to even things out a bit.

In 2018, the disproportionate use of early voting by Democrats has held steady for the past week.  While Democrats are more likely to vote early in 2018 than Republicans, they are less so than in 2014.  What this means, interestingly enough, is that although Democrats are more likely than Republicans to vote early in 2018 (at least thus far), the surge in early voting compared to 2014 is being drive disproportionately by a flood of new Republican early voters.

Race

What about race?  Thus far, it appears that African Americans have taken advantage of early voting at a lower rate than whites.  This patterns is in stark contrast with 2014, when there are a significant surge toward early voting among African Americans, and similar to the patterns of 2010.  Note that in 2010, and somewhat in 2014, there was an uptick in African American early voting participation as the early-voting period drew to a close.  Thus, it may end up being that African Americans use early voting at rates comparable to that of whites in 2018, but it would be a shock to see the numbers begin rivaling those of 2014.

Conclusion

For the remainder of the early voting period, I plan to update the three graphs that are reported in this post.  It will be interesting to see what these numbers go.  Because early voting only accelerates as Election Day approaches, it is safe to assume that early voting this year will be of historical proportions by the end of the week.  If the early voting rates match the 2016 rates, Election Day will be pretty quiet in the Tar Heel State, even as voting has changed significantly.

More Thoughts on North Carolina’s Early Voting Changes

I was quoted this morning in a story by Alexa Olgin from WFAE in Charlotte about the start of early voting in North Carolina.   This gives me a chance to dig out some old research I’ve done on the North Carolina legislature’s past actions to restrict early voting hours in the Tar Heel State, and to state why I believe the most recent change in early voting hours will inconvenience voters and waste local tax dollars.

(Nomenclature note:  North Carolina refers to early voting as “One-Stop” absentee voting.  Here, I use the more common colloquial phrase.)

Last summer the legislature changed North Carolina’s early voting law to mandate that all early voting sites that are open on a weekday have the same hours, 7 a.m. to 7 p.m.  Supporters in the legislature maintained that the purpose was to reduce confusion about when polling places would be open.

Unfortunately, in all likelihood, the law will increase congestion (again) during early voting.

A Little Throat Clearing to Begin

Before proceeding, I need to lay out two facts, in the interest of full disclosure.

First, as almost everyone reading this blog knows, my major message in the elections world is that data’s our friend.  Whether voters are confused about early voting times in North Carolina is an empirical question.  I know of no direct evidence on this point.  The fact that North Carolina was fourth in the nation in 2016, in terms of the fraction of votes cast early, suggests that a lot of voters have figured it out.

In the face of limited (if any) direct evidence of early voting confusion, we have to weigh the practical impact of requiring uniform hours that stretch for 12 hours starting at 7 a.m.  In 2014, when counties were essentially required to do the same thing, relatively few voters took up the counties on their offers to vote earlier and later in the day.  It’s likely the same will be the case in 2018.

Second, as some people don’t know, I served as an expert witness on behalf of the U.S. Department of Justice when it sued the state over changes to its voter laws in 2013, including a reduction in the number of days available for early voting.  In my role as expert, I filed a few reports about the likely effects of changing the early voting laws.  You can read the relevant reports here and here.

The New Law Mandates Early Voting Sites Be Open at the Wrong Times

To continue.

What is wrong with mandating that all early voting times maintain uniform hours of 7 a.m. to 7 p.m.?  The main problem is that most early voters don’t utilize the earliest and latest hours of early voting.  In both 2010 and 2014, the last two midterm elections, three-quarters of weekday early votes were cast between 10 a.m. and 5 p.m.; 90% were cast between 9 a.m. and 6 p.m.

Readers may recall that North Carolina’s legislature passed a law in the summer of 2013 (HB 589, or VIVA, for “Voter Information Verification Act”) that reduced the number of early voting days from 17 to 10.  It also required that counties maintain the total number of hours of early voting in 2014 as they had in 2010.

The law was invalidated by the Fourth Circuit Court of Appeals ahead of the 2016 election, but was in effect for the 2014 election.  Thus, we can see what happened the last time the legislature tried to mandate to the counties when they offered early voting.

(For readers desiring to know more about the details of the law’s change and effects, check out this recent article by Hannah Walker, Michael Herron, and Daniel Smith in Political Behavior.  In contrast with this post, the Walker, Herron, and Smith article focuses on changes in 2016.)

Counties could do one of three things to comply with VIVA’s early voting provisions.  First, they could ask for a waiver, and not offer as many hours in 2014 as in 2010.  Second, they could just increase the number of hours their early voting sites were open without adding any additional sites.  Third, they could increase the number of early voting sites and keep the hours the same.

What did the counties do?  A few requested, and were granted, waivers.  On the whole, though, counties adopted a mix of the last two strategies, although it was heavily weighted toward expanding and shifting hours in existing sites.

First, the number of hours allocated to weekends increased by 55% while the number of hours allocated to weekdays declined by 7.6%.


Second, weekday hours were shifted from the 9-to-5 period to either very early (6-9 a.m.) or very late (5-9 p.m.).  The number of hours allocated to the 9-to-5 period fell 17% while the number of before-work hours grew 15% and the number of after-work hours grew 7.2%.  (The accompanying figure shows the distribution in the hours offered on weekdays to early voters between the two years. Click on the image to biggify.)

Did early voters respond by “going to where the hours were?”  Yes and no.

The accompanying figure shows the hours of the day when early voters cast their ballots in 2010 and 2014.  It is true that many more early voters cast ballots after 5 p.m. in 2014 than in 2010.  It is also true that more early voters cast ballots during the 9-to-5 period, as well — the period when counties cut the number of hours.

The result was that the state did not meet the demand for early voting when the voters wanted it.  Between 2010 and 2014, the number of 9-to-5 early voters increased by 9.9%, despite the fact that the number of hours offered for early voting fell by 17% during these hours.

The result was to create an over-supply of voting times available for after-hours voters while doing nothing about the under-supply of mid-day times, or reducing the over-supply that already existed for voting very early in the morning.

This mismatch of the supply of early voting hours with demand is illustrated by the following graph, which compares the distribution of times when early voters cast their ballots with the distribution of times when the early voting sites were open.  Note that in 2010, hours available exceeded voters voting up through 11 a.m., at which point the ratio of available hours-to-voters shifted.  This imbalance remained until around 3:30, when supply-and-demand evened out.

In 2014, the over-supply of early-morning hours actually increased a bit while the under-supply of early-voting hours remained.  And, what had been a good match between supply-and-demand after 5 p.m. became an over-supply of available hours in 2014.

In short, the response of counties to the legislative mandate was to shift hours to times when early voters were relatively uninterested in casting ballots while doing nothing about mid-day congestion.

Early Voting Congestion in North Carolina

The surest sign of congestion is wait times.  I’ve worked hard to help states and local jurisdictions match resources to voters, to reduce wait times.  What happened in North Carolina in 2014 is an example of what not to do.

The simplest measure of congestion at polling places is wait times.  According to answers to the SPAE, North Carolina’s are among the longest in the country when it comes to early voting.  In 2014, North Carolina’s average early-voting wait time was 8.5 minutes (+/- 2.9 min.), compared to 4.2 minutes (+/- 0.4 min.) in the rest of the nation.  In 2016, North Carolina’s average early voting wait time was 18.9 minutes (+/- 5.1 min.), compared to 12.4 minutes (+/- 1.0 min.) nationwide.

So, while there is no hard evidence that North Carolina’s voters are confused about the times when early voting sites are open, there is evidence that North Carolina’s early voting sites are congested, and more congested than the rest of the nation.  One source of this congestion is probably the under-availability of early voting hours in the middle of the day during the week.  Forcing counties to offer more early voting hours before 9 and after 5 not only strains county budgets, but it requires counties to exacerbate existing congestion problems.

There is (at least) one important caveat here:  The analysis I’ve offered is at the state level.  Important decisions about early voting are made at the local level, even when the legislature imposes mandates.  That means that the problem of the mismatch between the supply and demand of early voting during the day varies across counties.  In some places, the problem will be worse than I describe here, but in other places, it will be better.

Q: Why Don’t Early Voters Vote Before and After Work?  A: They Don’t Work on the Day They Vote

One thing seems to have been missed in all this effort to mandate when counties offer early voting in North Carolina:  most early voters are not trying to accommodate their work schedules on the day they vote.

In 2014, I was able to do an over-sample of 10 states as a part of the Survey of the Performance of American Elections, one of which was North Carolina.  In these states, I interviewed 1,000 registered voters (not the typical 200 in the regular nationwide survey) and asked them about their experience voting.  Thus, I had a healthy number of early voters in North Carolina (353) to talk to.

One question I asked was, “Please think back to the day when you voted in the 2014 November election.  Select the statement that best applies to how voting fit into your schedule that day.”  The response categories included things like “I voted on the way to work or school” and “I voted during a break in my work- or school day.”

One of the responses categories was “I did not have work or school the day I voted,” which 64% of early voters chose as a response.  This compares to 52% of Election-Day voters. A disproportionate number of early voters were retired (32%) or permanently disabled (11%), compared to 23% and 5%, respectively, of Election-Day voters.

It is hard to believe that the expansion of early voting hours will drive retirees and the physically disabled out of the early voting electorate, nor will it bring in more full-time workers, who were not enticed to vote early in 2014.

Conclusion:  Legislative Mandates and Local Control

North Carolina has gotten to be known as the place where the legislature is happy to make changes to the state’s election laws and then leave it to the state and county boards of elections to figure out how to implement them.  The early voting mandate from this summer fits into this category.  While I am the last person to argue that state and local election boards make the right decisions all the time, I think that, on net, the evidence has been that county election boards in North Carolina have been trying to balance fiscal responsibility with demand for early voting within their localities over the past several years.  The blanket requirement that counties expand early voting hours to under-utilized times of the day undercuts these local good-faith efforts.

Of course, the evidence also suggests that some county boards have been under-providing hours in the middle of the day.  It would be nice if the legislature would turn its attention to that problem.  And, it would also be nice if they paid for it, too, but that’s another topic for another day.

Finally, am I predicting an early voting disaster in North Carolina this year?  No.  Midterm elections are low turnout affairs.  Even in this year when political interest is up, North Carolina has no big-ticket items on the statewide ballot.  The most likely outcomes to the added congestion and mis-match of supply-and-demand for early voting hours will be minor inconveniences in most places.

The real worry is 2020, when North Carolina will again be a presidential battleground state and the race for governor and U.S. Senate will no doubt be tight, as well.  In that environment, the new changes to the early voting law will come home to roost in North Carolina.  Can you say, “Florida 2012?”

Americans Are (Slightly) More Confident about Fending off “Computer Hacking” in the Upcoming Election

In recent months, Americans have become somewhat more confident that election officials are taking the steps necessary to guard against “computer hacking” in the upcoming election.  At the same time, likely voters have become no more (or less) confident that their votes will be counted as intended this coming November.

These findings are based on answers to questions posed to a representative national sample of 1,000 adults by YouGov last weekend.  The research was supported by a grant from NEO Philanthropy, which bears no responsibility for the results or analysis.  These questions, about computer hacking and overall voter confidence, were identical to ones asked last spring.  The results suggest that despite a fairly steady stream of negative journalistic reports and opinion pieces implying that election officials are unprepared for the November election (like here, here, and here), the public’s overall evaluations have remained steady, and certainly haven’t gotten worse.

A deeper dive into the data show many of the same traces of partisanship that are now common in attitudes about election administration.  For instance, Republicans are more confident about the upcoming election, both from a cybersecurity and general perspective.

Worries about election security

Concern about election security was measured by a question that read:

How confident are you that election officials in your county or town will take adequate measures to guard against voting being interfered with this November, due to computer hacking?

Overall, 27.5% responded “very confident” and 34.8% responded “somewhat confident.”  This compares to answers from last June, when the corresponding figures were 18.0% and 35.5%.

On net, the 9.5-point increase in the “very confident” response came in roughly equal portions from the two “not confident” categories.  Of course, because we don’t have a panel of respondents, just two cross-sections, it’s impossible to know how much individual opinion shifted over the five months.  Still, it is clear that the net opinion shift is in a positive direction.

The partisan divide over election security preparedness

Who shifted the most?  Only one demographic category really stands out upon closer inspection when we examine the change:  party.  Although confidence in protecting against election hacking rose among all party groups, the rise in the “very confident” response was greater among Republicans than among Democrats.  Independents also became more confident, but they were still more subdued than partisans.

The interesting case of political interest

One demographic had an interesting effect in the cross-section, but not in the time series:  interest in the news.

In both June and in October, respondents who reported that they followed news and public affairs “most of the time” were more confident that election hacking would be fended off at the local level than those who followed the news less often.

For instance, in June, 70.9% of Republican respondents who reported they followed the new and politics “most of the time” were either “very” or “somewhat” confident that local officials were prepared to fend off hacking in the upcoming election.  Republicans not so engaged in political news were less likely to report confidence, at 58.9%.  The comparable percentages for Independents were 54.5% and 35.2%, and for Democrats they were 53.5% and 49.0%.

In October, high-interest respondents of all strips were more confident than they had been in June.  However, neither the high- nor the low-interest groups grew  more confident faster than the other.  That’s what I mean when I write that the effect is “in the cross-section, but not in the time series.”

(One might read the previous table as suggesting that high- and low-information Democrats became more confident at different rates over the past four months.  However, the number of observations is so small in these subgroups that I wouldn’t make such fine distinctions with these data.)

What do I, and the respondents, mean by “computer hacking?”

Before moving on to voter confidence more generally, I want to address one question that I know some people are asking themselves:  What is meant by “computer hacking” in the upcoming election?  In March, I wrote about what election hacking means to voters.  You can read that post here.

I wrote back then that Republicans were more likely to define the general phrase “election hacking” in terms of domestic actors committing fraud of some sort, while Democrats were more likely to define it in terms of foreigners messing with our elections.

Assuming that this differential framing of the issue remains true today, we can imagine that the more sanguine view about computer security in the upcoming election means different things to the two sets of partisans.  It is likely that Republicans are becoming more convinced that state and local election officials have traditional election administration under control for the upcoming election.  Democrats, on the other hand, have most likely become slightly more convinced that election officials will be effective in fending off foreign intrusions.

Let’s see what they think when the election is over.

Coda:  Voter confidence more generally

The slight improvement in confidence about preparations to defend elections against cyber-attacks is in contrast with the lack of change in attitudes about overall voter confidence.

In addition to asking the cyber-preparedness question, I also recently asked respondents my two standard voter confidence questions.  The first, asked of all respondents, was:

How confident are you that votes nationwide will be counted as intended in the 2018 general election?

The second question, asked of respondents who said they planned to vote in November, was:

How confident are you that your vote in the general election will be counted as you intended?

These are commonly asked questions.  Others have asked them recently, such as the NPR/Marist poll in September.  Here, I take advantage of the fact that I regularly ask the question in the same way, using the same method, to see whether there have been any shifts as the election approaches.

There has been virtually no change in overall responses to either question since May, the last time I asked this question.  In May, 58.6% gave either a “very” or “somewhat” confident answer to the nationwide question, compared to 60.5% in October.  The comparable percentages for confidence in one’s own vote were 81.7% and 84.4%.  The changes across the five months are not large enough to conclude that anything has changed.

Drilling down more deeply into partisanship, we also see few changes that distinguish the parties.  Republicans gave more confident responses to both questions, but both parties’ partisans were virtually unchanged since May.

There is now a considerable literature on the tendency of survey respondents to express confidence in the overall quality of the vote count, either in prospect or in retrospect.  The findings I report here, therefore, are not path-breaking.  They do stand in contrast to attitudes about a newly prominent piece of election administration, computer security.  That piece is new to most Americans, and they are still getting their bearings when it comes to assessing the difference between hyped alarm and serious worry in the field.  It will be interesting to see how all this plays out in the next month, and in the weeks to follow.

Doug Chapin would, of course, say it more simpy:  stay tuned.


Blast from the Past: How Early Voting Can Serve as an Early Warning about Voting Problems.

Two of my best friends and closest confidants in this business, Paul Gronke and David Becker, just exchanged tweets about using early and absentee voting as an early warning device.  What this exchange brought to mind was the Florida congressional district 13 race in 2006, which I played a small part in as an expert witness for one of the candidates, Christine Jennings.  (You can see my old expert report here.)

First, the setting:  The 2006 Florida 13th congressional district race was, at the time, the most expensive congressional election in American history.  It pitted Republican Vern Buchanan against the Democrat Christine Jennings.  Buchanan was eventually declared winner by 369 votes, out of over 238,000 cast for the candidates.

What drew this election to national attention was the undervote rate for this race and, in particular, the undervote rate in Sarasota County, where Jennings had her strongest support.  In Sarasota County, 12.9% of the ballots were blank for the 13th CD race.  In the rest of the district, the undervote rate was 2.5%.  In the end, it was estimated that the number of “lost votes” in Sarasota County was between 13,209 and 14,739.  Because the excessive undervotes were in precincts that disproportionately favored Jennings, it was clear that the excess undervotes in Sarasota County caused Buchanan’s victory.

(As an aside, this was my first court case.  The biggest surprise to me, among many, was that the other side of the case — which consolidated the county, ES&S, and Buchanan — pretty much conceded that Buchanan’s victory was due to the undervote problem in Sarasota County.  But, that’s a story for another day.)

Here’s another piece of background, which gets us closer to the Becker/Gronke exchange:  Part of the evidence that there was something wrong with the voting machines, and not just Sarasota County voters choosing to abstain, was that the undervote rate in early voting and on Election Day was much greater than the absentee voting in that county.  This is important because early voting and Election Day voting were conducted on paperless iVotronic machines, whereas absentee voting was conducted on scanned paper.

The absentee undervote rate in Sarasota County was 2.5%, which was close to that of Charlotte County (3.1%), which was also in the district.  The early voting undervote rate was 17.6%, compared to 2.3% in Charlotte; the Election Day undervote rate was 13.9%, compared to Charlotte’s 2.4%.

Here’s the factiod from this case that the Becker/Gronke exchange brought to mind.  Note the difference in the undervote rate in Sarasota County between early voting (17.6%) and Election Day (13.9%).  The Election Day rate wasn’t dramatically lower than the early voting rate, but it was lower, and probably not by chance.

During the early voting period, voters complained to poll workers and the county election office that (1) they hadn’t seen the Jennings/Buchanan race on the computer screen and (2) they had had a hard time getting their vote to register for the correct candidate when they did see the race on the screen.  This led the county to instruct precinct poll workers on Election Day to remind voters of the Jennings/Buchanan race, and to be careful in making their selections on the touchscreen.

Of course, the fact that the undervote rate on Election Day didn’t get back down to the 2%-3% range points out the limitations of such verbal warnings.  And, I know that Jennings supporters believed that the county’s response was inadequate.  But, the big point here is that this is one good example of how early voting can serve as a type of rehearsal for Election Day, and how election officials can diagnose major unanticipated problems with the ballots or equipment.  It’s happened before.

Thus, I agree with David Becker, that early voting can definitely help election officials gain early warning about problems with their equipment, systems, or procedures.  I would amend the point — and I think he would agree — that this is true even if we’re not concerned about cybersecurity.  Preparing for elections requires that millions of small details get done correctly, and early voting can provide confirmation that the preparations are in order.

I don’t know of evidence that absentee voting serves as quite the same type of early-warning system, but it makes intuitive sense, and I would love to hear examples.

Two final cautionary thoughts about the “early voting as early warning idea,” as attractive an idea as it is.  First, I’m not convinced that many, or even any, voters will vote early because they want to help shake-out the system.  Indeed, there’s the possibility that if a voter believes there are vulnerabilities that will only become visible during early voting, but that are likely to be fixed by Election Day, it would drive them to wait until Election Day.  Let other people shake out the system and risk discovering that something needs to be tweaked or fixed.

Second, we always need to be aware of the “Robinson Crusoe fallacy” in thinking about how to respond to risk.  The Robinson Crusoe fallacy, a term coined by game theorist George Tsebelis in a classic political science article, refers to the mistakes one can make when we think we are playing a game against nature, rather than playing a game against a rational opponent.  If the game is against nature, the strategies you choose don’t influence the strategies the opponents choose.  (Think about the decision whether to bring an umbrella with you if there is a possibility of rain.  Despite what my wife and I joke about all the time, bringing the umbrella doesn’t lower the chance of rain.)  If the opponent is rational, your actions will affect the opponent’s actions.  (Tsebellis’s example is the decision to speed when you’re in a hurry and the police might be patrolling.)

A bad guy trying to disrupt the election will probably not want to tip his hand until as late as possible, to have maximal effect. Thus, “early voting as early warning” is probably most effective as a strategy to ensure against major problems on Election Day that occur due to honest mistakes or unanticipated events.

I don’t know if “early voting as early warning”  is the best justification for voting early, but it’s not a bad one, either.  It’s probably best at sussing out mistakes, and probably will be of limited use in uncovering attacks intended to hurt Election Day.

But, that’s OK.  I continue to be convinced that if any voter is going to  run into a roadblock in 2018 in getting her vote counted as intended, it will probably be because of a problem related to good, old-fashioned election administration.  The need to ensure that the blocking-and-tackling of election administration is properly attended to is reason enough for me to learn about the system from early voting.