Charles Stewart III, MIT
The 2020 election taught America what most political pros already knew: votes aren’t counted immediately, and there are partisan patterns in how election results unfold. America also learned new terms for these partisan patterns: the blue shift (if you’re academically oriented) and the red mirage (if you read Axios).
As Election Day approaches, it’s time to dust off what we learned about the blue shift/red mirage in 2020 and apply it to 2024.
Vote share trends in 2020
To jump to the chase, the following two graphs summarize partisan patterns to the reported vote in each state in 2020. Let’s start there.
The first graph shows Biden’s two-party vote share from the close of polls in every state through midnight on Wednesday following Election Day. (The subgraphs are admittedly tiny, so click on this link and zoom in if you’d like to take a closer look.) The blue circles show each vote report during this period. The gray line shows the percentage of the vote reported and when it was reported.
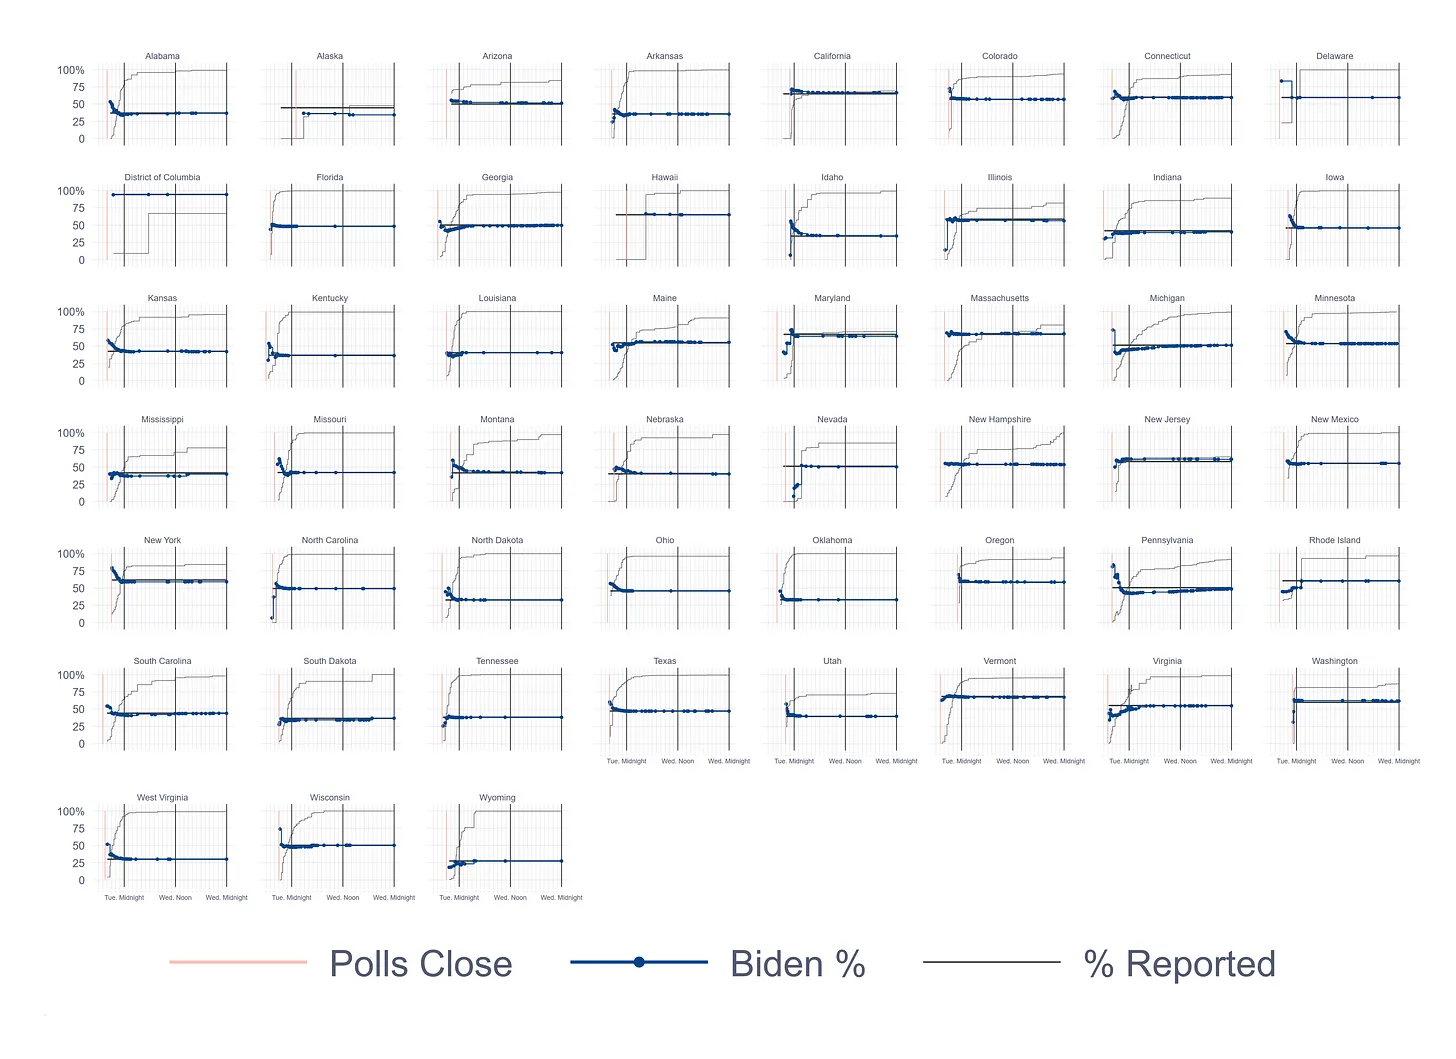
For an election data nerd like me, I can spend hours studying this graph, but a couple of things stand out. First, although the phenomenon is called the blue shift, suggesting a steady evolution of vote share from a Trump majority to a Biden majority, in fact, for many states, the pattern was nonlinear. Take Georgia, for example. The very first vote report, with 4% of the eventual vote reported, showed Biden with 55% of the two-party vote. However, his share quickly dropped until it bottomed out at 42% just an hour and a half later. At that point, Biden’s share of the reported vote started a slow and steady rise. (He did not overtake Trump until Thursday, which is not on these charts.) Pennsylvania showed a similar pattern that was even more exaggerated.
Second, most states actually saw a red shift during this period. Setting aside the earliest vote reports (which I define as all reports before 10% of all ballots were reported), only 13 states saw Biden’s vote share grow during this time.
A broader view of the vote share shifts can be shown if we plot the two-party vote share for Biden against the percentage of all votes reported in a state. Those plots are shown in the next graph. (Click here if you want a bigger graph you can zoom in on.)
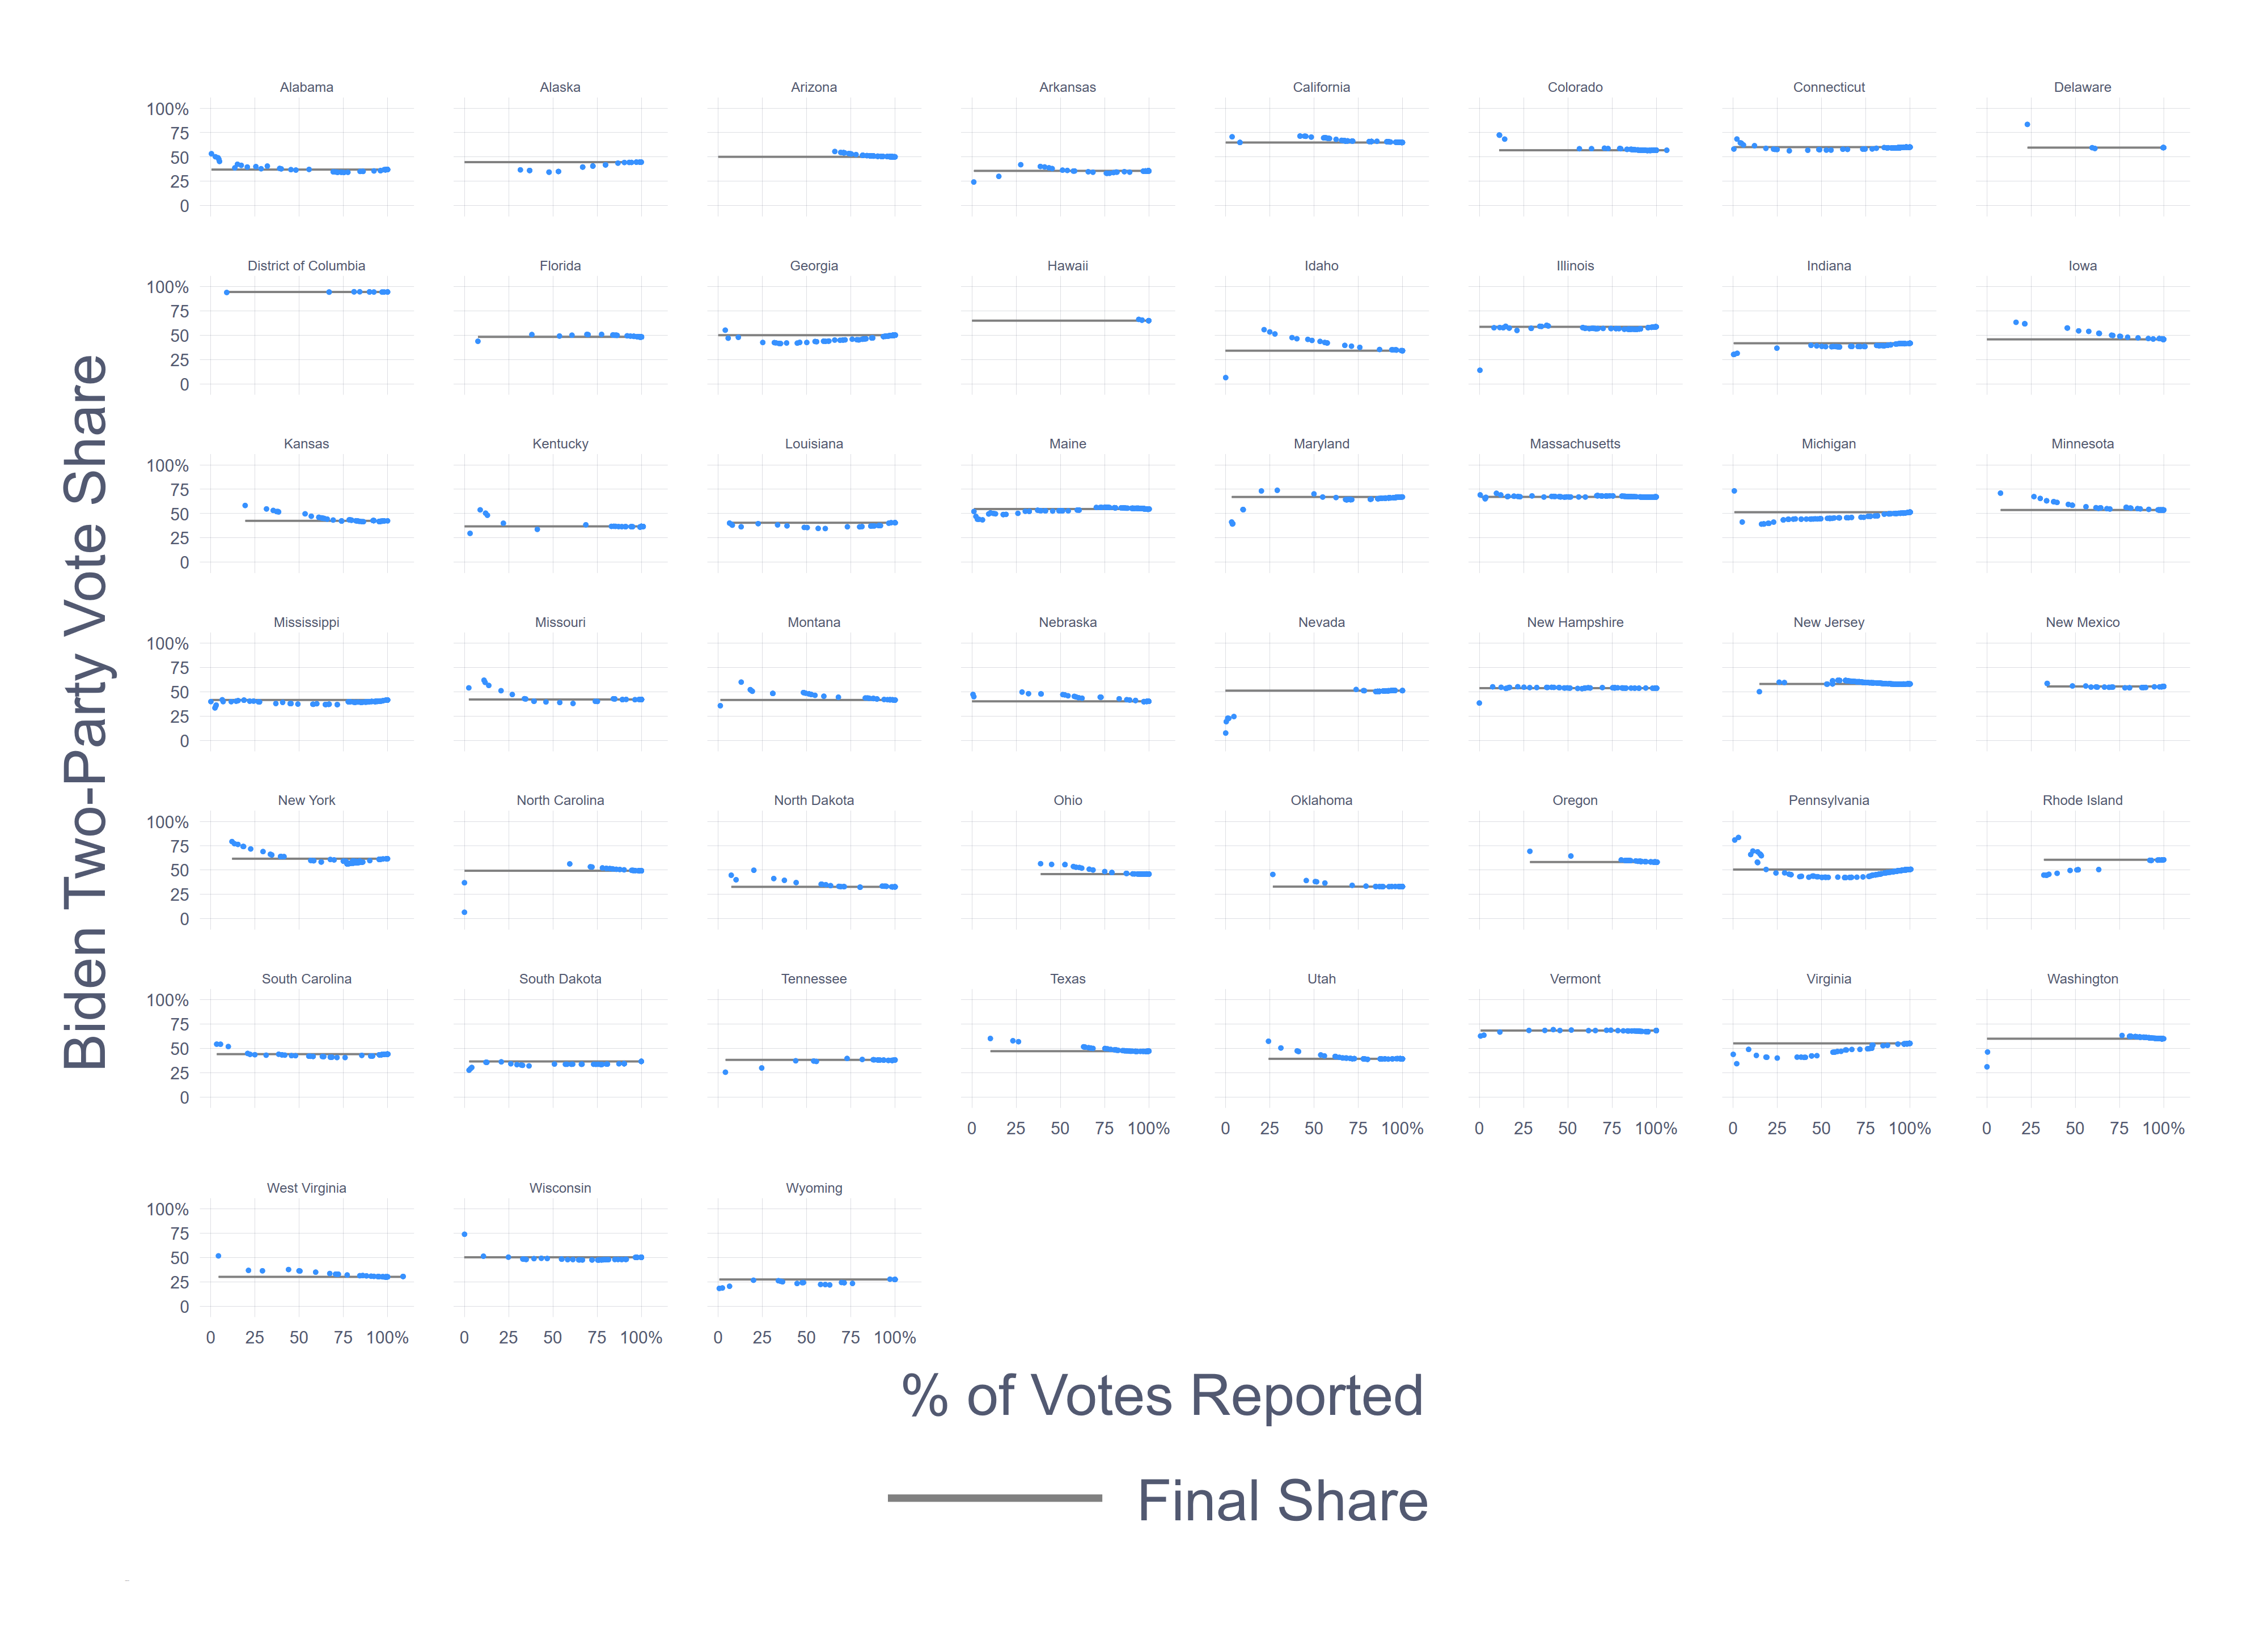
This graph perhaps provides a clearer view of the two patterns I discussed above when I confined myself to the first day and a half after the polls closed. Most states—31—saw Biden’s reported vote share start above his final vote in the state before dipping below his final share. Georgia and Pennsylvania again provide good examples of this.
These graphs help make the point that vote reports did not all follow the same path in 2020. They also show that the idea of the blue shift is more complicated than often understood. What most people are thinking of when they say that Georgia and Pennsylvania had blue shifts is what they experienced toward the end of the vote-counting period, when the nation was on tenterhooks about the outcome of the election. And what they fail to appreciate is that many states, in addition to Arizona, also had pronounced red shifts late into the count.
Some thoughts for 2024
These are the patterns from 2020. What do they tell us for 2024?
For most states, we can probably expect similar patterns. The patterns observed in the graphs above reflect the results of an interaction of state election laws, local practices, and unique urban/rural differences. Most of these things haven’t changed much in most states.
However, they have changed in some states. For instance, Georgia now requires its counties to report its early in-person and mail votes within an hour of polls closing. This could easily put 75% to 80% of all the state’s votes out at once, leaving little room for any movement afterward. It will also reduce, but not eliminate, the pattern of rural counties reporting first and urban counties coming in later. Similarly, Michigan’s allowing for pre-processing of mail ballots should dampen any blue or red shift and shorten the period over which it occurs.
Finally, reports of early in-person and mail voting suggest that Republicans are more active in turning out before Election Day than in 2020. In those states where the blue/red shift is caused by differentials in how the two parties’ supporters use different voting modes, differences in vote reports over time will be muted.