Author Archives: cstewart

First-person Report on Catalan Voting by Stephen Ansolabehere

Friend and colleague Steve Ansolabehere is spending some time in Barcelona, and sent the following dispatch describing the scene he saw yesterday during the Catalan voting on separating from Spain.  Picture to follow.

Greetings from Barcelona the morning after the election. I visited 5 polling stations and the press relations office of the Si organizers. I walked around the city and watched what was happening and how things were reported.

Wow.  Yesterday was amazing.  Here is what I observed.

The biggest disruptions of the Catalan election were not police seizures of ballots or violence but were hacks of the computer system.  The people who ran the election (largely volunteers, not the government) were extremely competent.  DNS attacks hit in the morning and took down the internet access to the voter registration database at the polling places.  To prevent the Spanish government from closing polling places the organizers set up a system that allowed voting anywhere.  Remote access to the voter registration system through the internet was critical.  It was a cat and mouse game but the election organizers finally prevailed.  IT won the day.

I saw no violence (except on TV).  I saw no police seizures of ballots or raids of polling stations.

But stepping back from the voting system, what impressed me most was how peaceful the voting was.  There were huge crowds at every polling place.  Some places had at least 1,000 persons.  Most people were in line but people stayed around the polling places after voting to form a human barrier against the Spanish police.

Who Should Vote? Secretary Dunlap Hits the Nail on the Head


One of the big stories to come out of Tuesday’s hearing of the Presidential Advisory Commission on Election Integrity (PACEI) is about the divisions that have begun to show among commissioners over how alarmed we should be about stories that people with out-of-state driver’s licenses vote, or what we should conclude from evidence that a very small fraction of voters in 2016 may have voted twice.

The story I am referring to was the comment made by one of the commissioners, Maine Secretary of State Matthew Dunlap, who was quoted as saying, “Maybe I’m being too cynical, but they [i.e., most of his fellow commissioners] are looking at voter fraud as being if legislatures are making it too easy for people who don’t own property in a town to register there.”

Secretary Dunlap is on to something.

Back in 2013, as I was reading through Alex Keyssar’s masterful The Right to Vote with a graduate student, we hit upon the idea of asking voters whether they thought a range of reforms that had been enacted by legislatures or imposed by courts had improved democracy.  So, in the 2013 Cooperative Congressional Election Study, we threw in the following question:

Lawmakers and courts often get involved in laws that decide who can vote, and the methods people can use to vote.  We would like to ask you questions about laws and court decisions that have been made over the years.  Some of these laws and court decisions have affected voting throughout the entire United States.  Some have affected only voters in a particular city or state.

Please give us your opinion about whether you believe these court decisions or laws have improved the quality of elections in the United States or diminished the quality of elections.

The court decisions and laws we asked about were these:

  • Giving 18-year-olds the right to vote.
  • Abolishing the requirement that people pay a poll tax in order to vote.
  • Giving women the right to vote.
  • Allowing non-citizens to vote in local elections.
  • Requiring all representative districts to have equal populations.
  • Requiring that people who have difficulty speaking English be given voting assistance in a language they feel more comfortable with.
  • Allowing people who do not own property to vote.
  • Prohibiting racial discrimination in voting.
  • Allowing students who are away at college to decide whether they vote back home, or where they are in school.
  • Allowing soldiers who are stationed away from home to decide whether they vote back home, or where they are stationed.
  • Limiting the residency requirement in order to vote to only a couple of weeks.

The graph below summarizes the answers to these questions.
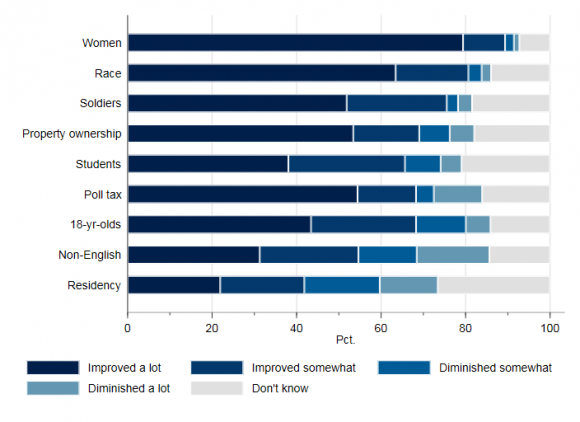
(I have left off the equal population item, because it’s not directly related to voting access, and the non-citizen voting item, because so few localities have actually allowed this.  Equal-population districts were not especially popular among the respondents, and non-citizen voting in local elections was very unpopular.)

Among these ballot-access reforms, the least popular was “limiting the residency requirement in order to vote to only a couple of weeks.”  A bare majority (53%) thought that eliminating property requirements had improved elections a lot; fewer thought that allowing students to decide whether they voted back home or where they were in school had improved elections.

Overall, respondents to the survey expressed majority support to some degree for all of these reforms, except for shortening the residency requirement.  Still, significant minorities thought some of these items had diminished the quality of elections, and non-trivial fractions couldn’t express an opinion about most of the items.

The overall pattern of responses does not reveal an anti-democratic impulse among the citizenry.  Rather, the overall pattern shows a diversity of opinions that Americans have about the expansion of voting rights over the past century.  Most are on board, but many have qualms.

Not surprisingly, there is a partisan dimension to these opinions, but the divide is not as great as it is on other hot-button issues in American politics.  Take the property ownership question, for instance.  The bar graph below shows how Democratic and Republican respondents answered this question.  While Democrats were more likely to say that removing property qualifications had improved elections “a lot,” and Republicans were more likely to say that removing property qualifications had diminished elections, the partisan differences were relatively small.
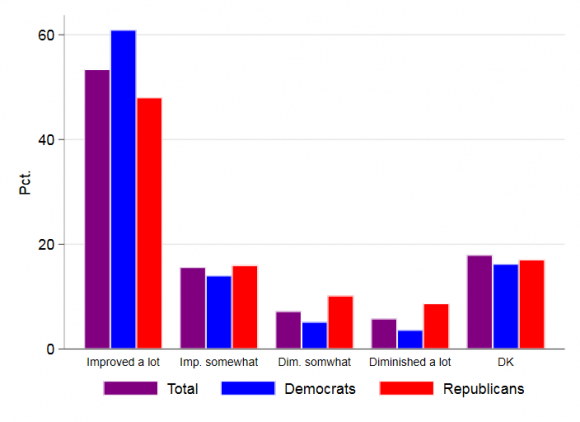
Bigger differences emerge when we drill down and examine partisans who have differing opinions about voter fraud.  Both parties had contingents who worry a lot about voter fraud and those who don’t, although the contingent of worriers was larger among Republicans.  In the same survey, we asked respondents to place themselves on a continuum, anchored by the phrases “I am worried about voting fraud” and  “I am  not worried about voting fraud.”  Among Republicans, 65% placed themselves on the “worried” end of the spectrum, compared to 29% of Democrats.

Among the worried Republicans, 25% believed removing property requirements diminished elections, compared to 7% of non-worried Republicans.  Among the worried Democrats, 7% believed eliminating property requirements diminished elections, compared to 8% of non-worried Democrats.

Similar analyses emerge when we look at the other items.  The greatest skepticism about ballot-access expansion is generally focused on “worried Republicans.”

To return to Secretary Dunlap’s point, the commentary he provides about his colleagues has application to the mass public.  Not everyone is comfortable with the expansion of ballot access over the past century.  People who are especially worried about fraud are especially uncomfortable.  Republicans are less comfortable than Democrats, but there are internal divisions, especially among Republicans.

Before I conclude, I must add the obvious caveat. The survey I have been discussing was done four years ago.  The partisan divide on these questions has no doubt expanded in the ensuring years, though other survey evidence I have seen suggests that the divide on election administration questions hasn’t expanded as much as some would think.  (If someone out there would like to pay for my repeating the survey now, I’d be happy to talk to you.)

The survey results I have been discussing allow us to appreciate even more the significance of the e-mail message released on Tuesday by the Campaign Law Center, written by Hans von Spakovsky, from before he was appointed to the PACEI, criticizing the possible appointment of a bipartisan commission that would include “mainstream Republican officials” and Democrats.  As that e-mail suggests, and the survey evidence bears out, there is some diversity of opinion among Republicans about the wisdom of franchise-expanding reforms and about whether voter fraud is something to worry about.  The e-mail is empirically incorrect in inferring that no Democrats worry about voter fraud and that Democrats are uniform in their opinions about franchise-expansion.

Many of my friends and colleagues have expressed alarm about the appointment and work of the PACEI.  One of the reasons I have not expressed the same degree of alarm, even when I have criticized the commission’s charge, is that the attitudes that appear to motivate the most influential members of the commission reside in a sizeable portion of the American public.  It is a fair question about  whether the diversity of attitudes on the commission reflect the diversity of attitudes in the American public.  Secretary Dunlap is right to raise the question.

Thoughts on voter confidence and election reform

The New Hampshire meeting of the Presidential Advisory Commission on Election Integrity (PACEI) focused on four substantive topics — turnout, voter confidence, fraud, and voting machine security.  Here are my thoughts on the voter confidence topic.

I start with voter confidence because this is how the entire work of the commission has been framed.  The executive order that created the commission contained the following three points that are to be reported back to the president:

  • those laws, rules, policies, activities, strategies, and practices that enhance the American people’s confidence in the integrity of the voting processes used in Federal elections;
  • those laws, rules, policies, activities, strategies, and practices that undermine the American people’s confidence in the integrity of the voting processes used in Federal elections; and
  • those vulnerabilities in voting systems and practices used for Federal elections that could lead to improper voter registrations and improper voting, including fraudulent voter registrations and fraudulent voting.

Voter confidence is something I’ve researched and published about.  I’ve explored the evolution of voter confidence from the 2000 presidential election to the present with my former student, Michael Sances.  I’ve written about the relationship (or lack thereof) between strict voter ID laws and voter confidence with my colleagues Stephen Ansolabehere and Nate Persily. Finally, for many years, I have asked questions on the Cooperative Congressional Election Study and the Survey of the Performance of American Elections (SPAE) about attitudes toward fraud and confidence.

Based on my own research, and the research of others in the field, (such as Lonna Atkeson, Mike Alvarez, Thad Hall, and Paul Gronke) here are what I think are the top-line findings about voter confidence and its correlates.

  • Voters don’t process information about election administration the same way that elites do.

Voter confidence ebbs and flows based on big, hard-to-miss things in the political environment, not on the fine points of election administration.

  • Survey responses to questions about voter confidence depend on what level of government, or level of generality, you ask about.

Voters are very pleased with their own experiences, and are confident that their own votes have been counted as cast.  They are less sanguine about vote-counting that happens elsewhere.  For instance, in the 2016 SPAE, 65% of respondents stated that they were very confident their own vote was counted as cast.  This compares to 54% who were similarly confident of the count in their own county, 44% in their state, and 28% nationwide.

  • Voters are the most confident when their candidate wins.

This is illustrated in the accompanying graph, which shows the percentage of respondents who reported being very confident their own votes were counted as cast.  (The data points connected by solid lines are from the SPAE; the points connected by dashed lines are averages from national polls before the SPAE was created.) The purple line is the national average; the red and blue lines.  This pattern has led me to quite many times, “if you want to increase voter confidence, make sure everyone’s favorite candidates win.”  Voters may have in fact heeded this advice, to the degree there appears to be residential sorting based on political beliefs.

  • When it comes to the experience at the polling place, voters are the most confident when their wait to vote is short and when they encounter competent poll workers.
  • When it comes to judging confidence in election administration at the state level, voters in battleground states are much less confident than voters in non-battleground states. (On this point, see my graphic of the week from June 6.)  While I don’t know of research about the mechanism at work here, it seems likely that it has something to do with the relentless litigation that surrounds campaigns in battleground states, and the trash-talking of the campaigns in these intensely competitive situations.
  • Strict voter ID laws don’t make voters more confident in elections. If anything, the politics in states surrounding the enactment of laws polarizes opinion around partisanship, with the net effect of reducing confidence.  While it may be true that there is a correlation between levels of confidence and the likelihood someone will vote, there is no evidence that low confidence can be overcome by election reforms such as voter ID (or vote-by-mail, or other reforms that have fervent adherents.)  Claims to the contrary are all speculation.
  • The use of electronic voting machines doesn’t depress voter confidence. The mass public is pretty immune to the critique of DREs for lacking paper backups.  In the 2016 CCES, voters in counties that used electronic voting machines gave higher ratings to DREs than they gave to paper ballots; the opposite is true for voters in counties with scanned paper ballots.  Voters are very conservative when it comes to voting machines.  There are good reasons to retire paperless DREs, but increasing voter confidence in the communities that use them is not one of them.


It is common for policy advocates and scholars who are policy specialists to make claims along the lines that adopting their favorite policy will increase the confidence of voters in elections.  Such talk is not only divorces from the empirical record, it also is divorced from sturdy theoretical models that ground our understanding of voter confidence and its big brother, political legitimacy.  Even before voters think about the rules of election administration, they have political attitudes about the proper relationship between citizens and the state, and they also have attitudes about whether government, in general, should be trusted.  The causal effect of any particular public policy — whether electoral or not — on public confidence will have an effect on existing levels of confidence that are rarely even measurable.


How does this discussion relate to today’s session?  Unfortunately, I was on the road for much of it, and therefore can’t comment based on watching much of the testimony.  I did watch John Lott’s testimony and part of the Q&A that followed.  I also read the prepared remarks of the others (here is a link to the pre-meeting materials).


My main impression is that there is a rhetorical drum beat that presumes voters as a whole are discouraged from voting because of the lack of voter ID laws. There are many serious arguments in favor of and in opposition to strict(er) voter ID laws, but using these laws to increase voter confidence (or turnout) is not one of them.


An important question that remains is whether this rhetorical drum beat itself will affect voter confidence.  Some of my friends have worried that the media attention given to over-hyped charges of voter fraud will depress voter confidence, and thus discourage voters.  (However, keep in mind my skepticism about the causal link between voter confidence and turnout expressed above.)


In my mind, another outcome is more likely, at least as far as public opinion is concerned.  Rather than depress voter confidence, the nature of the rhetoric surrounding issues like fraud, voter ID, and national registries of voters will press it into a partisan frame.  With prominent Republicans and others on the right repeating how fraud-ridden the election administration system is and Democrats fighting back, it’s likely that the confidence of Republicans in the mass public will fall while the confidence of Democrats will rise.  Thus, for now, I’m placing my bets with the view that the work of the PACEI will mostly serve to polarize the electorate, rather than boost its confidence.


Encouraging researcher access to American polling places

I spent yesterday at the annual workshop on election integrity, hosted by Pippa Norris’s Electoral Integrity Project. It was an interesting day.  This year, the theme was about the 2016 U.S. election in comparative perspective. Leaving aside the obvious cracks about people who study only the United States being achingly narrow, we who study how Americans conduct elections can learn a lot from those who study how elections are conducted in other countries.

One of the most useful presentations at the workshop was by Nandi Vanka of the Carter Center, who discussed a report on the observability of elections in the 50 states.  You can download that report here.  The report provides useful context to the helpful NCSL web page on policies for election observers.  (The Carter Center team that wrote the report also provided the underlying research for the NCSL page.)

I took away two major thoughts after hearing the presentation and reading the report.  The first is that the United States lags far behind in upholding its international obligations to make its elections available to international observers.  My own experience is that state and local officials have nothing to fear from teams of professional, well-trained international observers taking a look at all aspects of the election process.  The elections profession in the U.S. can learn when election professionals from other countries comment on our procedures.  It’s just the right thing to do.

The second important point is that we (by which I mean, academics) need to do a better job working with election administrators to pave the way for academic researchers to have access to polling places.  Lonna Atkeson’s work in New Mexico demonstrates that both original academic research and improved electoral practices can emerge when the right conditions are set for researchers to be in polling places.  New Mexico is the rare — and perhaps only — state that lists academic researchers as one category of individuals allowed in polling places to watch the process.

We can’t wave any magic wands to transfer the New Mexico experience to the rest of the 50 states, but the following steps could probably help facilitate greater access to polling places by academics.

First, academics interested in doing fieldwork in polling places should develop personal connections to a few local election administrators, who can serve as mentors and (later) as recommenders.

Second, having established a personal connection, arrange to just sit in a few polling places on Election Day to watch and take notes — but not to write up anything for public consumption.  Best to know the lay of the land before jumping into publishable research.  Also, once you have observed a polling place on your own, you will have a better idea about how to deploy researchers into polling places without them getting in the way of the voting.

Third, in arranging access to polling places to do research, academics should have both a clear sense of what the research will accomplish, including an idea about how the research can benefit the administrator.  If nothing else, offer to share findings with administrators as a part of the write-up.  (This is not much different from our typical offer to share reports of our research with people who fill out our questionnaires.)

We may also want to think about ways to accredit academic researchers.  Election officials should be assured that when academic researchers go into polling places, they know how to act professionally, work unobtrusively, and follow the laws that constrain what goes on in a polling place.


Election Science Panels at APSA

I’m jetting off to the annual meeting of the American Political Science Association, which this year is in San Francisco.  For the non-political scientists who read this blog, the APSA meeting is the biggest convention of political scientists, with over 7,000 in attendance.  Naturally, there will be a number of panels of interest to those who follow the field of election science.  For the aid of those who will be attending, below I list the panels (and a few poster sessions) that have papers likely to be of interest to the field.  I likely missed some, and would welcome hearing about additional ones I might add.

The links go to the panel descriptions.  I’ve been warned that the links don’t always work, so caveat emptor.

In addition, Pippa Norris and her crew will be holding their annual pre-APSA election integrity workshop, where Barry Burden will be presenting a paper he and I co-authored with some great coauthors, about the Wisconsin recount. Take a look at the workshop website here.

Below are the election science panels I’ve identified for the main APSA conference.  Enjoy!

Title Day Time Hotel Room
Election Timing: Causes and Consequences Thu 10:00 Hilton Union Square Franciscan B
Who Votes? Thu 12:00 Hotel Nikko Bay View Room
Electoral Accountability, Integrity, & Security Thu 16:00 Hilton Union Square Golden Gate 7
Experiments on Voter Participation and Partisanship in Southern and East Africa Thu 16:00 Westin St. Francis Essex
Big Data and Machine Learning Thu 16:00 Parc 55 Divisadero
Voting and Turnout in the 50 States Fri 8:00 Parc 55 Fillmore
Racial and Partisan Gerrymandering: New Approaches for the Next Decade? Fri 8:00 Westin St. Francis Yorkshire
Experimental Replication Studies Fri 8:00 Parc 55 Embarcadero
Field Experimental Studies of Registration, Turnout, and Vote Choice Fri 10:00 Hilton Union Square Nob Hill 8 & 9
Democracy’s Legitimacy at Risk: Critical Perspectives from Mexico Fri 10:00 Hilton Union Square Franciscan A
Breaking News Panel: The Legitimacy of Elections: Russia, Fraud, and Public Confidence in the Electoral Process Fri 10:00 Hilton Union Square Continental Ballroom 6
Representation and Electoral Systems (Poster session) Fri 11:30 Hilton Union Square Grand Ballroom
Featured Papers in Information Technology and Politics Fri 12:00 Hilton Union Square Union Square 14
How Do Parties Respond to Electoral Rules? Fri 12:00 Westin St. Francis Elizabethan B
Elections, Public Opinion, and Voting Behavior (Poster session) Fri 13:00 Hilton Union Square Grand Ballroom
Voting, Representation, and Legitimacy in the American States Fri 14:00 Hilton Union Square Union Square 25
Democracy in Africa: New Opportunities, New Challenges Sat 8:00 Westin St. Francis Essex
Electoral Malpractice in East and Southeast Asia Mini-Conference (Mini-conference) Sat 8:00 Westin St. Francis California West
Modifications to State & Local Electoral Rules Sat 10:00 Hilton Union Square Union Square 17 & 18
Election Law and Voter Participation Sat 10:00 Hilton Union Square Franciscan D
Report of the Campaign Finance Research Task Force (Roundtable) Sat 10:00 Westin St. Francis Elizabethan C
Electoral Legitimacy and Representation Sat 12:00 Hilton Union Square Nob Hill 10
Making Democracy Work: Comparative Democratization in Brazil and South Africa Sat 14:00 Hotel Nikko Carmel II
Electoral Systems and Voting Rules Sat 14:00 Hilton Union Square Union Square 17 & 18
Research Methodologies Using Twitter and Facebook Sat 16:00 Parc 55 Fillmore
Public Opinion and Law Enforcement Sat 16:00 Hilton Union Square Plaza A
The Effects of Electoral System Rules Sun 8:00 Hilton Union Square Golden Gate 5

First Thoughts about the Pence Commission Voting List Request

I’ve had a chance now to read the letter that vice-chair Kris Kobach has sent to the states, requesting that they send the Pence Commission copies of their publicly available voter files.  My initial reactions fall into two buckets, the small and the expansive.

I want to make clear that there is no intrinsic problem with matching voting lists against other lists and reporting the results. In fact, valuable insights can emerge from linking voter records. I don’t know a better way to advance knowledge and practice than to conduct research, report the results, and then hash out what they mean.

But here’s the caveat.  As a social scientist who has conducted voter roll matching both for scientific research and for litigation, I know how hard it is to do this right.  For example, the well-known “birthday problem” makes it likely that two different people will be mistakenly matched to one another. Few people have the expertise to handle these complexities correctly.  Just as litigation is rarely the best vehicle to advance the science of a field, I worry about developing matching routines on the fly in the context of a commission that is controversial.

Now on to the letter.

I am well aware that many people view with skepticism the appointment of the Pence Commission.  I have nothing to add to the partisan fight over the commission’s appointment and work.  Instead, my reaction is from the perspective of someone who believes that careful empirical research is the best path to improving elections in America.

Two small-bore details jumped out at me when I read the letter.

First, the letters were apparently addressed to all the Secretaries of State, even though the chief election officer (CEO) is not always the Secretary.  (Here’s the link to the list of CEOs in each state.) Certainly support staff in SOS offices know how to forward e-mail, but small misfires such as this suggest a lack of care in the process of making the request for the voter files.

Second, the letters ask for the “publicly-available voter roll data,” including “dates of birth, political party …, last four digits of social security number if available…”  The terms “publicly-available” and “social security number” don’t belong together in the same sentence.  Furthermore, if the goal is to use these lists to do matching with other lists, there is no reason to specify political party.

Again, small details are telling.

But the request raises much bigger issues.  The letter reflects a naive understanding of how to go about voter list matching.  The letter isn’t a whole lot different from the requests I’ve seen or heard about over the years from graduate students and researchers just getting into the field.  The letter seems to suggest that each state’s data set is just sitting in a computer waiting to be dragged from a folder onto a thumb drive, or, in this case, uploaded to an FTP site.  Piece of cake.

Not so — and in so many ways.  Here are just a few

  1. Many states don’t allow the sharing of voter files with anyone other than candidates or in-state political parties. (Michael McDonald has a nice summary of some of these issues as of 2015 here.  Paul Gronke wrote about this in Pew’s Data for Democracy in 2008.)  I suspect that all sorts of groups are preparing their lawsuits right now seeking to enjoin states with such restrictions from sharing these files with the Commission.  If a state with such a law ends up providing the list anyway, the lawsuits will now come back to the states asking why other groups can’t get access to these lists, contrary to law.
  2. Some states charge lots of money for these lists.  In 2015, McDonald estimated it would cost over $120,000 to pay the fees to acquire these lists, if it were allowed.  Will the Commission pay?  If a state with high fees provides the list for free, how soon will the lawsuit be coming to demand that all requests for the voter files be granted gratis?
  3. In many cases, the voter files are not available as a single file in a single place. Who on the Commission’s staff is going to call each of the 351 city and town clerks in Massachusetts, asking them each for a copy of their municipality’s voter list?
  4. The voter files are not in standard formats.  Each of the 51 files, if they were all assembled, will need to be cleaned and prepared, and most of them will take hours, if not days, to prepare for analysis.
  5. Matching between the data sets — including matching with non-voter lists such as immigration lists — is hard.  It will be especially  hard to match with immigration lists because I suspect that few states will share actual dates of birth and none will share the last four digits of the social security number.  This will be on top of the difficulties that arise because of typos and inconsistent data entry standards.  Therefore, any matches that are done will be suspect from the start.  This is already the case when states — which are in full control of their voter lists — do their own cross-list matching.  You want to match on the actual non-public voter files, and they will not be made available to the Commission.
  6. Federalism and state control.  In my seventeen years of working in this field, I have heard one refrain more than any other, particularly from Secretaries of State:  No National Voter File. One of the early obstacles in creating the Electronic Registration Information Center (ERIC) was the worry that it would create a national file. ERIC has been designed to make that impossible.  How does the request that each state deposit its voter file on a military server relate to existing opposition on many fronts to creating a single national voter file?
  7. Privacy.  Researchers working in this area are well aware that the information contained in voter files is highly sensitive.  State laws and practices already reflect this sensitivity.  So does federal law.  There is no information in the letter about the privacy parameters associated with sharing the voter file.  Indeed, there is the troubling sentence that says, “Please be aware that any documents that are submitted to the full Commission will also be made available to the public.”  Does this apply to the voter files?  Does this apply to the results of matching procedures?

For each of the many  Voting Rights Act cases that have involved database matching, the cost to conduct those analyses has run well into the six figures.  And those were relatively simple, because the data were better and the number of databases being matched was much smaller. The protocols were also carefully designed, because they were developed under the watchful eye of a court.  If the Commission intends to conduct a comprehensive matching exercise, this will be a multi-million dollar, multi-month operation.  Because the Commission has the full support of the White House, I am sure the resources will be brought together to conduct whatever matching the Commission wants conducted, but is this the best use of these resources for this goal?

I have alternative thoughts about how the resources could be better spent, but the details will have to wait until another day.  To repeat what I said at the top of this post, I do think that voter list matching is important and valuable.  It should be conducted by the states on a regular basis, with the results being made public, warts and all.  As I wrote about last week, Virginia already provides a good example of a state doing intensive work, and I know they would like to do even more.  (And, here is a link to the type of report Virginia regularly releases.  Warning:  it’s 10,673 pages long.)

But, for states to do this, we need to bring together all the stakeholders to help create the protocols that allow for accurate matching.  My own grand plan is something like this:

  1. Every state should join ERIC, which has been shown to be very helpful in dealing with the most basic and common “list hygiene” problems.
  2. A group of state and local officials, academics, and federal government officials should get together and design agreed-upon protocols (which would combine automated and manual processes) for the auditing of state voter files by comparison with other state’s voter files, other state records, and federal government records.  Part of this agreement should include a plan to grant states direct matching access to federal data sets that are currently off limits to bulk matching.  This auditing standard should also account for other problems with voter files, such as typos.
  3. States themselves would then regularly conduct list audits using the protocols identified in the previous step and make the results of those audits public.

The existence of the Pence Commission is controversial already, and the day has now come that one of its most controversial activities has begun.  My intention here is to sidestep the political controversy and suggest two other things have been under-appreciated.  First, the Commission’s eyes may be bigger than its stomach.  Acquiring voter files from every state and matching them — among themselves and with other databases — will be a quagmire.  Second, public auditing of voter files based on database matching (and other procedures) is something that should be done more often and more publicly.  Because we have entrusted states to manage the voter files — for better or worse — a state-directed initiative would seem a better strategy than a controversial, high-visibility activity of a temporary federal commission.

Graphic of the week # 3

This weeks’ graphic was inspired by last week’s special elections for vacant U.S. House seats.  Most of the attention was paid to the Georgia 6th, so let’s look at the South Carolina 5th.

One of the things that always interests me is whether surprising results of elections are due to voters changing their behavior (compared to prior elections), or because the composition of the electorate changed.  This is, of course, a question that can only be answered definitively with individual-level data — and only if we know, for sure, how the same people voted in the past and in the present.  Absent the individual data, we only have aggregate data.

We start with the fact that there appeared to be a pretty uniform swing at the precinct level, from the November general election (measured by the Trump vote) to the special election amounting to 5 percentage points.

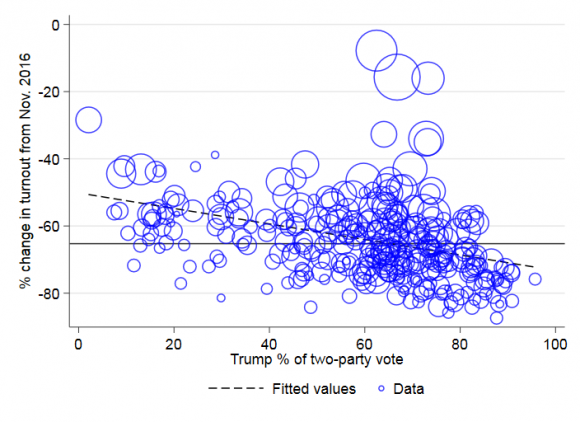
While we cannot know whether some Trump voters came over to support the Democrat, Archie Parnell, it does appear that Parnell was helped (and thus the Republican Ralph Norman was hurt) by a shift in turnout.  This is illustrated in the following graph, which plots the percentage change in turnout at the precinct level (comparing the special election to the general) against the two-party fraction of the vote received by Trump.  The dashed line is the best-fit line based on a weighted linear regression.  The solid horizontal line shows the average change in the turnout rate across the whole district. On the whole, there’s a pretty healthy negative relationship between Trump’s support at the precinct level and change in turnout.  In other words, turnout in the special election tended to slump the most the in precincts that gave Trump his biggest margins in the district.

By how much did this turnout differential affect the election outcome?  A simple back-of-the-envelope calculation can be done to answer this question.  If we take the percentage of the vote received by Norman in each precinct and re-weight each precinct’s contribution to the district vote total by November 2016 turnout, then Norman gets 54% of the two-party vote, rather than 52% — a small, but still significant difference.

One final detail about the graph.  There are obviously three outlier precincts in the graph — two precincts from Lancaster County (identified as Lake House and The Lodge in the election returns) and one from York County (Laurel Creek).  If anyone has information about why turnout in these three precincts held firm in comparison with last November, I would love to hear it.

Learning from Virginia about Voter List Maintenance

The Commonwealth of Virginia has been on my mind recently as I have been thinking about voter registration list maintenance. (I know, I have a troubled mind.) Virginia has a very thorough and well-documented “list hygiene” program — which results in an annual report that anyone interested in the topic should read. (Here’s a link to the past four reports.)

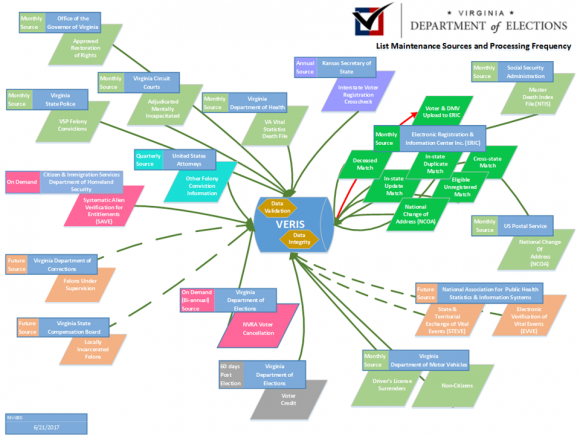
Edgargo Cortes, who is the Commissioner of the Virginia Department of Elections, graciously invited me to share the podium with him today, as he led a training session on list maintenance at the annual Virginia Elections Conference.  Edgardo’s remarks were centered around explaining the following chart, which illustrates the various data sets that come together on the regular basis — ranging from yearly to monthly — as his team tries to ensure that eligible voters, and only eligible voters, are on the Commonwealth’s voting rolls. (Click on the graphic for a slightly larger view.)

Here are some thoughts that initially occurred to me as I listened to Edgardo talk, and as I’ve spent the day talking with him and his staff:

  1. The amount of external data brought in to match against the voter file is stunning. To suggest that a state like Virginia isn’t putting a lot of effort into trying to keep the list current is just nuts.
  2. ERIC (the Election Registration Information Center) has been indispensable for improving the ability of Virginia to find voters who have moved away, and to make sure their voter registration is held in only one place.  Indeed there is evidence (some of which I presented in my remarks) that Virginia has been able to use ERIC to catch up from prior years when a lot of these (former) voters would have remained on the list as deadwood for years.
  3. Database matching is harder than you think.  When I got into this business, there was a common assumption that voter registration lists were the orphan child of government agency record keeping, and that larger agencies (especially DMVs) had crisp and clean lists.  Not true.  Turns out that most government agencies that interact with citizens really don’t need to know precisely where they live.  As a consequence, some data sources are less helpful than you’d think, and in almost all cases, data records don’t easily match-up.
  4. Citizenship matching is a quagmire.  The DHS SAVE (Systematic Alien Verification for Entitlements Program) database has been touted as the savior for keeping non-citizens off of voter rolls, but it turns out that if you have the information you need to search for someone on the SAVE service, you already know they are unlikely to be a citizen.  Furthermore, resident aliens transition so regularly into citizenship status that voters tagged as non-citizens almost always end up being citizens after all — a fact discovered only after painstaking auditing of citizenship information.  The quality of the data on citizenship seems ready-made for an endless stream of false-positive matches.

Virginia is a state that takes the accuracy of its voting rolls very seriously.  Check out their reports — or at least study the chart.

Graphic of the week # 2: Preparing for GA06

As I get ready to analyze the results of the upcoming runoff in GA06, I asked my research associate, Jacob Coblentz, to produce a graph to summarize how the precinct returns from the April primary compared to the November presidential returns.  Below is the result.


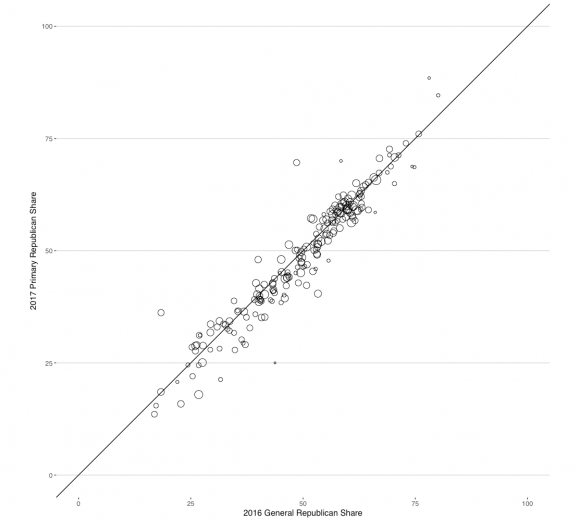
The y-axis is the percentage of the two-party vote received by all the Republican candidates in the primary and the x-axis is the percentage of the two-party vote received by Trump.  The solid line is the 45-degree line.

In the 2016 general election, 50.3% of the two-party vote in the district went to Trump.  In the primary, 50.9% of the two-party vote went to one of the Republican candidates.  To play Captain Obvious here, no wonder this is a nail-biter, and no wonder an Ossoff victory would be quite an accomplishment.  A deeper dive into the data shows that primary turnout sagged more in the precincts that showed the strongest support for Clinton in November, compared to the sag in precincts that supported Trump the most.  Thus, it’s also no surprise that this has become a contest of turnout.


Local Election Official Survey in the Field

With the help of Sentis Research, I have placed into the field a survey of local election officials to follow-up on a very similar survey that I helped produce in 2013, in order to help the Presidential Commission on Election Administration understand the challenges facing local jurisdictions.

You can review the testimony my colleagues and I provided to the PCEA about the 2013 survey at meetings on September 20, 2013 and  December 3, 2013.

The specific purpose of the current survey is to see how things have changed at the local level for two very important issues in the PCEA report: wait times at the polls and the purchase of voting technology.  Public opinion research of voters suggests that wait times diminished substantially in 2016, compared to 2012, and the local election official survey will help to provide context to why wait times dropped.  The PCEA report also identified the problem of aging voting technology as a “looming technology crisis.”  The LEO survey will help us to gauge how much it remains a looming problem.

With concerns over email phishing attacks, some local officials have contacted me to see if the invitation to participate in the survey is legitimate.  I don’t blame them.  If any election official is concerned about the authenticity of the e-mail they received about this survey, here are some things to look for in the message:

  • You will notice that my contact information is located on the e-mail solicitation.
  • The invitation will be sent to you from the following e-mail address:  MIT@sentis.ca.  It will include “Election Administration Survey” in the subject line.
  • The invitation will include a link that will take you to an online survey hosted at https://mit-survey.sentis.ca. (Each link is customized for every individual who was invited to participate, so don’t visit the simple link given in the previous sentence.)

One final thing:  answers to the survey will be held in confidence.  We will not be releasing or saving any information about individual respondents.   We will only be releasing an aggregate report about the responses.

I appreciate the responses we have received thus far.  This is an important opportunity for local officials to report on how things have gone in the four years since 2012, and to help us gauge the challenges and successes experienced by local election jurisdictions in 2016.