Today’s New York Times article on the effect of HB 1355 on the activity of third party voter registration groups misses the most important voter registration story in Florida.
The more important story is the fact that voter registration from all sources has crashed, from the heights leading up to the elections of 2000 and 2004. Maybe HB 1355 is seriously restricting the ability of third party groups to register voters. But, why not an article about why the number of voter registrations in Florida over the 2005-08 cycle fell 54% compared to the 01-04 cycle, or 36% compared to the 97-00 cycle?
Here are the basic patterns, gleaned from a great set of reports on the Florida Elections Division web site.
First, I simply took the monthly totals in these reports and plotted the totals against month in the four-year cycle between presidential elections. Here is that picture.
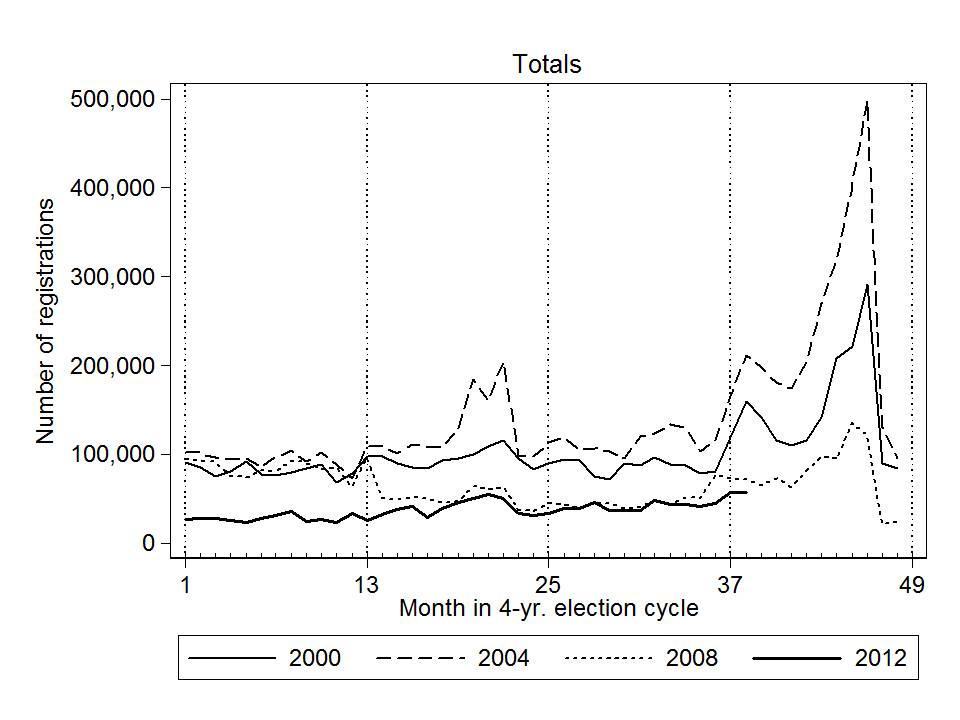
A little explanation: I have broken down the data into four periods, each corresponding to the four-year period proceeding the elections of 2000, 2004, 2008, and 2012. The thin solid line shows the number of new voter registrations filed in Florida for the four years leading up to the 2000 presidential election — 1997, 1998, 1999, and 2000. The dashed line traces out the same numbers for the period leading up to the 2004 election; the dotted line pertains to the period before the 2008 election; and the dark solid line traces out the number of registrations each month leading up to the 2012 general election. With the exception of the time series associated with 2012, there are 48 data points represented for each election. For 2012, the most recent report is for February 2012, so the line ends there.
Two things stand out in this figure. (Click on it for a larger version that is easier to read.) The first is that in 2000, 2004, and 2008, there was a big peak toward the end of the year, right before the general election. (There were smaller peaks early in 2000 and 2004, corresponding with the presidential preference primaries, but not in 2008, or apparently, in 2012.) The second thing that stands out is how the time series for 2000 and 2004 are at much higher levels than the two time series for 2008 and 2012. Indeed, close inspection reveals where the world changed — February 2006, where the dotted line takes a sharp dive downward, never to join the time series for 2000 and 2004 again.
Thus, the first thing that needs to be said is that, compared to 2000 and 2004, voter registration levels are at surprisingly low levels in Florida. What happened? I wish the New York Times would write about that. Unfortunately, there’s not a high-profile law to blame, so the explanation is going to take some work.
One of the reasons the top-line numbers in Florida are so interesting is that when we dive deeply into the sources of registration, the fall-off in registration numbers appear everywhere. Here are graphs that show the number of registrations, according to the source of the registration. For the period covered by the Election Division reports, the most common source of voter registration is through the Department of Highway Safety and Motor Vehicles (DHSMV). Here is the graph of registrations received at this source, by month:
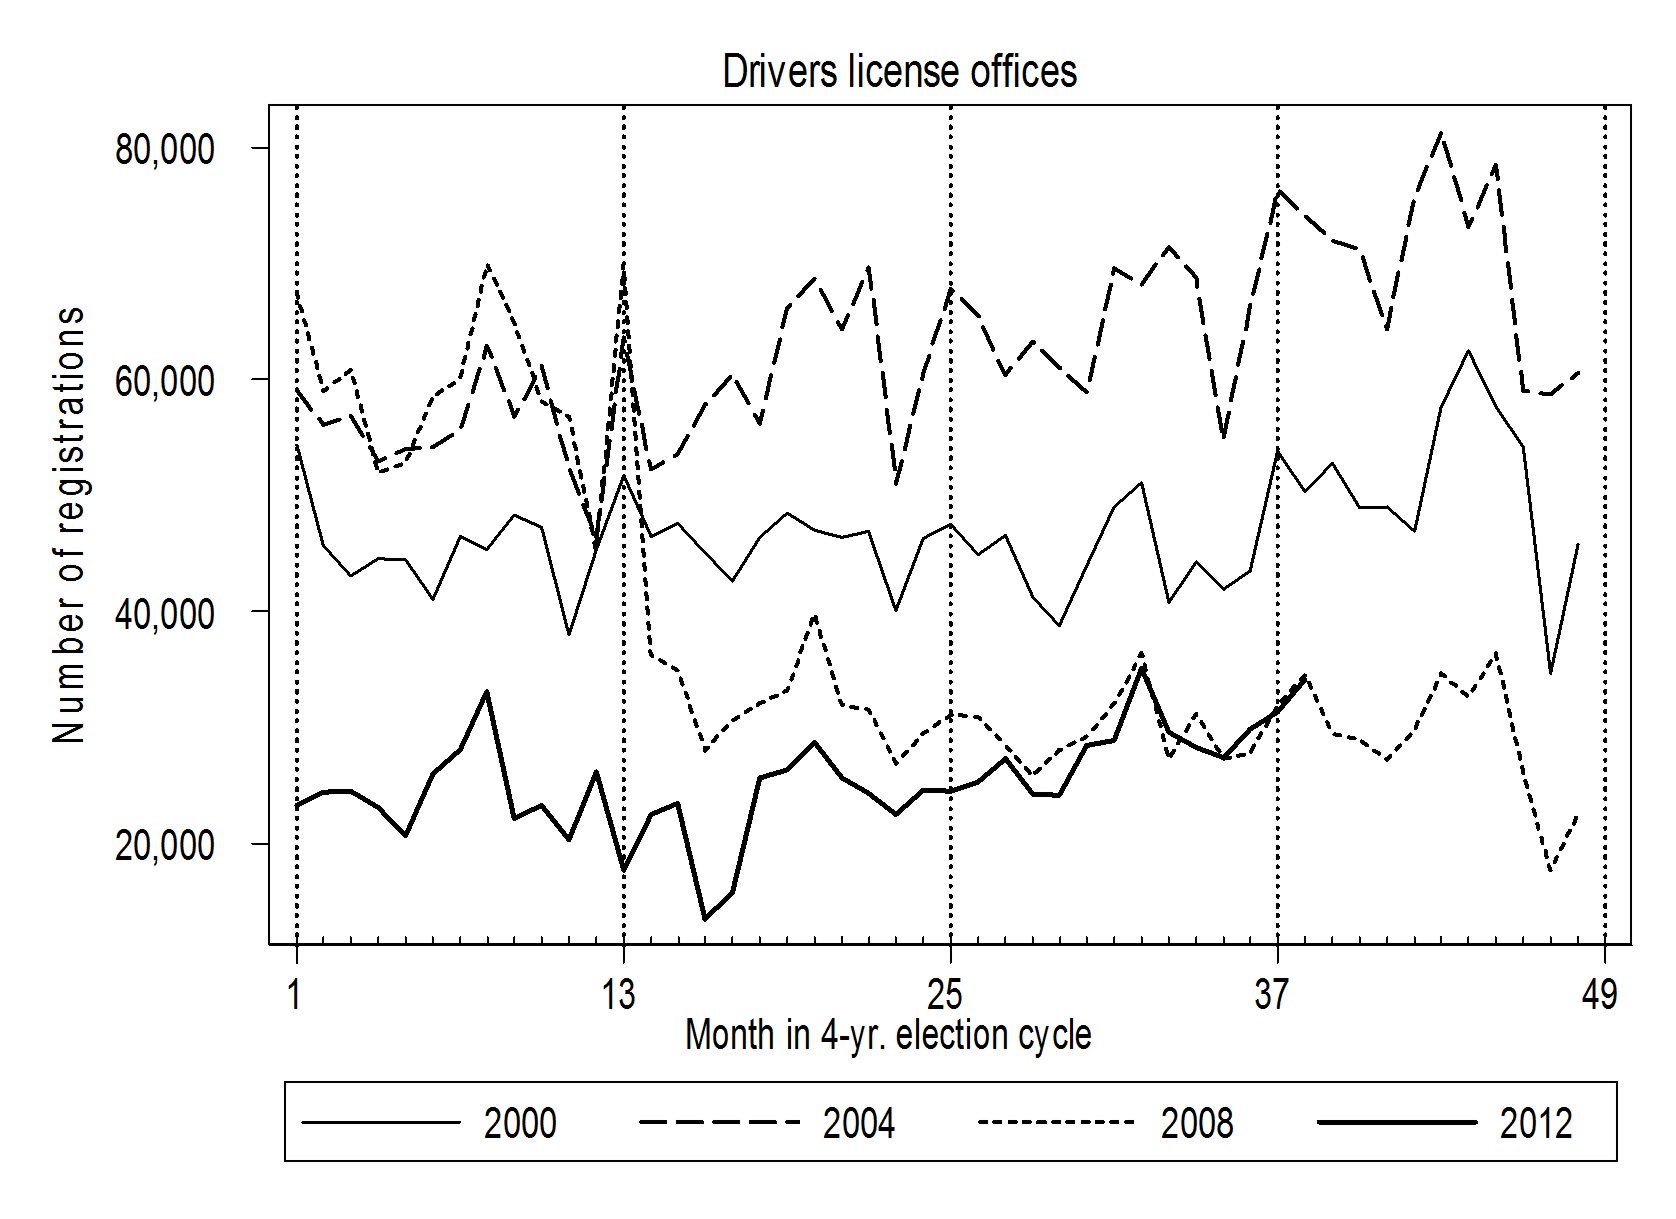 Compared to the other sources of voter registration in Florida, the DHSMV is fairly steady. That said, the early-2006 crash seen in the overall totals is evident in this graph. This is perhaps related to the roll-out of the new Florida Voter Registration System. I would like to hear from anyone who knows the full story.
Looking at the dark solid line, which indicates the current trend in this time series, we see that the number of new voter registrations originating in drivers license offices was historically low after the election of 2008. It continued at about half the rate of four years before for all of 2009, and significantly underperformed the last midterm election year in 2010. Last year, however, the number of voter registrations coming from the DHSMV has tracked closely the number originating there four years before.
The number-two source of voter registrations in Florida for the past decade has been the mail route. The following chart shows the number of voter registration forms received by mail each month in Florida over the past four presidential election cycles:
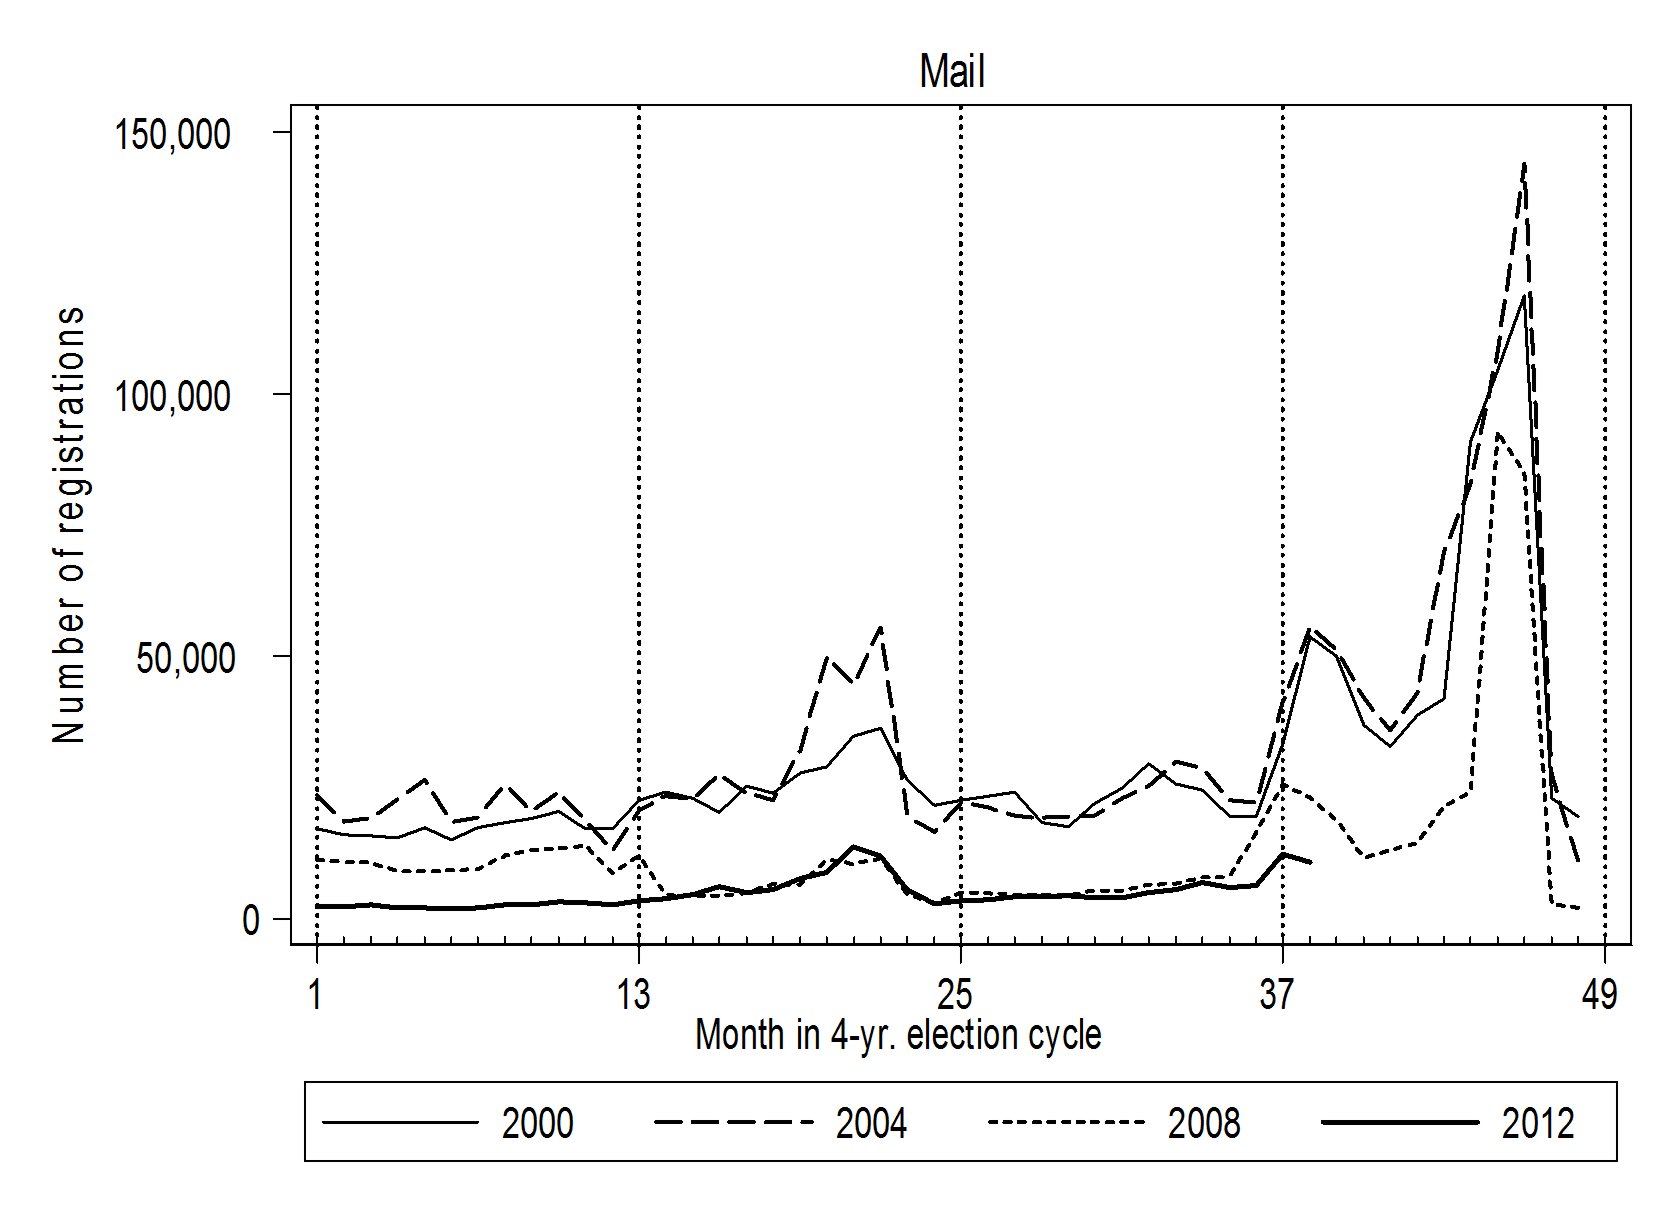
The pattern of the registration number is highly seasonal, with large spikes around each of the general elections, along with the presidential preference primaries. Again, we see a steep decline in the number of so-called “post card” registrations in early 2006, which parallels the steep decline in overall registrations and in registrations processed through drivers license offices. The number of registration forms that were mailed in was highly depressed in 2009, compared to 2005, and then kept pace in 2010 (compared to 2006). The pattern of registrations received via the mails in the current cycle diverged significantly from the pattern four years ago in December of last year. Whether this is an indirect indicator of a depression of third-party voter registration is unknown. What is clear is that the total number of registration forms received by mail for the current presidential cycle is about half of what it was for the comparable period leading up to the 2008 election, and only about one-fifth what it was in 2000 and 2004.
The number-three source of voter registrations in Florida for the past decade has been the “other” category, which lumps together two substantively important source of voter registrations: registrations generated by third-party voter registration drives, and registration forms filled out at the office of the county Supervisor of Elections. The following graph shows how these numbers have fluctuated over the past four presidential election cycles:
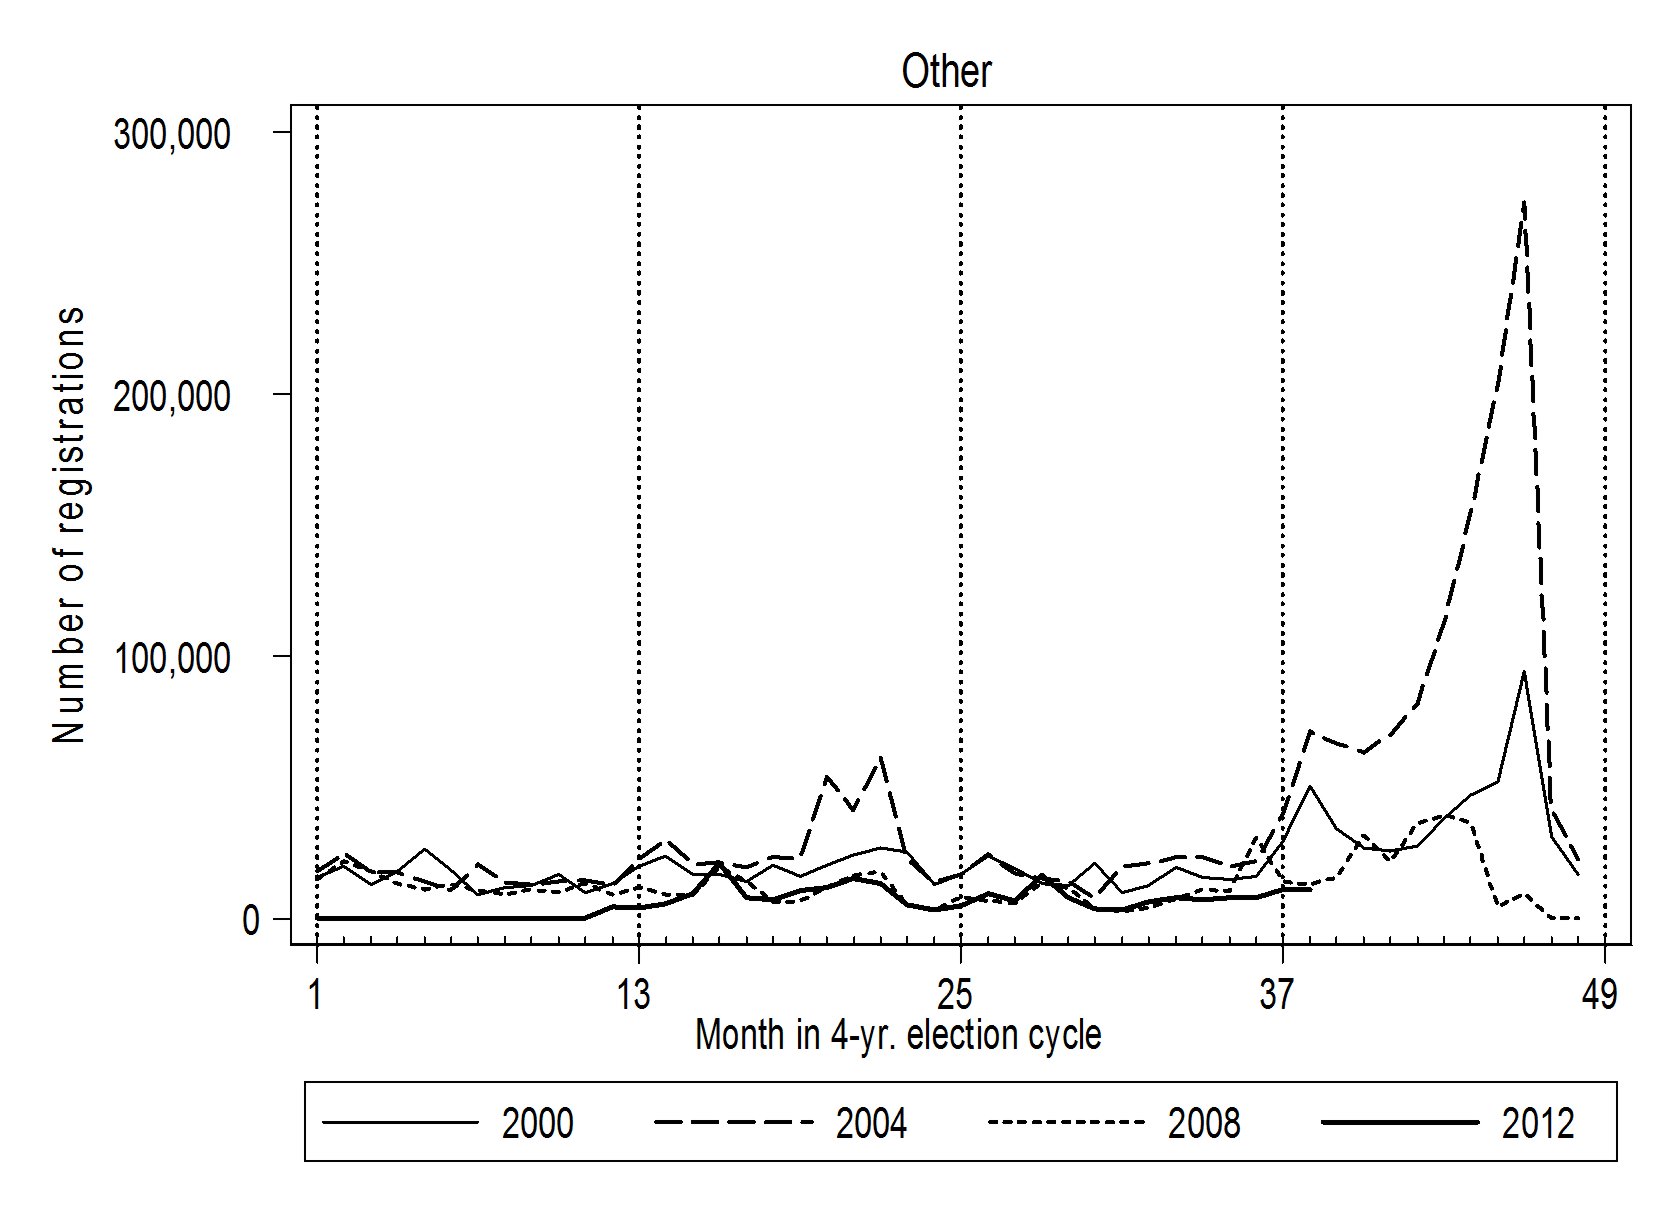
Unlike registrations coming from the drivers license bureau, registrations coming from “other” sources are very much a seasonable phenomenon. By far, the biggest spike in the data occurred in the fall of 2004, when over a quarter million registration forms from these sources were received in September and October, with another 240,000 in August. No other months in the whole time series even come close to these.
In the current presidential cycle, the number of registrations coming in through this channel is dramatically below recent history — a pattern that emerged well before the passage of HB 1355. Indeed, the number was effectively zero in 2009. In 2010 and 2011, it rose to numbers comparable to four years before. Since the passage of HB 1355, the number of registrations attributed to this category has run behind the benchmark rates of four years ago. However, it should be noted that beginning with January 2012, the state has begun accounting for the number of third party registrations separately from the number of registration forms turned filled out at the county election office. Those reports suggest that the third party registration figures are only about 10% of the “other” category. Of course, if the gist of the New York Times article is correct, these numbers are depressed below what they could have been, had HB 1355 not passed. Still, past patterns indicate that the number of registration forms originating from this part of the system is likely to be small until mid-year. Stay tuned, as more reports roll out in the coming months.
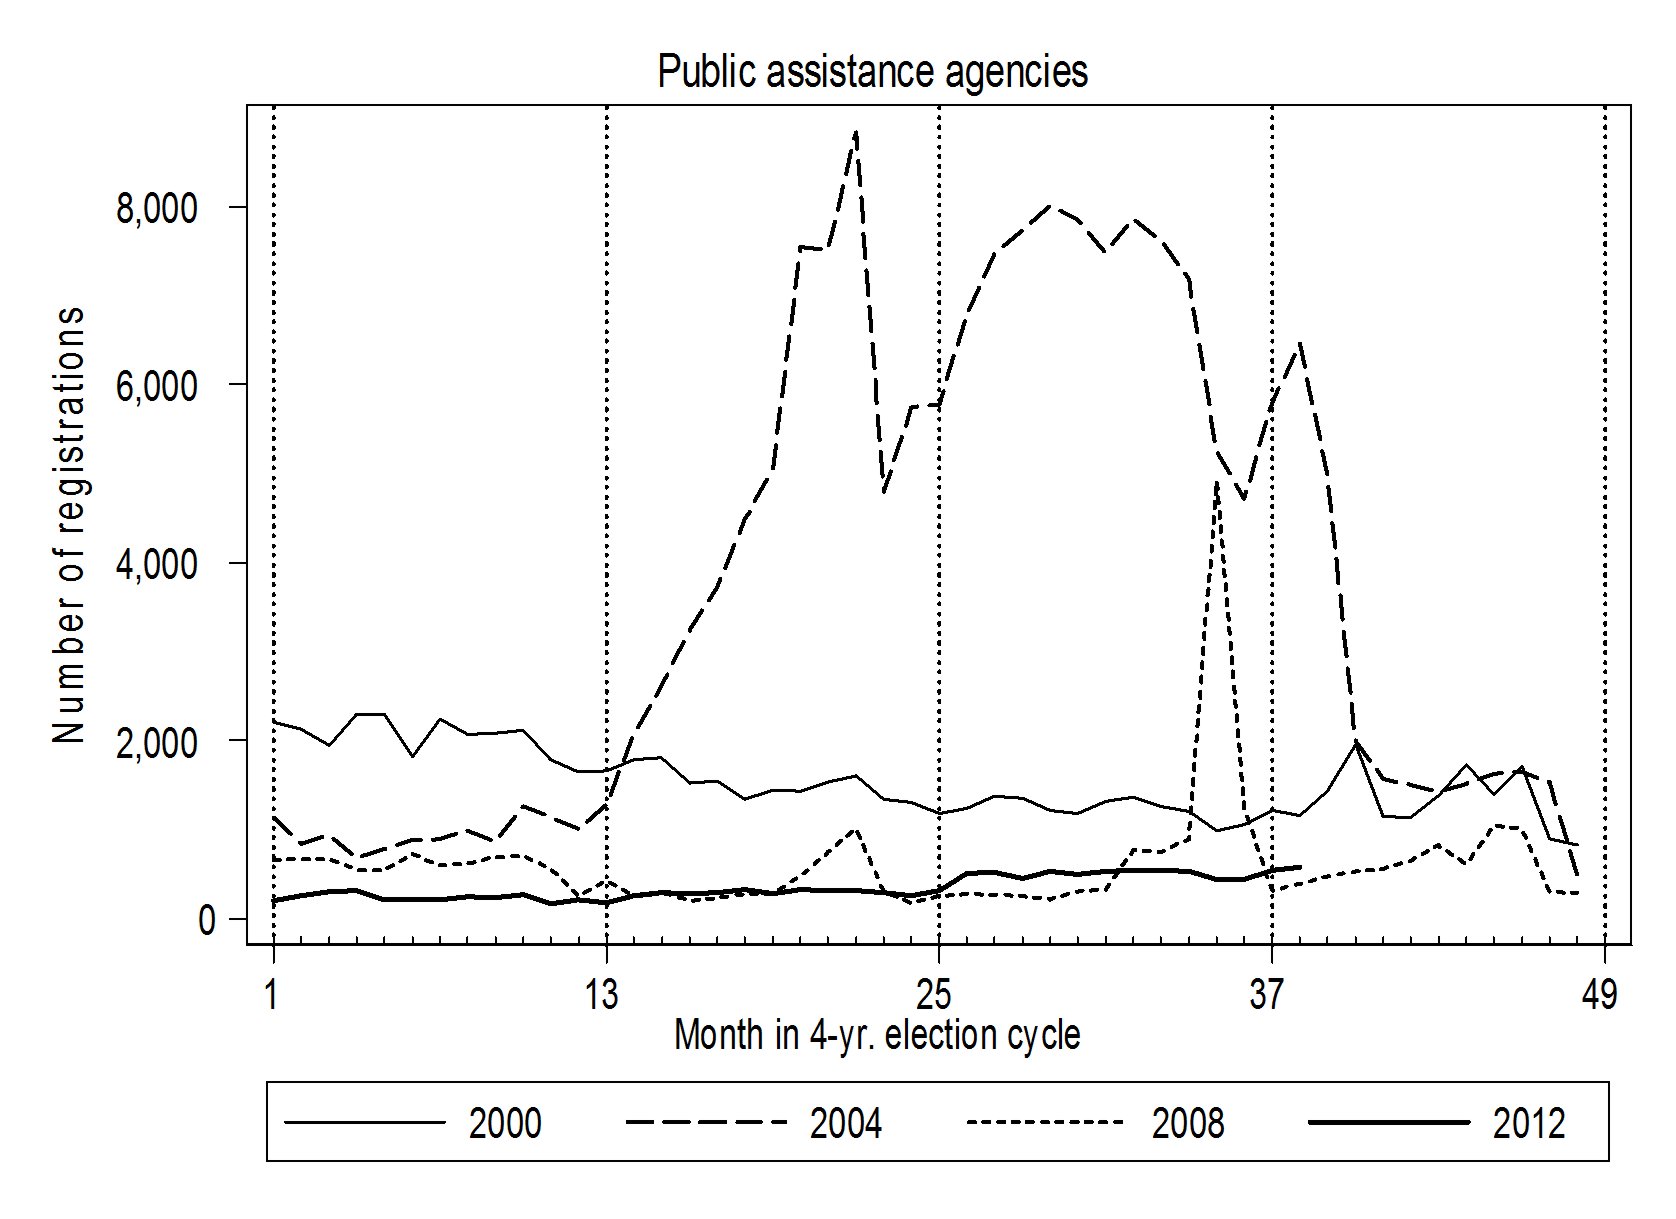
The fourth voter registration category is public assistance agencies. As the accompanying figure shows, with the notable exception of the period stretching from mid-2002 to early 2004, Florida has not been known for generating voter registrations at offices that cater to those needing assistance from the state. The exceptional period (along with the odd spike in November 2007) calls for explanation. This may be an error. However, if it isn’t, I am assuming there is an interesting story that someone could tell about this anomalous surge in voter registration forms emanating from Florida’s social service agencies. Again, I’d love to hear from anyone who knows what the story is.
After the public assistance agencies, there are the public libraries as a source of voter registrations in Florida. The following chart shows that time series:
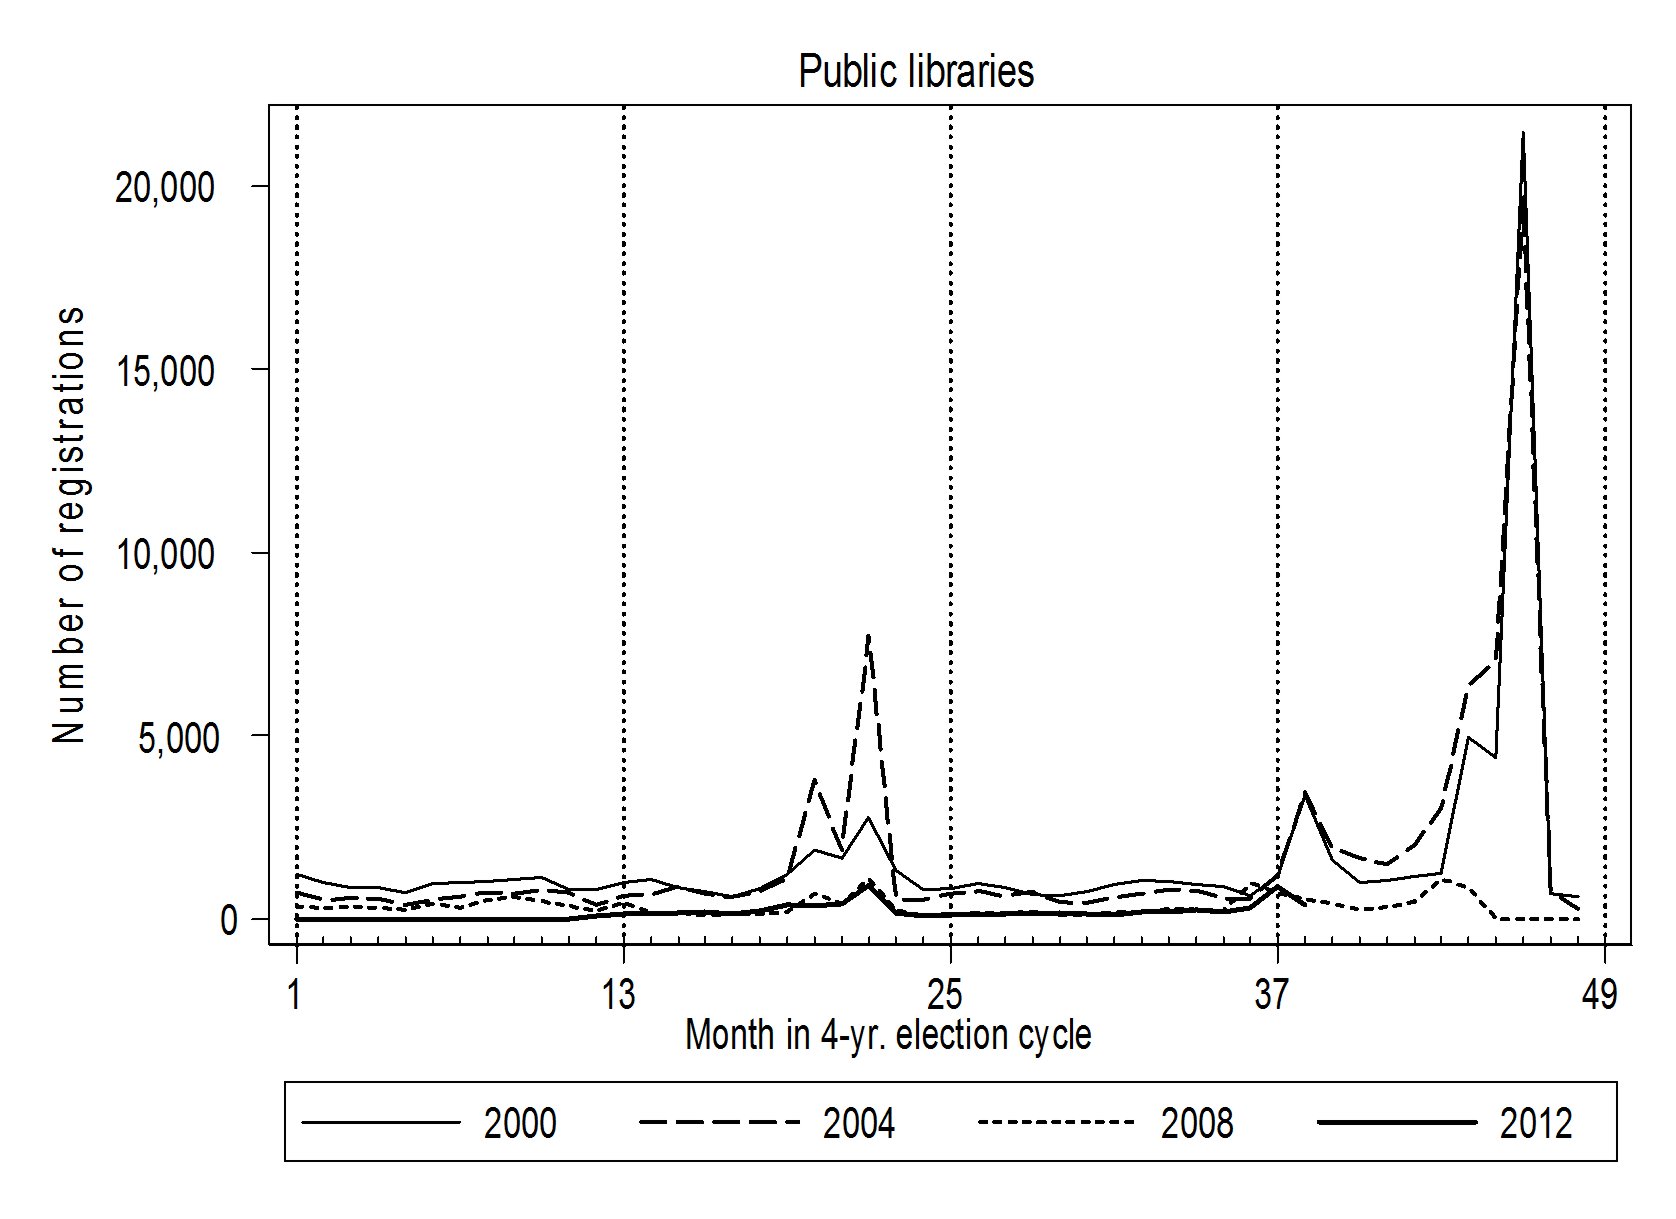
The pattern here is very similar to that of the “other” graph, only at a very much lower level of total registrations. With the possible exception of a little extra activity around midterm elections, registration at public libraries was mostly a story of presidential election activity in 2000 and 2004. As we have seen with so many of the other sources, the 2008 and 2012 presidential election cycles have seen a dramatically lower voter registration level from this source since the advent of the new voter registration system.
The next-to last source of voter registrations in Florida is agencies that serve the disabled. Here is the chart:
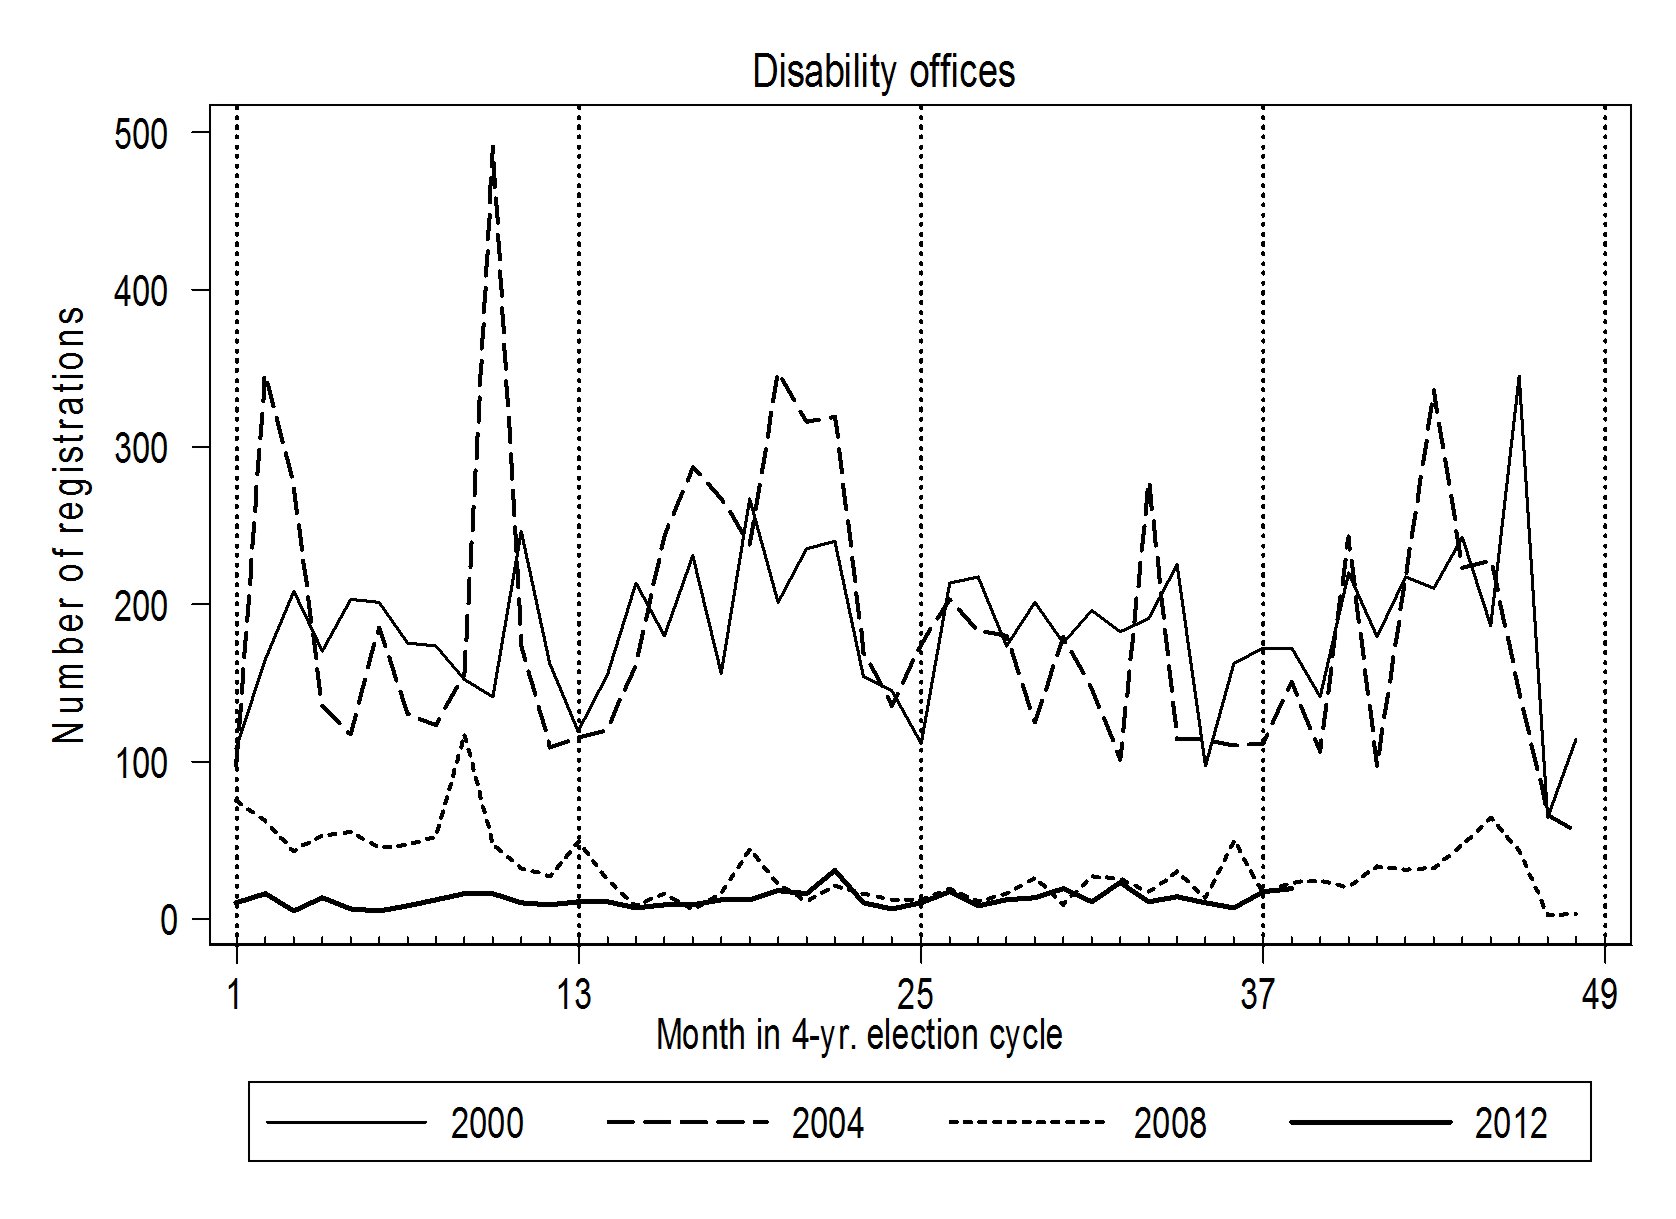
Even in the 2000 and 2004 election cycles, these offices were the source of very few voter registrations in Florida. Still, beginning in early 2006, it has been difficult to distinguish the numbers from zero in most months.
The least common source of voter registrations in Florida has been military recruiters. The following is the month-to-month graph of the numbers:
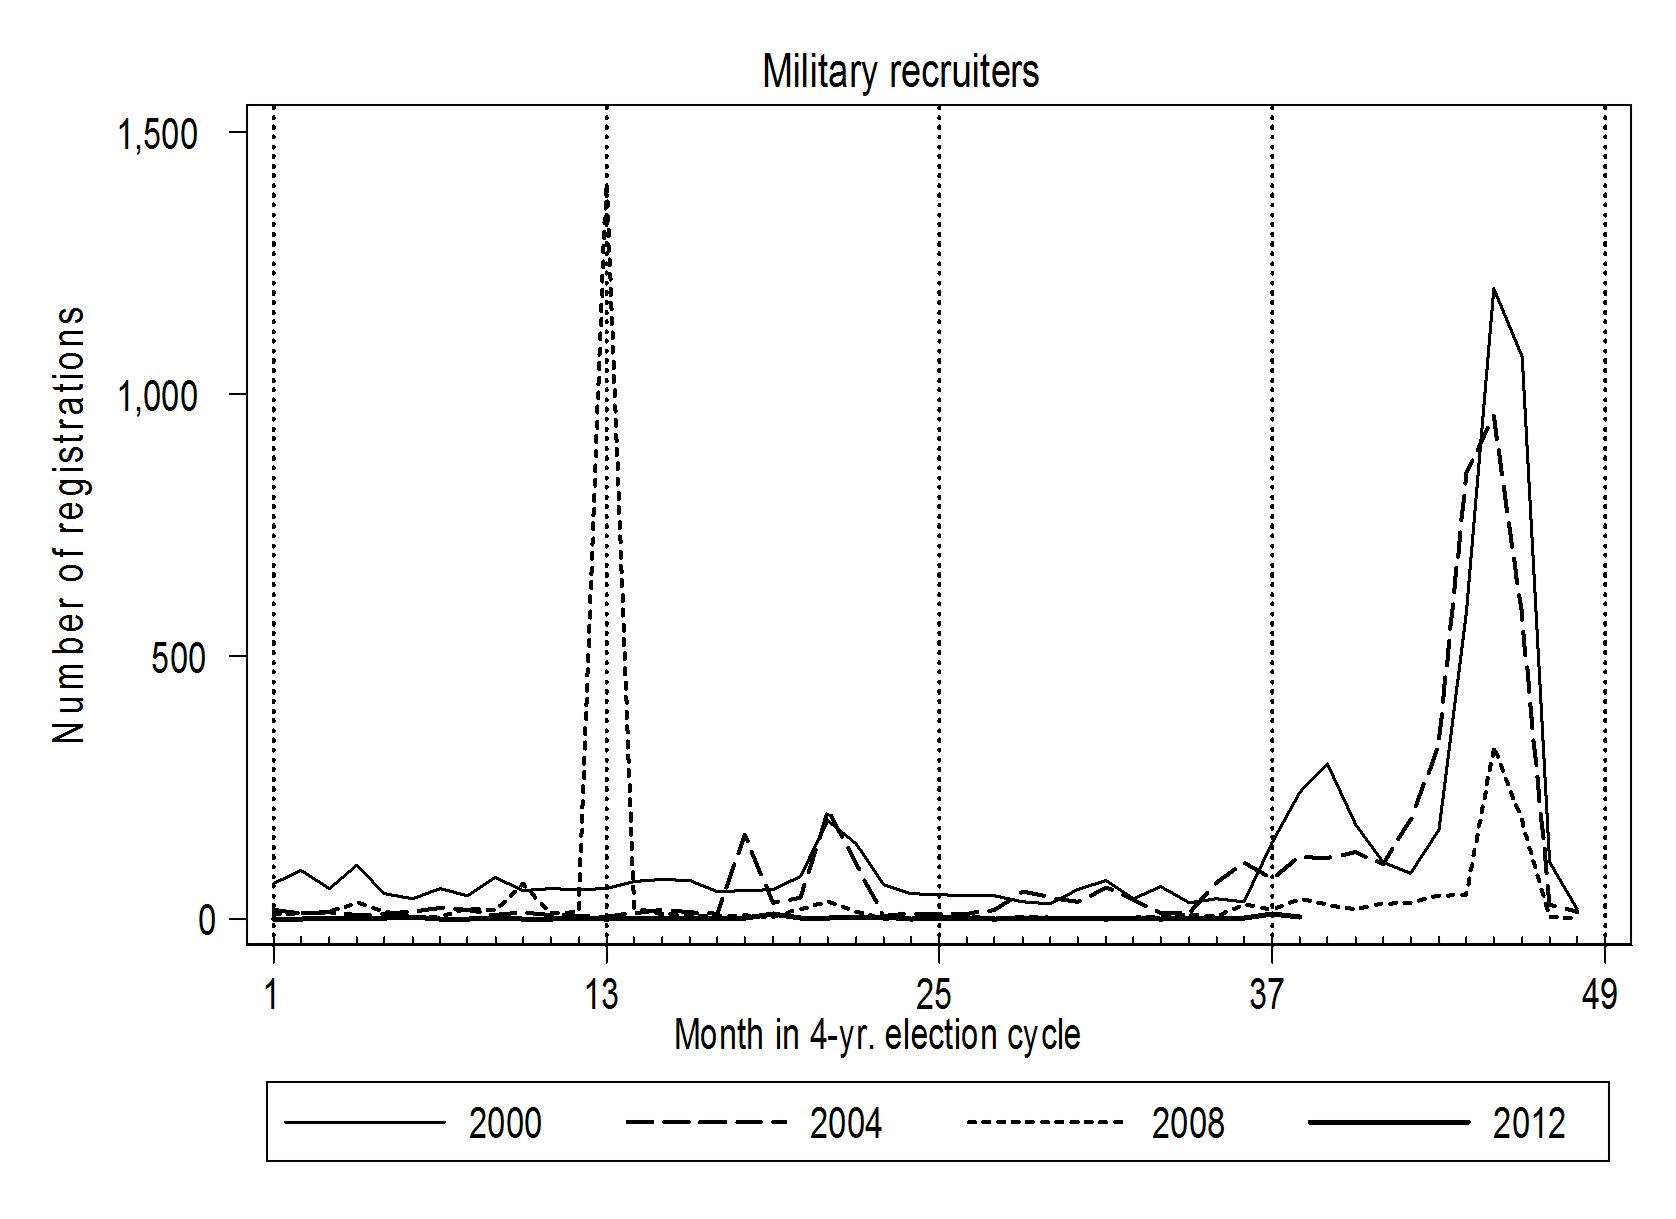 With the exception of an odd spike in early 2005, the number of voter registration forms coming from military recruiters has mostly been a phenomenon of presidential election years. As has been true for most of the other sources of registrations, 2008 was significantly below 2000 and 2004. The pattern for 2012 has been a flat line around zero for most of the cycle.
If you have lasted through this entire posting, I hope you get a sense of the larger picture of voter registration patterns in Florida. Perhaps HB 1355 has had a depressing effect on voter registration drives in the state. This is a matter before the public and the courts. The most striking thing about Florida voter registration patterns is how the numbers have shrunk since the institution of the Florida Voter Registration System in early 2006. Perhaps the dramatic shift in registration numbers is a artifact of how the statistics are being generated now. Or, perhaps it is part of a conscious decision to make it more difficult to register to vote in the Sunshine State. (Or, maybe the demographics are working against voter registration in Florida.) The important thing to note is that the potentially depressing effect of HB 1355 on third-party voter registration efforts is only the tip of the iceberg in Florida. The real prize here is understanding the larger pattern, rather than picking at piece of the puzzle, as if they were not related.