It looks like the Winter Park early voting site in Orange County is voting today (bomb scare yesterday), so the Florida early voting number aren’t 100% in, but it’s close, so here goes.
The basic spreadsheet is here, with party breakdowns by day.
First, the total early voting turnout was nearly 2.4m, compared to over 2.6m in 2008, for a reduction of 9.3%.
Second, the reduction wasn’t uniform as the following three graphs show. Graph 1 plots (on a log scale) the number of early votes cast in 2012 (vertical axis) against early votes cast in 2008 (horizontal axis). Graph 2 is a bar chart that shows how many more early votes were cast in each county, compared to 2008; Graph 3 shows this in percentage difference terms. (On this graph, the average 9.25% reduction is shown by the dashed line.)
The change from 2008 to 2012 isn’t simply a matter of the smaller counties showing greater variability. In fact, there is zero correlation (r = -.06) between the (logged) number of early votes cast in a county and the absolute value of the percentage difference between 2008 and 2012. I’m sure analysis will be forthcoming to explain these differences.
Graph1: Early voting compared, 2008 to 2012 (click on graph for a bigger view)

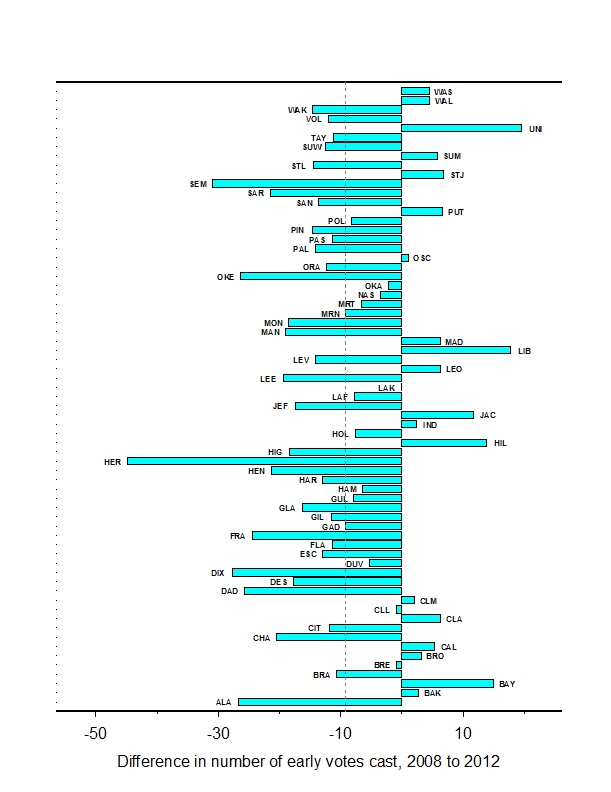
Graph 2: Bar chart showing difference from 2008: (click on graph for bigger view)

Graph 3. Bar chart showing percentage differences: (click on graph for bigger view)
