There is renewed interest in lines at polling places, in the wake of the 2012 presidential election. Here are some thoughts about the causes and incidence rates of long polling line, based on responses to the 2008 Survey of the Performance of American Elections, which I helped to design and administer in 2008. We will be re-conducting the survey this year. However, because interest is high right now, here are some top-level findings from that survey related to waiting in line to vote.
In reading the following, remember that the findings are based on responses to a survey, taken within a week of the 2008 general election. There were 10,000 registered voters interviewed nationwide, via YouGov/Polimetrix. The Pew Charitable Trusts funded the survey, along with the JHET Foundation and the AARP, none of whom bear any responsibility for the analysis that follows.
- Long lines were relatively infrequent. In 2008, 38% of respondents said the amount of waiting time was “not at all,” 27% said “less than 10 minutes,” 19% reported “10-30 minutes,” 11% reported “31 minutes to 1 hour,” and 5% said “more than 1 hour.”
- Early voters waited longer than Election Day voters. In 2008, 14% of Election Day voters reported waiting half an hour or more, compared to 22% of early voters.
- African Americans waited longer than whites or Hispanics. In 2008, 29% of African American respondents reported waiting half an hour or longer, compared to 14% of white voters and 15% of Hispanic voters.
- Early voters were less dissatisfied with their voting experience when they waited a long time to vote than Election Day voters. Respondents were asked to assess how well their polling place was run, with the top response (given by 82% of respondents) being “very well.” When an Election Day voter waited more than half an hour to vote, 57% of respondents said the polling place was run “very well.” In contrast, 68% of early voters who waited more than half an hour gave the “very well” rating.
- Voters who used electronic voting machines (DREs) waited longer than voters who use optically scanned paper ballots or hand-counted paper ballots to vote. In 2008, no respondents who voted on hand-counted paper ballots reported waiting more than a half hour to vote, compared to 16% of the users of optically scanned paper ballots and 21% of DRE users.
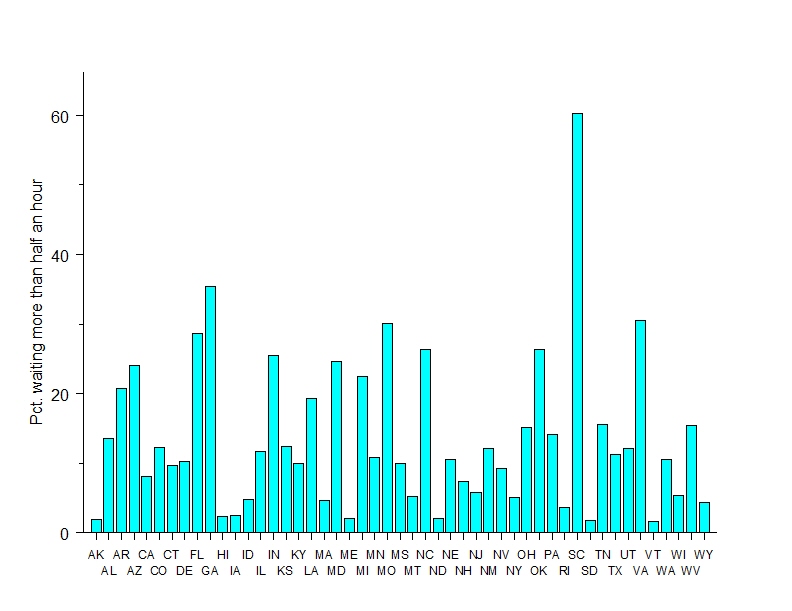
- States vary considerably in how long their voters report waiting to vote. The following bar chart illustrates this, by reporting the percentage of respondents in each state that reported waiting more than half an hour to vote.
These basic descriptive statistics are just the start of the analysis. When we account for race of the respondent, voting technology, and voting technology most of the variance in wait times still remains to be explained. There is a lot more research needed to get to the bottom of the “line problem” empirically. I hope to be presenting some of this research in the weeks and months ahead.
