Here is the update on in-person early voting statistics, in three graphs.
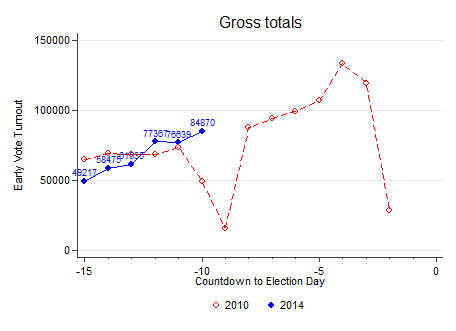
First is the day-to-day in-person early voting turnout, compared to 2010. Because all counties have now begun early voting, I don’t account for when counties started. (Over twenty counties opened their in-person early voting operations yesterday.)Unlike 2010, 2014 was the biggest day of in-person early voting during the first week. (Click on this, and all other graphs, to see the full picture.)
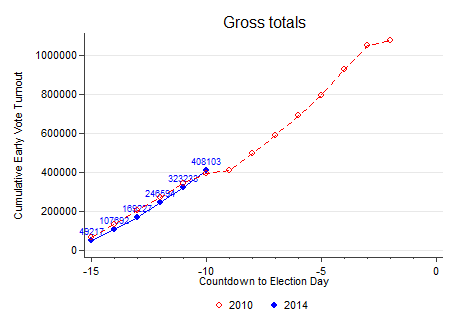
 Because of the big surge of in-person early voting yesterday, more voters have now cast a ballot via in-person early voting in 2014 than in 2010, despite the fact that over 20 counties only began early voting yesterday:
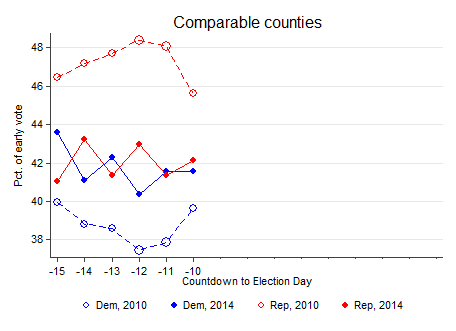
 Finally, the in-person early voting electorate has been much more Democratic in 2014 than it was in 2010: