Doug Chapin’s most recent post on his Election Academy blog tells the tale of the late delivery of 1,270 mail ballots in a recent election in Orem, Utah. This post brings to mind a surprising result (at least to me) from the 2014 Survey of the Performance of American Elections (SPAE) about the return of mail ballots.
In 2014, for the first time, the SPAE asked respondents who voted by mail how they returned their ballots. Nationwide, 2/3 of absentee and mail ballot voters returned their ballots by mail. That’s not the surprising part. This is what surprised me: If we look only at respondents from the three “vote by mail” states — Colorado, Oregon, and Washington — only 1/2 of “vote by mail” voters report returning their ballots using the Postal Service. Half the voters in these states took their ballot to an official elections site to be counted — 38% of these used a dedicated drop box, 29% went to the main elections office, and the rest went to a combination of places, including traditional neighborhood precincts and early voting centers.
Even those who used the Postal Service did not often use the convenience of front-door pick-up to return their ballot. Only 40% of voters who used the Postal Service to return their ballot had their own mail carrier pick up the ballot. An even larger fraction (46%) took their ballot down to the post office, while the rest deposited their ballot in the mailbox around the corner.
I have one additional point to add to this. Ever since I started administering the SPAE in 2008, I have asked voters how confident they were that their vote was counted as cast. Each time I have asked this, voters using the mails have expressed significantly less confidence than those who voted in-person, either on Election Day or through early voting. In 2014, for instance, 67% of those who voted by mail (or absentee) said they were very confident their vote was counted as intended, compared to 76% of Election Day voters and 73% of early voters.
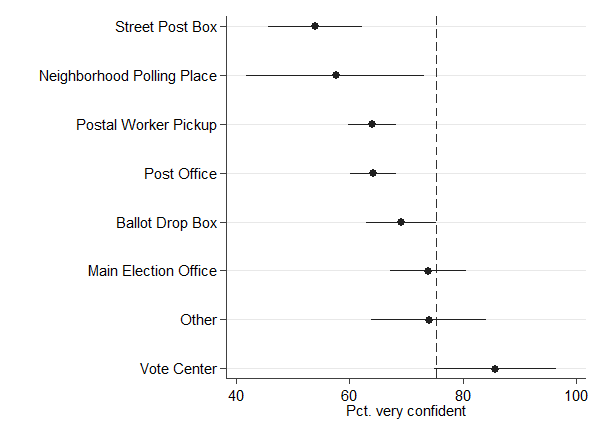
The results from 2014 help to show that this lower confidence in postal voting is related to how the ballot is returned. The following graph illustrates the relationship. The dots illustrate the fraction of “mail” voters who answered they were very confident their vote was counted as cast, broken down by how they returned their ballot. The “whiskers” around the dots are the 95% confidence interval around those estimates. The dashed vertical line shows the fraction of in-person voters who were very confident. Note that the “mail” voters who used the various Postal Service delivery routes were all less confident than those who voted in person. Those who returned their ballots at the mail election office, or who used a vote center, were just as confident, and maybe even more confident, in the case of vote centers. (The lower confidence among those who left their mail ballots at a neighborhood precinct is a little puzzling, but it might be related to the fact that very few people actually leave their mail ballots at Election Day precincts, which means that precinct workers may not always know what to do with them.)
 The Orem situation shared by Doug helps to illustrate the reality behind these national statistics. In the aggregate, voters seem to recognize that if they leave it to the Postal Service to deliver their ballot, there is some risk involved. By their behavior, vote-by-mail voters appear to like getting their ballot in the mail, but return it by mail? Not as much.