The North Carolina 9th congressional district controversy is an interesting case of how the data-rich environment of North Carolina elections allows election geeks to explore in great detail the dynamics of an election, using the incomparable North Carolina Board of Elections data website. In particular, Nathaniel Rakich at FiveThirtyEight and Michael Bitzer at Old North State Politics have mined the data deeply.
I don’t have much more to add, but I did want to put my oar in on two topics that may have relevance to the unfolding scandal. The topics are:
- Unreturned ballots by newly registered voters
- Unreturned ballots by infrequent voters
Thing # 1: Unreturned ballots by newly registered voters
The first topic is the return rate of absentee ballots by newly registered voters. Robeson County officials noticed a large number of absentee ballot requests being dropped off in batches, along with new voter registration forms. This apparently was one of the things that alerted officials to the possibility that something was up. In all the analyses posted, I hadn’t seen any reports of the percentage of unreturned absentee ballots by newly registered voters. Here it goes.
First, this pattern of batches of absentee ballots along with registration forms was reported in August. It turns out that the non-return rate of absentee ballots requested in August in Robeson County when the registration was also received in August was quite high — 95%, compared to 33% in the rest of the county. The number of affected ballots was quite small, 21, but this is still an eye-popping statistic when compared to other counties.
Second, broadening the window a bit, the non-return rate of absentee ballots among those who registered any time in 2018 in Robeson County was 81%, compared to 67% for those who had registered before 2017.
Thus, it’s likely that some sort of registration+absentee request bundling was going on in Robeson. However, the non-return rate is still high if we exclude the (possibly) bundled requests. Clearly, if there was fraud, it was multi-strategy.
Thing # 2: Unreturned ballots by infrequent voters
The second topic is whether infrequent voters were more likely to request an absentee ballot and not return it. This question occurred to me because it fits into a scenario I’ve talked about with other election geeks, about how absentee ballots might be used fraudulently. The idea is that if someone wants to request a ballot to use it fraudulently, they need to request it for someone who is unlikely to vote. Otherwise, when they — the actual legitimate voter — do go to vote, it will be noticed that they had already requested an absentee ballot. If this happens a lot in a jurisdiction, the fraud is more likely to be noticed.
Were a disproportionate number of absentee ballot requests being generated among likely non-voters in the 9th CD? Yes, but mostly in Bladen County.
To investigate whether this type of calculation may have played into the strategy, I looked a bit more closely at the unreturned absentee ballots in the recent North Carolina election. I hypothesized that registered voters who had not voted in a long time would be more likely to have an absentee ballot request manufactured for them than a regular voter. To test this hypothesis, I went to the North Carolina voter history file, and counted up the number of general and primary elections each currently registered voter had participated in since 2010. There have been nine statewide elections in this time (5 primaries and 4 general elections, not counting November 2018).
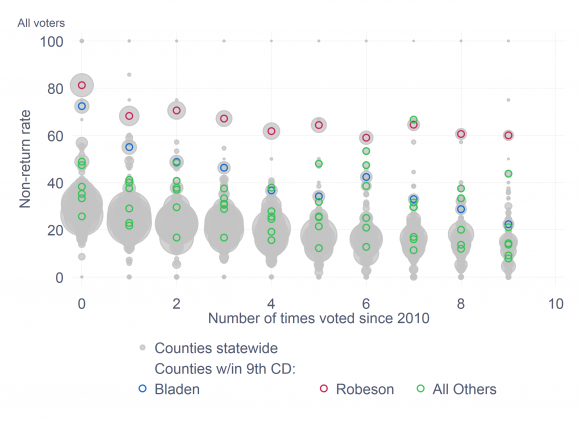
Sure enough, frequent voters were less likely to have an unreturned absentee ballot than non-voters. Statewide, voters who had participated in the past 9 statewide elections had a non-return rate of 14%, compared to a non-return rate of 32% for those who had never voted. (Among those who had never voted, but had registered in 2010 or before, the non-return rate was 38%.) In the 9th CD, these percentages were 25% and 43%, respectively. In Bladen, they were 22% and 72%
Interestingly enough, in Robeson County, which had the highest non-return rate in the district — and in the state — the relationship between being an infrequent voter and not returning the absentee ballot was not as strong. Among registered voters who had not cast a ballot since 2010, 81% failed to return their absentee ballot. Among those who had voted in every election, the non-return rate was 60%.
 The accompanying graph shows the more general trend. The grey circles represent each county in North Carolina. (Counties in more than one CD show up more than once.) Throughout the state, infrequent voters are more likely to request absentee ballots that are not returned.
Bladen County is highlighted with the blue hollow circles. Robeson is highlighted with the hollow red circles. All the other counties in the districts are the hollow green circles.
If the unreturned absentee ballots reflect, in part, artificial generation of absentee ballot requests, the logic of who was getting targeted looks to have been different in Bladen and Robeson Counties. Bladen County’s non-returns look more like they were associated with the strategy of requesting absentee ballots from people who would not notice. Something else was going on in Robeson County.