By Charles Stewart III, MIT
With the sudden surge of interest in mail balloting because of the COVID-19 emergency, there’s also been some interest in questions about who tends to use mail ballots now and who would like to use mail ballots. Here is provide some basic demographics related to the question. Because there’s so much going on right now, I won’t provide much commentary, allowing the numbers to “speak for themselves,” which is rarely a good idea.
The tables here address the following questions:
- Who voted by mail in the 2016 presidential election, by salient demographics (i.e., age, race, education, income, partisanship)?
- Who supports expanded voting by mail?
- How do people return mail ballots?
The data about the usage of mail ballots and demographics mostly comes from the 2016 Cooperative Congressional Election Study (CCES). Information about support for running elections entirely by mail and the return of mail ballots comes from the 2016 Survey of the Performance of American Elections (SPAE); I also used the SPAE for information related to the use of mail ballots by people with disabilities.
Patterns of mail-ballot usage and support for mail balloting need to be mindful of the fact that states organize mail balloting differently. Relying on the coding first suggested by the National Conference on State Legislatures, I divide states into four regimes: (1) excuse required for an absentee ballot, (2) no excuse required for an absentee ballot, (3) permanent mail ballot list, and (4) complete vote by mail (or “vote at home”). The following tables maintain this distinction.
Here are the take-aways:
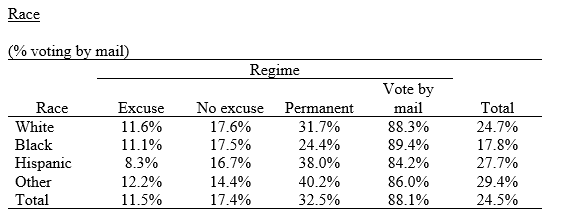
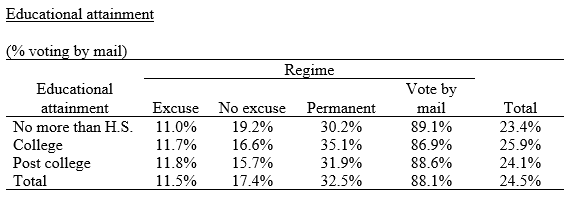
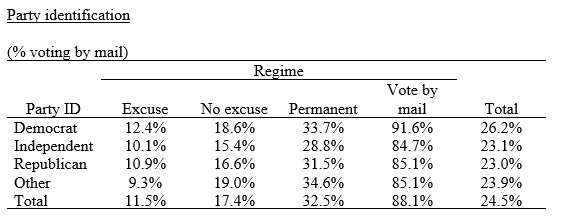
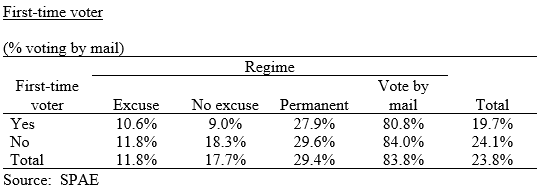
- There is very little demographic difference in the use of mail ballots.
- The one exception is related to age, where voters older than 65 are more likely to use them than younger voters. (Note that some states, even those that generally require an excuse to vote absentee, allow older voters to vote by mail without an excuse.)
- The lack of a major difference between demographic groups is contrary to some claims I have been hearing (and some I believed myself before running the numbers).
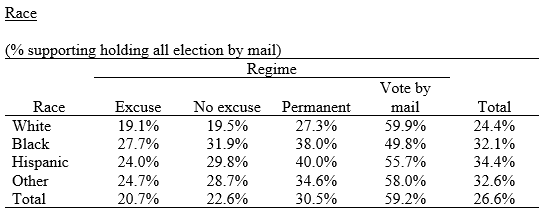
- Contrary to the claims of some, African Americans appear to be slightly more supportive of vote-by-mail reforms than whites.
- Despite being the demographic most likely to take advantage of voting by mail, the age group most in opposition to expanded voting by mail are those 65 and older. The relationship is strongest in non-vote-by-mail states.
- Voters in vote-by-mail states who return their mail ballots in person are more confident their votes were counted than those who mailed them back.
- Mail voters in vote-by-mail states are more confident their vote was counted as cast than mail voters in other states.
- There is still a substantial fraction of voters in vote-by-mail states that believe that all elections should not be held by mail.
Demographics and the use of mail ballots in 2016.
The following tables report the percentage of voters who report that they voted by mail in 2016. Responses are limited to those whose participation in the election was verified by matching to voter lists. Data source: CCES, unless otherwise noted.


Support for holding all elections by mail
The following tables report the percentage of respondents who stated that they supported “holding all elections by mail.” (Source: SPAE)


Return of mail ballots
The following tables report the method of return of mail ballots, along with the relationship between the method of return and confidence that one’s ballot was counted as cast. (Source: SPAE)

