By Charles Stewart III
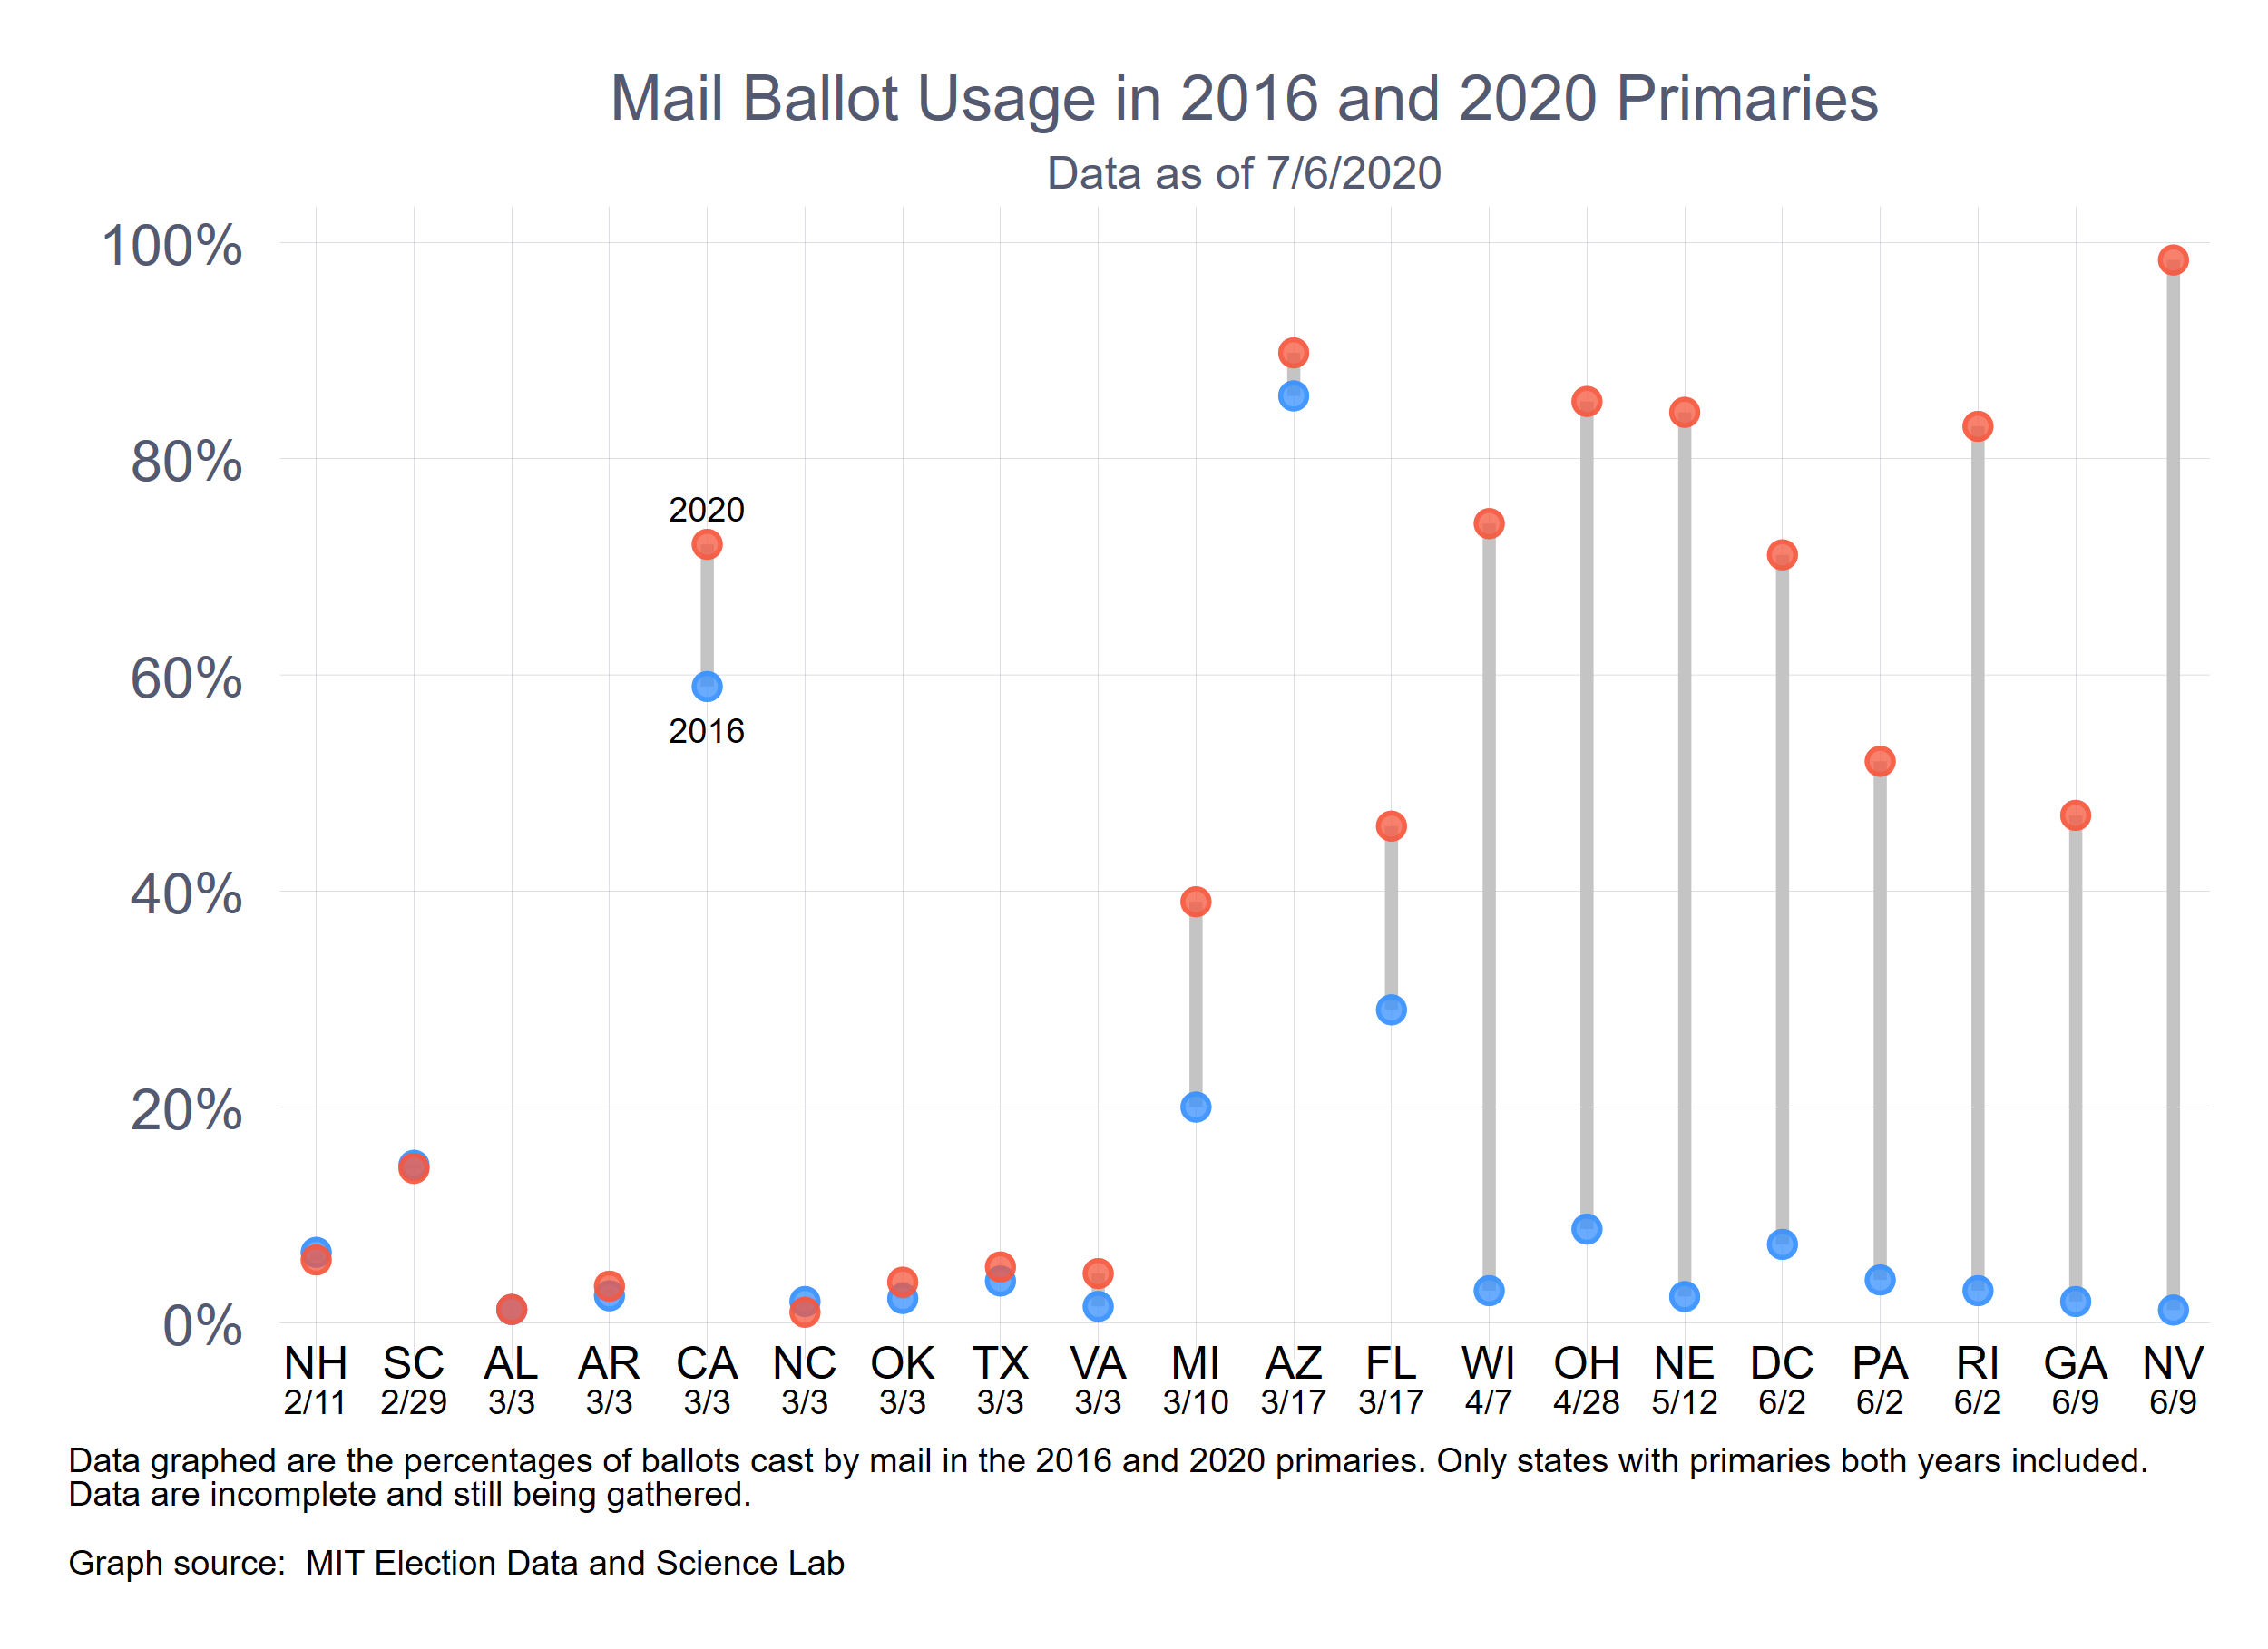
The MIT branch of the Stanford-MIT Healthy Elections Project has started a time series to follow the fraction of ballots cast by mail in the primaries. We will be updating on a regular basis and posting the graph to Twitter and here. Here is the most recent graph, as of July 6, 2020. Please let me know if you find any errors, have questions, or have leads on data. Below the graph are some notes on data sources.
About data sources: In general, we relied on the official state election returns or other state records (such as voter files) to record the data. The following are exceptions:
- Texas. In 2016, the state did not report percentage of votes cast by mail, although some counties did. The data for 2016 and 2020 reflect the percentage of votes cast by mail in the counties that reported the data in 2016.
- Arizona. Data are only from Maricopa County, which constitutes 61% of the state’s population.
- Pennsylvania. Data from 2016 are general election rates, taken from the Election Administration and Voting Survey.
The following states are excluded because they held caucuses in 2016: Colorado, Maine, Minnesota, Utah, North Dakota, Alaska, Kansas, and Hawaii.
States that are normally all-mail are excluded.
Vermont is excluded because 2016 data are unavailable.
The other states not on the graph, but which have held primaries, await the release of data from the state.