What’s North Carolina to expect?
Charles Stewart III
It’s now two weeks and a day to the general election. The Healthy Elections Project has been running a series of surveys in half a dozen battleground states, asking the intention of registered voters about how they intend to cast their ballots. This brief note focuses on North Carolina.
First, as to the intentions themselves. Not surprisingly, as the following table demonstrates, as Election Day has approached, voters have become more certain of what they intend to do. Overall, as the uncertain voters have decided what to do, the fraction saying they intend to vote during the early voting (one-stop absentee) period has grown. This is a small trend, based on small numbers, so I wouldn’t make too much of it. If we take the average across all three waves of the survey and exclude those who don’t know how they will vote, we can expect 30% on Election Day, 43% during one-stop (early) voting, and 27% by mail. If we take just the most recent wave, these numbers are 27%, 46%, and 27%, respectively.
|
Vote mode intention among likely voters, including don’t knows |
|||||
|
Date |
Election Day |
Early |
|
Don’t know |
N |
|
Sept. 4 – Sept. 11 |
29.8% |
39.8% |
24.7% |
5.7% |
483 |
|
Sept. 16 – Sept. 25 |
30.3% |
38.7% |
26.8% |
4.2% |
487 |
|
Sept. 30 – Oct. 9 |
26.6% |
45.4% |
26.3% |
1.7% |
488 |
|
Total |
28.9% |
41.3% |
26.0% |
3.9% |
1,458 |
|
Vote mode intention among likely voters, excluding don’t knows |
||||
|
Date |
Election Day |
Early |
|
N |
|
Sept. 4 – Sept. 11 |
31.6% |
42.2% |
26.2% |
455 |
|
Sept. 16 – Sept. 25 |
31.6% |
40.4% |
28.0% |
467 |
|
Sept. 30 – Oct. 9 |
27.1% |
46.2% |
26.7% |
480 |
|
Total |
30.1% |
43.0% |
27.0% |
1,402 |
(By the way, the overall 95% confidence interval for all three waves combined is around +/- 2.5 points. For any one wave, it’s around 4.4 points.)
Second, to convert these expectations to raw numbers, we need an estimate of turnout. I’ve done this in two ways. The first is just to assume that turnout is 10% above 2016, which would place it at 5.0 million. The second uses a very simple linear regression to predict the log of turnout in terms of the log of registered voters in the most recent six presidential elections, and then extrapolating based on the coefficients derived from that regression. This gives us an estimated turnout of 5.3 million.
Third, here is what the combination of numbers above imply for the final distribution of votes in North Carolina, by mode:
|
|
Vote mode, combining three waves of survey |
|
Vote mode, using most recent wave of survey |
||||
|
Assumed turnout |
Election Day |
Early |
|
|
Election Day |
Early |
|
|
5.0 million |
1.500M |
2.150M |
1.350M |
|
1.350M |
2.300M |
1.350M |
|
5.3 million |
1.590M |
2.279M |
1.431M |
|
1.431M |
2.438M |
1.431M |
Fourth, a final calculation needs to be made, if we want to estimate the number of mail ballots that will be requested, since not all mail ballots are returned. During the summer, it seems that 90% of requested mail ballots were returned. If that holds for the general election in North Carolina, it should expect between 1.5 and 1.6 million mail ballots to be requested.
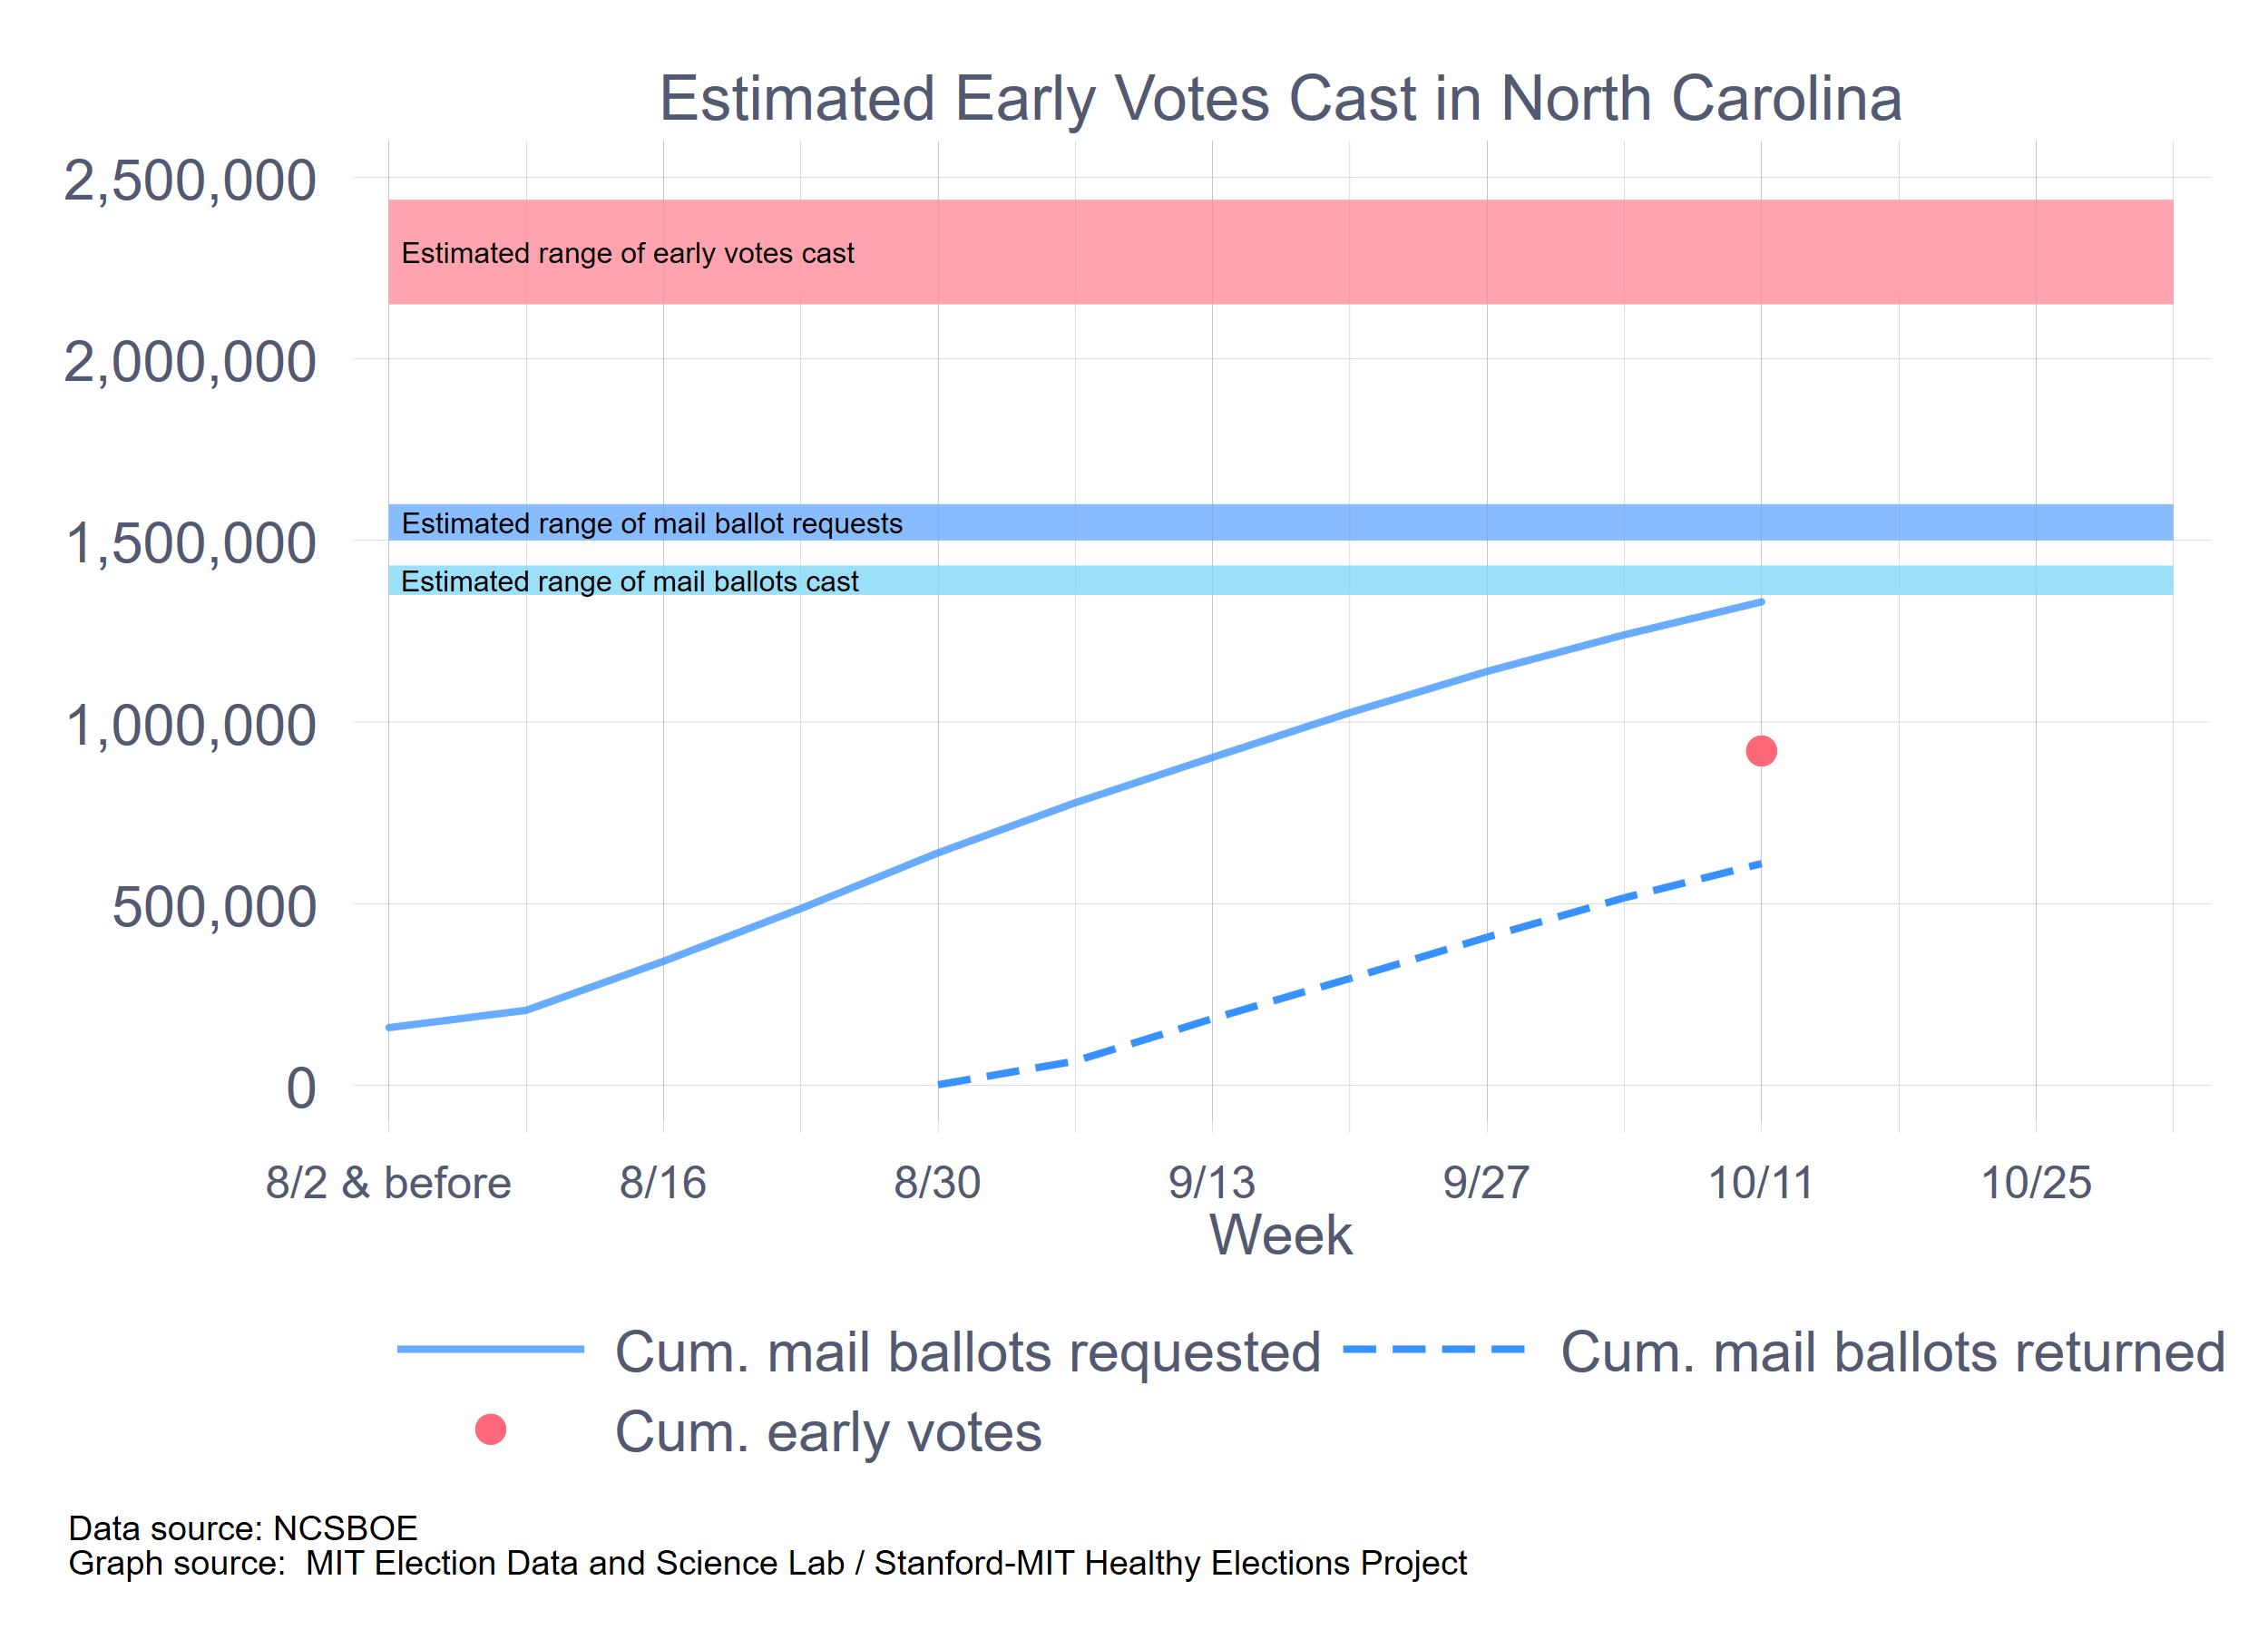
As of this morning (October 19), 1,331,050 mail ballots have been requested. In recent weeks, requests have been running at around 100,00 per week, so North Carolina is on target for the 1.5 – 1.6 million requests estimate.
Also, as of this morning, 622,781 mail ballots have been returned and 920,337 early ballots have been cast. On the mail ballot side, this means that about 45% of the ballots that will be returned have been returned. It also suggests that between now and Election Day, North Carolina should be seeing an average of 50,000 mail ballots arrive each day. Last week’s peak days saw just over 25,000 ballots received, so from this point out, the average day moving forward will be twice as busy as last week’s peaks.
On the early voting side, with 920,337 votes cast already, this leaves between 1.2 and 1.5 million votes go to. In other words, North Carolina is also a bit over 40% of the way to processing its early voting, as it is its mail votes.
Here is the graph that summarizes this all.