Category Archives: early voting

Survey on the Performance of American Elections Data Available

As part of my pre-Thanksgiving clean-up, I have finally gotten around to posting the data sets and documentation for three surveys my colleagues and I did in 2007 and 2008 to gauge the quality of American elections. The studies were funded by Pew, as part of their Make Voting Work Initiative, along with the late, great JEHT Foundation and AARP (for the Nov. ’08 study). The studies were conducted in November 2007 (gubernatorial races in KY, LA, and MS), February 2008 (15 Super Tuesday states), and November 2008 (all 50 states). Lots of questions about how well elections were run, from the perspective of voters, plus some questions about why non-voters didn’t vote.

The data are all on the MIT dSpace site: http://dspace.mit.edu/handle/1721.1/5523

One feature of these datasets is that we did parallel administrations using the Internet and telephone (random digit dialing), so people interested in how these two survey modes differ should find things of interest to them there.

Alternative Voting News of the Week

Ohio:

SoS Jennifer Brunner is being criticized by state legislators because she allowed individual counties to choose whether to send absentee ballot applications to all voters, and whether to include return postage.  Brunner argues that the legislature failed to allocate enough funds.  The Legislature counters that not all allocated funds were used, and not sending them to all voters leads to inconsistency and unfairness.  Story in the Dispatch.

Washington

King County’s first all vote by mail election is underway.

Virginia

Governor Kaine is proposing no-excuse absentee balloting, but local officials are worried about the cost implications.  A number publicly acknowledge, however, that no one pays much attention to the 17 excuses mandated under current law.  Story in the Richmond Times-Dispatch.

The Arlington General Registrar says he likes the idea, and advocates a fully all by mail system.

CO Count likely to be delayed due to mail in ballots

I hate to do an “I told you so” but I have warned reporters that there are three states I would watch for slow counts this year.  Each of them only recently adopted no-excuse absentee voting, and I was concerned that they were not prepared for the avalanche of paper they will receive.

I can walk through the many steps that an absentee ballots has to go through before it is actually tallied but a metaphor seems to work best.  Suppose you receive about 10 pieces of mail a day, and suddenly I deliver 10,000 to your door.  Will you mailbox hold them?  Where will you store them?  How will you open them?

Today’s story in the Denver Post confirms this for Colorado.  The other two states I’d keep my eye on is Ohio and New Jersey.

We already know from the past that tallies in California will be delayed a few days, and Washington state about a week.  This is all due to the complexities of processing absentee ballots.

Guest Bloggers: Peter Foley and Andy Sinclair, "Early Voting in Los Angeles County: 31 October, 2008"

Editorial Note: This is another voter experience guest blog. Andy Sinclair is a graduate student at the California Institute of Technology; Andy wrote the text. Peter Foley is also a graduate student at the California Institute of Technology; Peter provided the photos in the slide show at the bottom. I made the slideshow from Peter’s photos. RMA.

Early Voting in Los Angeles County: 31 October, 2008

Written By Andy Sinclair

Peter Foley accompanied me as I ventured down to vote at the only early voting site available in Los Angeles County, the County Registrar’s office in Norwalk. For those of you unfamiliar with Los Angeles County, Norwalk is not at all centrally located in the county: we had good luck with the traffic on the freeway and it took half an hour to drive from Caltech and another ten minutes to find a place to park. At that point, the adventure began.

We arrived in the middle of the lunch hour and the line circled around the block (see accompanying photo). We watched the Sherriff chase away and ticket a vendor selling Obama shirts and signs across the street – although it wasn’t clear to us if this came about because they were too close to the polling place or because they parked illegally (see accompanying photograph in the slideshow). With some good fortune, the people in the line around us were very pleasant and so we had a nice conversation as we waited and watched the local television news crews interview some of the waiting voters. This took about thirty to forty minutes.

At that point, I could pick up a number (Green 108) and the clerk at the desk instructed me to go sit in the tent behind him. I peered into the tent and observed that I wouldn’t have a place to sit in the tent, so I sat on the grass outside. This was nice enough until someone came along and chased us inside the tent. There, I waited. We figured by a rough calculation that there were somewhere between 300 and 500 people inside this tent. We had no idea how long this would take: the woman in front with the bull horn shouted about ten numbers at a time in no particular order.

For example, she would shout – and I quote – “Ya’ll listen for your numbers.” Then a list: “457 Pink. 4 Green. 166 Pink. 185 Pink. 308 Pink. 107 Green. 200 Pink. 50 Green.”

I observed that some voters got so fed up that they just left. We noticed that a lot of numbers came up in several cycles – implying that their holder either couldn’t hear or gave up and left. Several voters, hearing their numbers called, yelled “Bingo!” This seemed most appropriate. After two hours, the harassed woman in the front called 108 Green, and I went to vote.

It turns out, an “Early Ballot” in LA County is just an absentee ballot given to you by hand. I traded in my number ticket for the ballot and went to vote in the area of polling stations, set up in a side-tent. This was more or less like voting in a regular polling place, including the usual screw-ups like voters showing the officials their ballots and asking if they are filled out “right.”

By the time I arrived back in the office at Caltech, I had invested four and a half hours in this voting project.

We did come away with at least one concrete suggestion to improve the voting experience: if the officials called people in some sort of numerical order then at least we would know how long we had to wait.

A Slideshow of Early Voting in Los Angeles County, October 31, 2008.

Photos by Peter Foley.

Where do those NC absentee votes come from?

A brief additional word about the NC absentee ballots.

A lot has been written about the two campaigns (particularly Obama) encouraging students who are away at college in safe red or blue states to vote absentee back home, if they come from battleground states.  NC provides one such illustration of this.

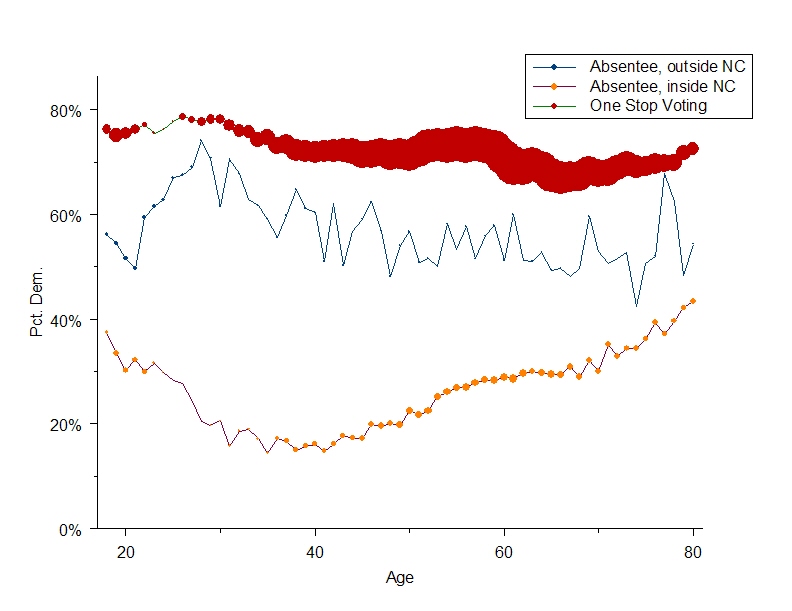
The NC early voting file includes the age of everyone who has returned an absentee ballot.  Let’s look at people who were 18-21 years of age, And, for the sake of linguistic convenience, let’s call these people “college students,” though we know that not all of these are.

First, only 7.4% of the returned absentee ballots in NC among college-aged students are from out-of-state.  That’s just a bit more than 6,000 ballots as of this writing.  While these numbers will undoubtedly grow as we get closer to Election Day, this is not a very significant proportion of the nearly 1 million “convenience votes” cast in that state thus far.

Second, proportionately more Democrats seem to be sending back absentee ballots if they are currently living in a Democratic state, and vice versa. For instance, 84% of the college-aged absentee ballots from DC were from registered Democrats, 87% from MA, 76% from RI, 83% from VT, and 78% from NY.  On the other hand, 59% of the college-aged absentee ballots sent from UT to NC were from registered Republicans, 44% from WY, 88% from ID, 67% from NE, and 48% from OK.

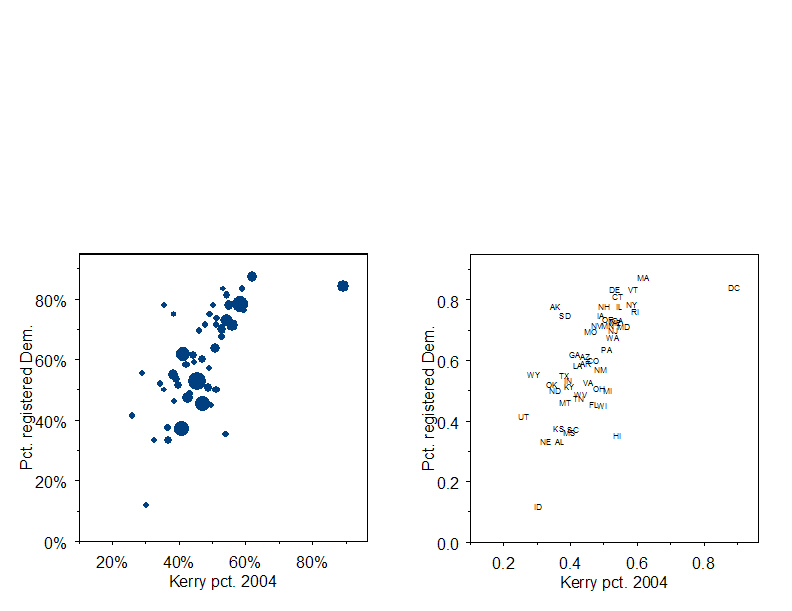
The accompanying two scatterplots, available here, show the relationship between the share of absentee ballots being sent by registered Democrats and the vote for Kerry in 2004 in the various states.

(When you look at the scatterplots, the two are identical, with one difference. On the left, I have indicated the number of returned balots by the size of the circles. On the right, I have indicated the abbreviation of the state.)

What does this mean? It can mean at least two things. First, it could mean that Democratic North Carolinians are more likely to go to college out-of-state in Democratic states, and vice versa. Second, it could mean that Democrats are more successful in getting North Carolina Democrats away at college to send back an absentee ballot if they happen to be in a Democratic state, and vice versa.  Or, it could be a bit of both.  Nonetheless, keep in mind that these numbers are pretty small, thus far, and unlikely to make the difference in the final outcomes. (Watch me have to eat my words.)

A Yogi-ism for Election Administration

In a Thomasville Times-Enterprise article about early voting in Thomas County, Georgia, Eunice Cook, a local election official, is quoted as saying the following about the growing numbers of people voting early in her county:  “Lines are getting longer,” Cook said. ‘They’re trying to avoid the longer lines.'”  Turns on its head what Yogi Berra once said about a trendy restaurant: “No one goes there any  more, it’s too crowded.”  (Or, as we say in the Election Administration business, the future isn’t what it used to be.)  Here’s the whole article.  It’s a nice little piece reminding us about what elections look like in a place where not a whole lot of people are watching.

More on those NC early voting trends

The North Carolina Board of Elections has perhaps the most extensive election data available for download on the web. There is no better example of this than the voter files posted that report who has already voted in that state. James Hicks at the Early Voting Information Center has posted some informative graphs detailing the partisan leanings of the early voters in that state. You can see those here.

Even though downloading and using the data isn’t for the faint of heart, it’s hard to resist a data file with almost a million observations about actual voter behavior.

First, the most striking thing about early voting in North Carolina is that the partisan composition of the different early voting modes is striking, as the following table shows.

Ballot type

Democrat

Libertarian

Republican

Undeclared

Number

Civilian

26.7%

0.1%

55.2%

18.1%

223,297

Military

32.5%

0.1%

34.6%

32.8%

12,173

One stop

60.0%

0.1%

23.5%

16.5%

679,132

Overseas

42.7%

0.1%

24.1%

33.1%

5,012

Total

51.4%

0.1%

31.3%

17.2%

919,614

Both the civilian absentee and one-stop voters are more partisan than the military and overseas absentees. But, most striking is that the one-stop voters are dramatically more Democratic than the absentee voters, of any type.

There has been speculation about the role of young voters in this election, which we can get some insight into by examining the registration tendencies of different age groups, according to the method they have used to vote thus far. These data are summarized in the graph you can retrieve by clicking on the following link.

Democratic registration by age and early voting method in NC

The graph shows this: 

First, ignore the colorful circles. The top (red) graph reports the percentage of different age groups that are registered as Democrats, among those who have voted early, using the “one stop” provision. (In this graph, I have removed the unaffiliated voters, to concentrate on the partisan aspect of these turnout figures.) The middle (blue) graph reports the same for absentee voters who are voting from outside the state. The bottom (orange) graph reports the Democratic registration rates for absentee voters voting from inside North Carolina.

About the circles: the size of the circles indicates how many voters are in each category. The bigger the circle, the more voters. So, we see that the bulk of one-stop voters are middle-aged, the bulk of out-of-state absentee voters are young, and that inside-NC absentee voters are almost mostly middle-aged, with a bit of an increase among the college-aged crowd.

The middle graph is the most interesting to me. The first four circles are the college-aged voters. They are the least Democratic of the out-of-state absentee voters. By a small (but consistent) margin, the freshmen are the most Democratic of this group, followed by the sophomores, then the juniors, and then the seniors. There is this interesting jump up to the 22-year-olds, which starts a trend that continues to the 28-year-olds, when a gradual decline in Democratic leanings goes to the end. North Carolina students who go away to college appear to be less Democratic than other Tarheels who are out-of-state this election season. But, the more interesting trend among young out-of-staters is the bulge in Democratic registrations among those who are away, starting their careers.

Absentee voters within the state exhibit a U-shaped relationship between age and their partisanship. The youngest in-state absentee voters are very Democratic, as are the oldest voters.

More on the details as I have time.

Meredith and Maholtra paper

I read the Meredith and Maholtra paper cited by MIke, and while it’s a nice methodological effort, I think the authors significantly overreach on the conclusions.

In essence, what the authors show is that the candidate totals differ between VBM precincts and non VBM precincts.  They have an elegant design comparison, choosing precincts just over and just under 250 voters, thus addressing some of the selection problems that bedevil other research that relies on this “natural experiment.”  Table 1 does a very nice job assessing the differences between the precincts.

The paper is solid methodologically, bu the conclusions overreach.  It is no secret that candidate totals differed between absentee/by mail and precinct place ballots.  I reported in an earlier posting here that 80% of John Edwards’s votes in Contra Costa County were absentee, while 40% of Obama’s and Clinton’s votes came in via that mode (in line with the state average).

But does this say anything generalizable about “information loss” and “campaign momentum”?  The authors say yes:

We predict that late campaign information loss will cause John Edwards, Rudy Giuliani, and Fred Thompson to perform better among VBM voters.  This is not to say that some voters do not prefer to vote for withdrawn candidates under full information as a protest or expressive vote; indeed John Edwards got more than seven percent of the vote in the West Virginia primary on May 13, 2008, months after he withdrew from the race.  Instead, we attribute any significant increase in support for withdrawn candidates when using VBM instead of polling place as evidence of late campaign information loss.

I would need to be convinced that this more complicated explanation is valid rather than the much simpler one: voters won’t cast a vote for a candidate who has withdrawn.

The analysis of Huckabee is a case where theory fits data much better–Huckabee’s momentum gains during this period are reflected (2-3 percentage points worth) in the vote by mail vs. precinct place votes.

Long lines at early voting sites in Florida? A possible unintended consequence of voting equipment switch

The move from touch screen voting technology to printing paper ballots on demand could potentially lead to long lines of voters at early voting sites in Florida, according to a recent report researched and written by Conny McCormack, an elections consultant to the Pew Charitable Trusts and JEHT Foundation’s Make Voting Work initiative.

McCormack, who from 1995 until her retirement at the end of 2007 served as the chief elections official for Los Angeles County, CA, the largest election jurisdiction in the country with over four million registered voters, visited two large Florida counties, Hillsborough and Miami-Dade, during the early voting period in conjunction with their August 2008 statewide primary election.  Her objective was to observe how the transition from direct record electronic (DRE) touch screen voting technology to the newly instituted optical scan “ballot on demand” paper ballot printing technology would impact the early voting environment.

Ballot on demand, according to McCormack, is a complex system requiring several additional steps for voters to interact with both the equipment and the election clerks.   McCormack made direct comparisons to the voter processing time needed when utilizing a ballot on demand system to generate each voter’s ballot compared with the previous system.  She found that the new ballot printing system requires as much as 10 times longer to print the correct ballot for the voter than when processing voters using touch screen voting technology.

McCormack writes about the potential impact to the November 2008 election in Florida:

“The additional time needed to print up to four op scan ballots, coupled with the expectation that the volume of early voters will increase sevenfold or more compared with the August primary election, is a cause for concern that voters may encounter long waiting lines as a result of the equipment change.”

The full report is available at http://earlyvoting.net. McCormack can be reached at connymccormack@gmail.com

KY is First in early voting

I have confirmed that Jefferson County, where Louisville is located, will open for early in person absentee voting ONLY for those with excuses, starting tomorrow.
Congratulations, Kentucky!

Next up: Fairfax County, VA, this Friday.