Reconsidering schools as polling places in the U.S.

There was an interesting story circulating over the weekend in many newspapers from the AP, discussing how in many states school officials are reconsidering the use of their facilities as polling places. Here’s the story, “Some schools want to stop serving as voting sites.”

This reminded me that Thad Hall and I have written about similar concerns over the years. For example, interested readers might want to take a look at this piece that Thad wrote on October 19, 2008 (yes, that is 2008!!!!), “Schools and voting.”

Remembering Charles Vest

Charles Vest, former MIT president, passed away recently. There is a wonderful statement about his contributions on the MITnews site. Chuck touched the lives of many academics over the course of his career, and we wanted to celebrate his role in the establishment and success of the Caltech/MIT Voting Technology Project.

The genesis of the VTP came in the immediate wake of the 2000 presidential election, when Chuck (then president of MIT) and David Baltimore (then president of Caltech) thought to put together a unique group of scholars who spanned both academic disciplines and the continent. Vest and Baltimore helped to launch the VTP, they helped to secure early funding for the project, and they were both committed to the project’s lasting success.

Chuck played a important role in putting the MIT team together, in helping to secure early funding for the project, and in providing later intellectual, administrative and financial support. He was a long-time supporter of the VTP, and he continued his support of research on election administration and voting technologies when he later became President of the National Academy of Engineering.

The VTP would not have had the impact and durability had we not had the leadership of Chuck. He will be missed.

R. Michael Alvarez and Charles Stewart III

Boston voters benefit from HAVA

One of the requirements in HAVA was that voting machines start warning voters when they over- and under-voted ballots. I have just been shown a small example of why this was a good requirement.

Boston had a very interesting (and important) mayoral election this year. I previously blogged about the layout of the polling places where I did some observation in the preliminary (“primary”) election held in September, to choose two candidates who later faced off against each other in the November general election.

One of the things I noticed in my observing was that it seemed that quite a few voters had to spoil their ballot, because they had over-voted for mayor.  I asked the Elections Department if they could give me the number of spoiled ballots in each precinct in the election — to see if more spoiled ballots led to more lines at the polls.  (That’s the topic of another posting.)  I’ve just received the spreadsheet with the data.  Here are the results:

Out of 113,319 ballots cast overall in the preliminary election, 3,597 were spoiled, presumably for over-voting the mayor’s race.  That’s 3.2% of all ballots.  In contrast, the final election returns reported that only 421 of the ballots contained no vote (“blank”) for mayor.  That’s a residual vote rate of 0.4%.  If the spoiled ballots had been voted instead, the residual vote rate would have been a substantial 3.6%.  As a consequence of the over-vote protection, nearly 3600 Bostonians had their preferences for mayor reflected in the mayor’s race.

You might ask, “why so many over-votes?”  The reason is simple:  the purpose of the election was to choose two candidate who would survive to the general election.  The radio stations during the day were urging people to go to the polls on election day to “vote for the two people who will face-off in the general election.”  It seems that some fraction of voters took their voting instructions from the talkers on the radio, not from the instructions on the ballot.

The over-vote protection does introduction confusion and delay into voting, but this is yet more evidence (however small) that it works to ensure that every vote does count.

Reflections on polling place design

I spent yesterday visiting five different polling places in Boston (one of them twice), during the preliminary mayoral election. I chose the precincts randomly, though I used a method that assured me I would hit some big-registration precincts and some smaller ones.

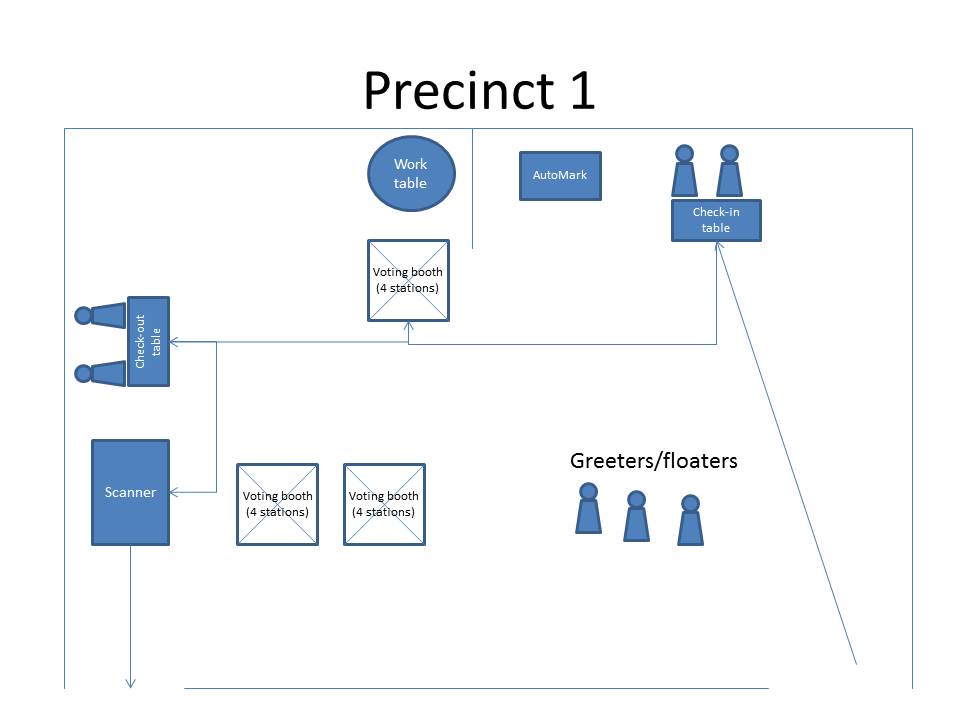
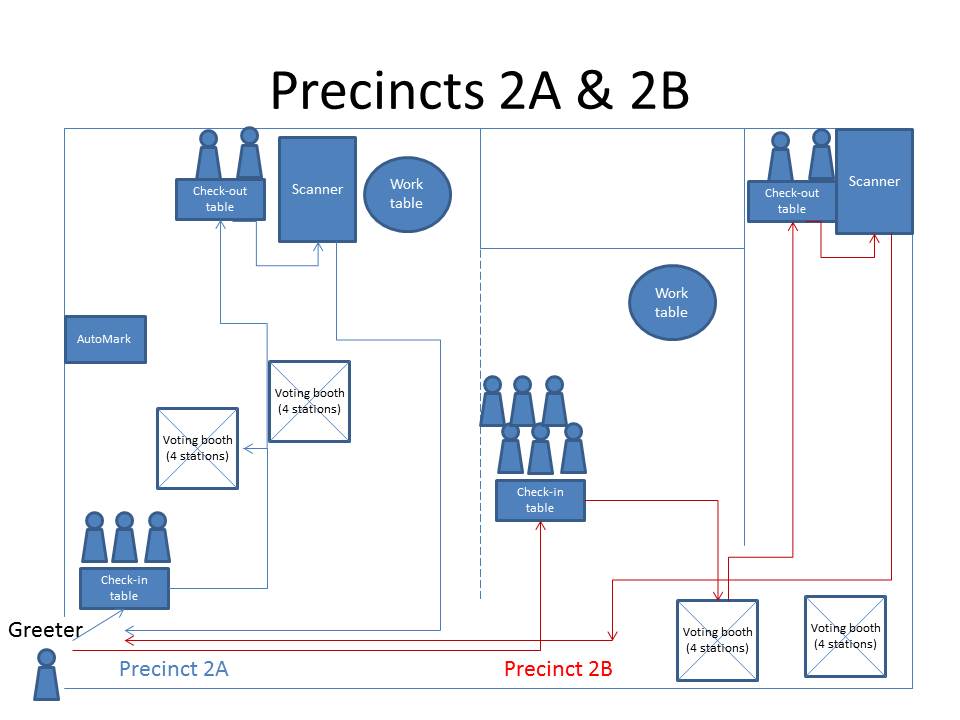
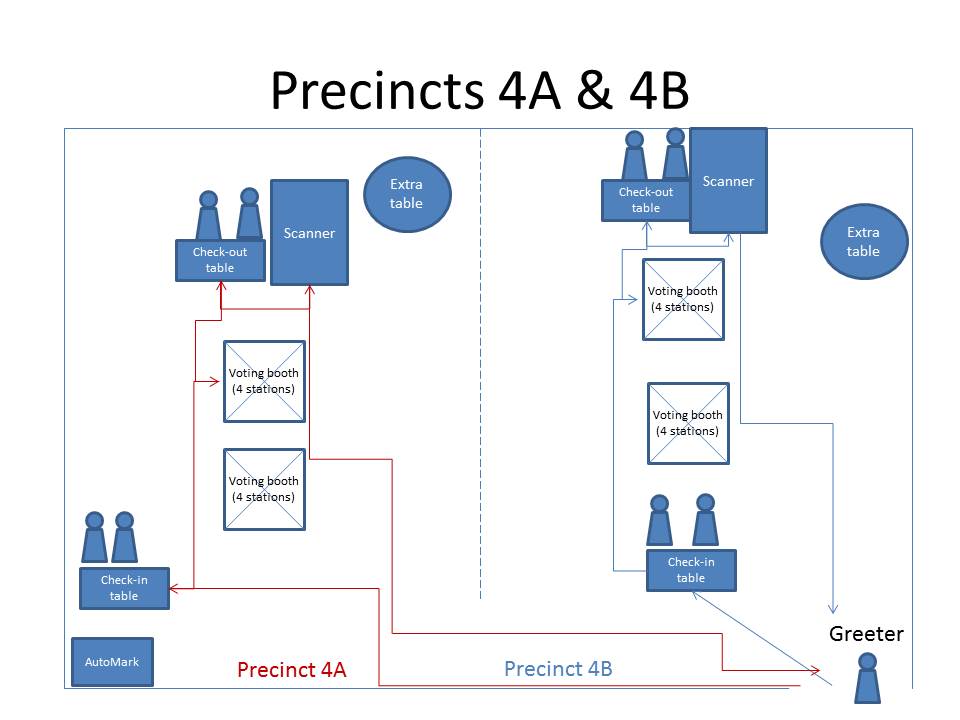
One of the things I did was sketch the layout of each of the precincts I visited. I’ve attached cleaned up versions of those sketches to this posting (using that great drafting package, PowerPoint). As my geologist spouse would require me to say, these are not to scale; however, the sketches that look the most crammed together were the most space-constrained.  I haven’t identified the precincts, because that’s not important. What is important is the variability.

Here are four quick thoughts:

(1) Local officials frequently remind us that they do not own the spaces they use, which was definitely true here. (The point was driven home when the building owner of one polling place decided to start power-washing the building, directly over its entrance, right as voting began.) These were all brightly lit, safe, pleasant spaces, but none was optimized for voting.

(2) The amount of space available for the voting equipment was loosely correlated with the amount of business or amount of equipment.  As a corollary of point (1), sometimes the best available community spaces required the city to cram a bunch of equipment together.

(3) The flow of the space varied more than I expected.  The two set-ups below which had a separate entrance and exit clearly worked better than the three that had a single entrance.  (I didn’t choose the precincts for this reason, but notice that the best rooms for traffic flow were the ones that only had one precinct; the three polling places with a single entrance/exit also had two precincts, which only compounded the amount of jumbled traffic.)

(4)  Not shown here:  the gaggle of a dozen reporters/campaign workers who swarmed into “Precinct 1” right as polls closed, looking to get the results as soon as they were printed off the scanner.  As far as they were concerned, this was party time.  They seemed little concerned that the poll workers were trying to do the very exacting task of checking their work and closing the precinct in an orderly fashion.  I can only imagine what the campaigns would have said/done if the precinct workers had gotten something wrong in the close-up — but, it’s not like their representatives on site were really concerned about the fact that the poll workers still had a job to do.

Here are the sketches.  Click on them to get a bigger view.

Slide1 Slide2 Slide3 Slide4 Slide5

Colorado recall

It seems that there will be recall elections in Colorado soon, according to reports in the news (“Facing a Recall After Supporting Stronger Gun Laws in Colorado”).

That reminded me of a post I wrote back in 2011, when recall elections in Wisconsin were in the news. That post was about the research that was done in the aftermath of the 2003 gubernatorial recall in California, which is quite relevant today for anyone interested in what political scientists have found when they have studied recall elections.