As I get ready to analyze the results of the upcoming runoff in GA06, I asked my research associate, Jacob Coblentz, to produce a graph to summarize how the precinct returns from the April primary compared to the November presidential returns. Below is the result.
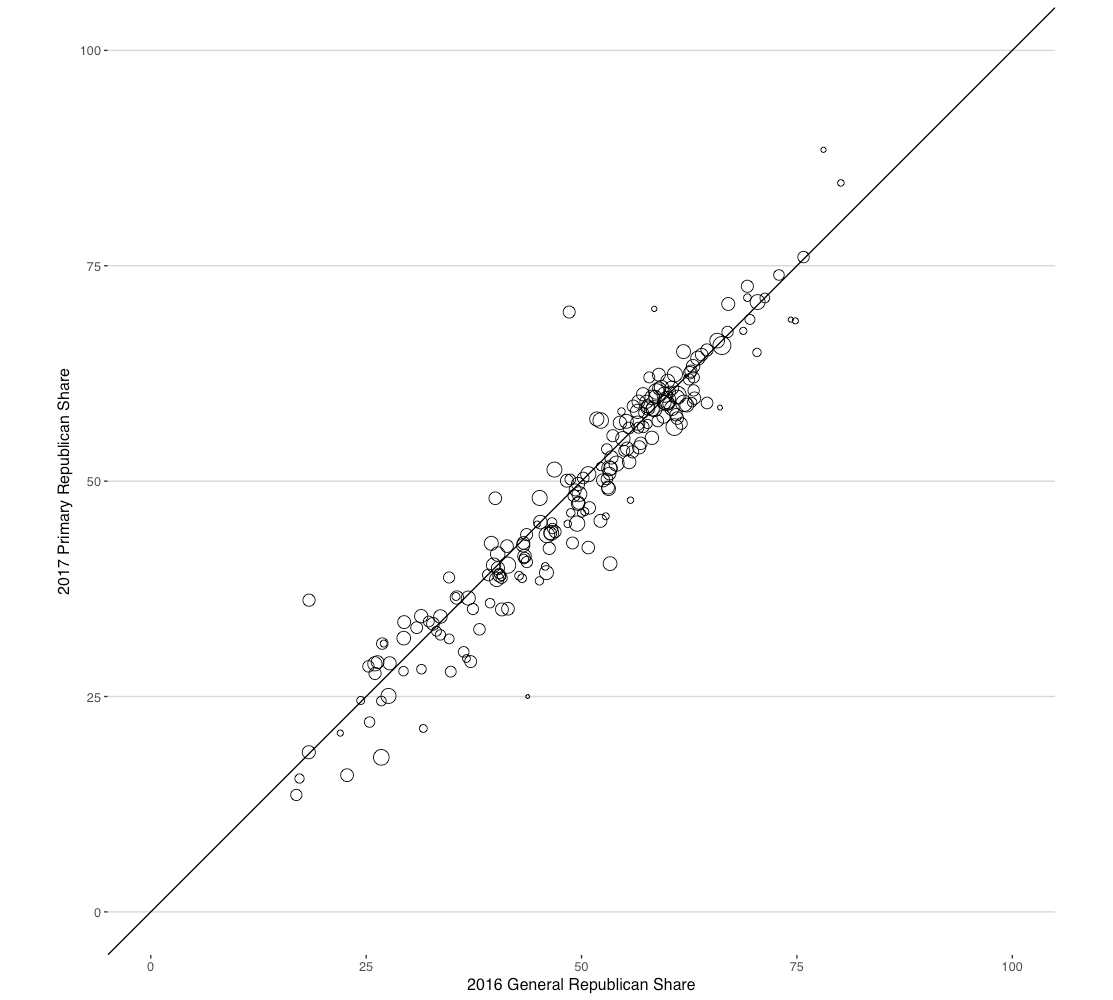
The y-axis is the percentage of the two-party vote received by all the Republican candidates in the primary and the x-axis is the percentage of the two-party vote received by Trump. The solid line is the 45-degree line.
In the 2016 general election, 50.3% of the two-party vote in the district went to Trump. In the primary, 50.9% of the two-party vote went to one of the Republican candidates. To play Captain Obvious here, no wonder this is a nail-biter, and no wonder an Ossoff victory would be quite an accomplishment. A deeper dive into the data shows that primary turnout sagged more in the precincts that showed the strongest support for Clinton in November, compared to the sag in precincts that supported Trump the most. Thus, it’s also no surprise that this has become a contest of turnout.