The most surprising result of last week’s Virginia election was the dramatic gain in Democratic seats in the lower chamber of the state legislature, the House of Delegates (HOD). Democrats improved their situation, rising to a likely 49 seats (pending recounts) in the 100-seat chamber, from a lowly 34.
Why this big surge in Democratic fortunes? If we compare last week’s results with 2015 and 2017, two dynamics stand out:
- Democratic candidates of all sorts won more votes in 2017 than in 2013 or 2015.
- The increase in Democratic votes was targeted in purple HOD districts.
In other words, Democrats did better in most of the state, but especially in Purple Virginia.
To demonstrate the fact, it’s impossible to use votes received by HOD candidates, because there have been so many uncontested races in recent years. Instead, it’s necessary to use votes received by partisan candidates at the top of the ticket, that is, candidates who were on the ballot even when the HOD race was uncontested.
In particular, it is possible to take the votes for governor that were cast in a HOD district and use those votes as a proxy for the partisan leanings of the district. That’s a fine thing to do for 2017, but there was no gubernatorial race in Virginia in 2015. As a consequence, it’s impossible to use the method I will employ in this post to compare 2017 with 2015.
Instead, I will compare 2017 with 2013. Luckily, HOD outcomes were nearly identical in 2013 and 2015 — Democrats won 33 seats in 2013 and 34 in 2015.
Let me take the two dynamics identified above in order.
Democratic candidates of all sorts won more votes in 2017 than in 2013.
For starters, Ralph Northam won 54.5% of the two-party vote, compared to 51.4% for Terry McAuliffe in 2013. If we include minor party and write-in candidates in the denominator, these percentages are 53.9% and 47.8%, respectively. Thus, statewide, the Democratic swing from 2013 to 2017 was either 3.4 points or 6.1 points, depending on which denominator you use.
One fast-and-dirty way to gauge the effect of this swing on the HOD election results, is to count up the races in 2013 in which the Republican victory margin was less than the 2013-2017 swing. If the 2013-2017 swing was uniform across districts (more on this below), then these are the districts most likely to have been flipped by the change in Democrats’ fortunes.
Using the two-party vote share, 7 Democrats lost by less than 3.4 percentage points in 2013; using the swing that includes all candidates’ votes, 8 Democratic candidates lost by less than 6.1 points. Thus, around 8 seats probably flipped to the Democrats in 2017 simply because of the statewide swing in votes. Of course, this is only half the likely 16-seat swing overall from 2013 to 2017.
It is important to note that the analysis I just performed didn’t take into account uncontested seats in 2013. In that year, 33 Republicans won without facing Democratic opposition. This year, 27 of those districts had Democratic competition. Democrats won three of those districts.
In contrast, 24 Democrats ran unopposed in 2013. Only 3 of these districts had a Republican candidate in 2017, one of whom won.
Thus, on net, the conversion of previously uncontested seats into contested ones added a couple of seats to the Democratic wave in 2017.
The increase in Democratic votes was targeted in purple HOD districts
In noting that Democrats enjoyed a 3.4 point two-party swing from 2013 to 2017, it is tempting to suppose that these 3.4 points were distributed uniformly throughout the state. However, the swing was anything but uniform.
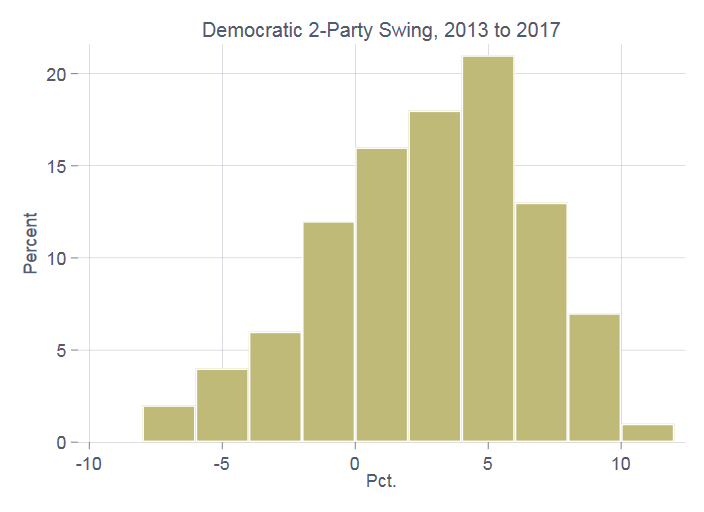 Looking again at the gubernatorial votes allocated to HOD districts, the swing ranged from a gain of 10.3 percentage points in the 40th district (Northern Virginia) to a loss of 7.1 percentage points in the 3rd (southwest Virginia). The accompanying figure shows the entire distribution. (Click on the graph to enlarge it.)
As the identification of the two outliers in the previous paragraph suggests, districts experiencing the most extreme swings from 2013 to 2017 were not randomly distributed throughout the state. This is evident in the following plot which shows the 2013–2017 swing graphed against the two-party balance in the 2013 election. There’s a nice curvilinear relationship between the degree of pro-Democratic swing and McAuliffe’s electoral strength in 2013.
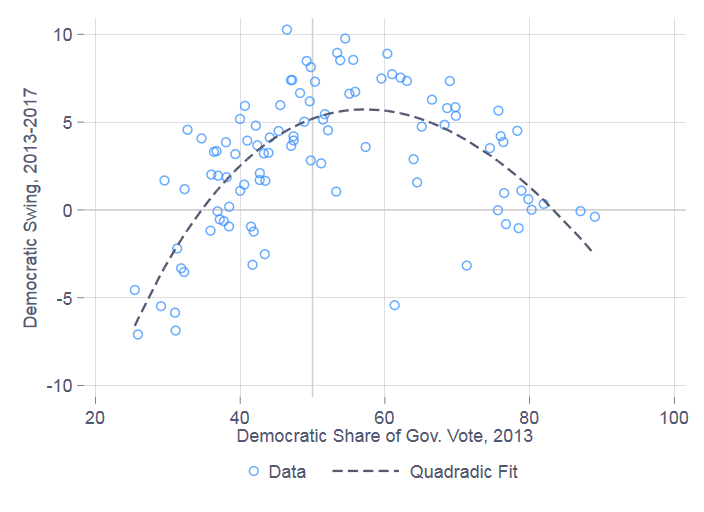
True, there are some outliers, such as in the 75th district, where support for the Democratic gubernatorial candidate fell from 61.4% in 2013 to 55.9% in 2017. And, it does appear that the swing was asymmetrical, to the degree that the purple districts on the Democratic side of the ledger saw a greater pro-Democratic swing than the purple districts that leaned red.
Still, on the whole, the pro-Democratic swing also tended to occur in the districts where it helped Democratic HOD candidates the most.
To help quantify the significance of this observation, let’s compare purple districts with the rest of the state. I will define a purple district as one that gave McAuliffe a vote share in the 40%–60% range in 2013.
All told, 22 districts fell in this competitive range, only 3 of which elected a Democrat in 2013, 17 of which elected a Democrat in 2017.
Of the remaining 78 districts in either deep Blue or Red Virginia, 30 elected a Democrat in 2013, 32 in 2017.
Thus, what really mattered was not so much the overall shift in Democratic fortunes in 2013, but where that shift occurred.
One remaining detail
There’s one final detail about this improvement in Democrats’ fortunes in purple districts that bears mentioning. Not only did the Democratic percentage of the vote increase the most in purple districts, overall turnout did, as well. In the purple districts just discussed, turnout increased by 29.4% in 2013 compared to 2017. In the rest of the state, turnout increased by 21.3%.
There are two possible explanations for this differential in turnout increase — which, to remind us, is measured using the number of votes for governor, not HOD candidates. The first is that areas that saw the biggest surge for Democrats are the fastest-growing areas of the state. The second is that there was greater mobilization among Democrats in districts that had a chance to contribute to a flipping of the House of Delegates. It’s likely a combination of both factors.
Adjudicating between the two sources of this differential turnout increase must await population data that won’t be available for several years. Either explanation is consistent with what many people know, which is that Virginia’s politics continue to be pulled in a new direction.