Ned Foley alerted the world to the “blue shift” that has begun to characterize the trends in vote totals after the initial tranche of results are released on election night. The blue shift is the tendency for presidential vote results to trend in a Democratic direction as the count proceeds from ballots counted on Election Day to ballots counted during the canvass period — both absentee and provisional ballots.
For instance, in 2016, the nationwide election-night returns had Clinton leading Trump 48.14% to 47.12%, or by 1.02 points among the 124.2 million votes accounted for on Election Day. By the time all the votes were counted in all the states, Clinton ended up leading 48.02% to 45.93%, or 2.09 points, among the 137.1 million votes eventually counted. The growth in Clinton’s lead was a blue shift of 1.07 points (i.e., 2.09-1.02).
(The election night totals are taken from the New York Times. The final canvass totals are taken from Dave Leip’s Atlas of U.S. Presidential Elections.)
California is one of the biggest contributors to the nationwide blue shift — although there is a blue shift of some size in most states — because of the large number of provisional and mail ballots in the Golden State. Although 14.2 million votes were eventually counted in California, only 8.8 million were accounted for on election night. In the process, Clinton’s lead grew from 61.49%-33.22% to 61.48%-31.49%, for a blue shift of 1.72 points.
It’s not surprising, therefore, that a significant blue shift showed up in California’s recent top-two primary. Let’s take a look.
The good students working for the MIT Election Data and Science Lab downloaded the election night returns from California and stashed them on our Github depository (where anyone can access them). This means we can compare the early returns with the final results published by the state, which are available here.![]()
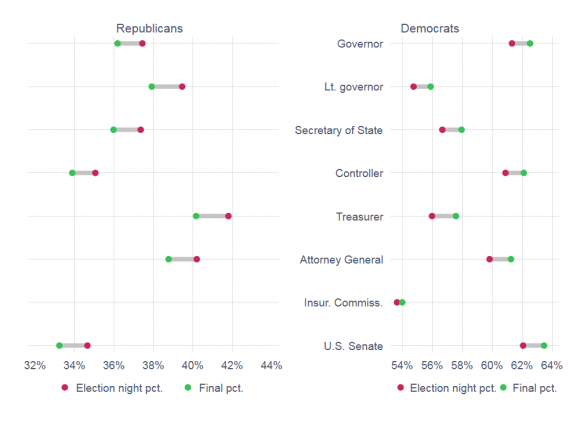
 The accompanying graph helps to illustrate the magnitude of the blue shift for each of the statewide races with party labels on the ballot. (Click on the graph to biggify it.) In every race except insurance commissioner, Democratic-affiliated candidates as a whole saw their share of the votes grow by over a point, whereas the Republican-affiliated candidates saw their aggregate vote shares shrink by more than a point.
In the gubernatorial primary, for instance, all the Democratic candidates added together accounted for 61.31% of the primary votes cast, compared to 37.43% for the Republicans, a 23.88-point lead. In the final count, Democratic candidates received 62.51% of all the votes counted, compared to 36.17% for the Republicans, causing the lead to grow to 26.34 points. The blue shift in this case was 2.46 points.
It should be noted that the partisan shfits associated with the minor-party and no-party candidates did not go systematically one way or the other. The only non-major-party candidate who was a factor in any of the primaries was Steve Poizner, the former insurance commissioner, who ran without a party label to get his old job back. In this one race, the two Democrats in the contest gained very little percentage-wise as the count progressed, and Poizner lost very little.
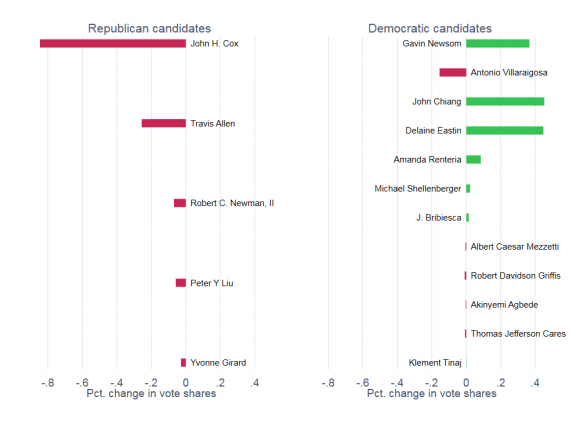
 The aggregate blue shifts seen among Democratic and Republican candidates are clear, but do they benefit all candidates equally? Not really. To see this, take a look at the change in the vote shares enjoyed by all the Democratic and Republican candidates on the gubernatorial primary. (Click on the graph to enlargify it.) For both the Republican and Democratic candidates, I have shown the magnitude of the shift in the vote share from election night to the final canvass. The candidates are displayed with the top election-night vote-getter from each party at the top, and then the other candidates down below in the order of their votes.
All Republicans lost vote share during the canvass, with John Cox, who came in second overall, losing the most — nearly a full point. Of course, he was far ahead of Travis Allen (and also Antonio Villaraigosa, the second-place Democrat), so he had plenty to lose. Indeed, since he was the only Republican candidate whose vote share was in the double digits, it’s not surprising that virtually all of the down-side of the blue shift was heaped on him.
Most of the top-ranked Democrats gained vote share as counting progressed. The exception at the top was Villaraigosa, who lost 0.16 points from election night to the final canvass. Why he was along among the top vote-getters in losing vote share, I will leave to others to figure out.
California is not alone in having a lot of ballots left to count after election night, but it is by far the largest state with so much to do in the days after an election. With California a deep blue state, its healthy blue shift has not really been much of a factor in national elections. This might change in November. I haven’t yet drilled down to analyze the magnitude of the blue shift in California’s congresisonal primaries, but I suspect the patterns are similar to what we see at the state level. If so, then a blue shift of a point or two in those elections in November could not only have state significance, but could be a factor as we seek an answer to the question of whether the Democrats will gain control of the U.S. House.