Charles Stewart III
I’ve been working on estimates about the number of mail ballots and early ballots we can expect in the battleground states where the Healthy Elections Project has been surveying about voter intentions. I’ve published estimates for North Carolina and Wisconsin, and should have estimates for Michigan, Pennsylvania, Arizona, Florida, and Ohio shortly.
In hindsight, there’s at least one battleground state where I wish I had been surveying in, and that’s Georgia. However, there is some other data available we can use, from the Voter Study Group, which can help provide some guidance to where things will be going.
Before jumping in, let me give the spoiler alert. The survey research I have seen that has asked Georgians how they plan to vote–early, by mail, or on Election Day–seems to be under-predicting early voting turnout and over-predicting how many will cast votes by mail. Whether Election Day ends up being relatively quiet, with voters siphoned off to early and absentee voting, or busy, with historic turnout rates continuing through to November 3, depends on what your model of the turnout level is.
First, as to the intentions themselves. According to the VSG’s October 23 update, utilizing data from August 27 to October 21, 30% of Georgians plan to vote in person on Election Day, 36% early, 32% by mail, and 2% don’t know. Following the convention in my other analyses, I omit the “don’t knows,” leaving us with 30.6% on Election Day, 36.7% early, 32.7% by mail,
Second, to convert these expectations to raw numbers, we need an estimate of turnout. I’ve done this in two ways. The first is just to assume that turnout is 10% above 2016 (4,165,405), which would place it at 4.6 million. The second uses a very simple linear regression to predict the log of turnout in terms of the log of registered voters in the most recent six presidential elections, and then extrapolating based on the coefficients derived from that regression. This gives us an estimated turnout of 6.0 million.
Yes, I know this is a huge range. What makes Georgia’s turnout rate tricky to estimate, using the registration rate, is that its adoption of automatic voter registration has caused its registration numbers to balloon since 2016. The regression estimate assumes that turnout of registered voters who would not have been registered except for AVR is the same as those who would have registered otherwise. That seems unlikely, but for now, I’m sticking with the high estimate, simply because it’s probably better under these circumstances to over-estimate turnout than under-estimate it.
Third, here is what the combination of numbers above imply for the final distribution of votes in Georgia, by mode:
|
|
Vote Mode |
||
|
Assumed turnout |
Election Day |
Early |
|
|
4.6 million |
1.408M |
1.688M |
1.504M |
|
6.0 million |
1.836M |
2.202M |
1.962M |
Fourth, a final calculation needs to be made, if we want to estimate the number of mail ballots that will be requested, since not all mail ballots are returned. The return rate of mail ballots in the 2016 general election was 88%. If that holds for the general election in Georgia, it should expect between 1.7 and 2.2 million mail ballots to be requested.
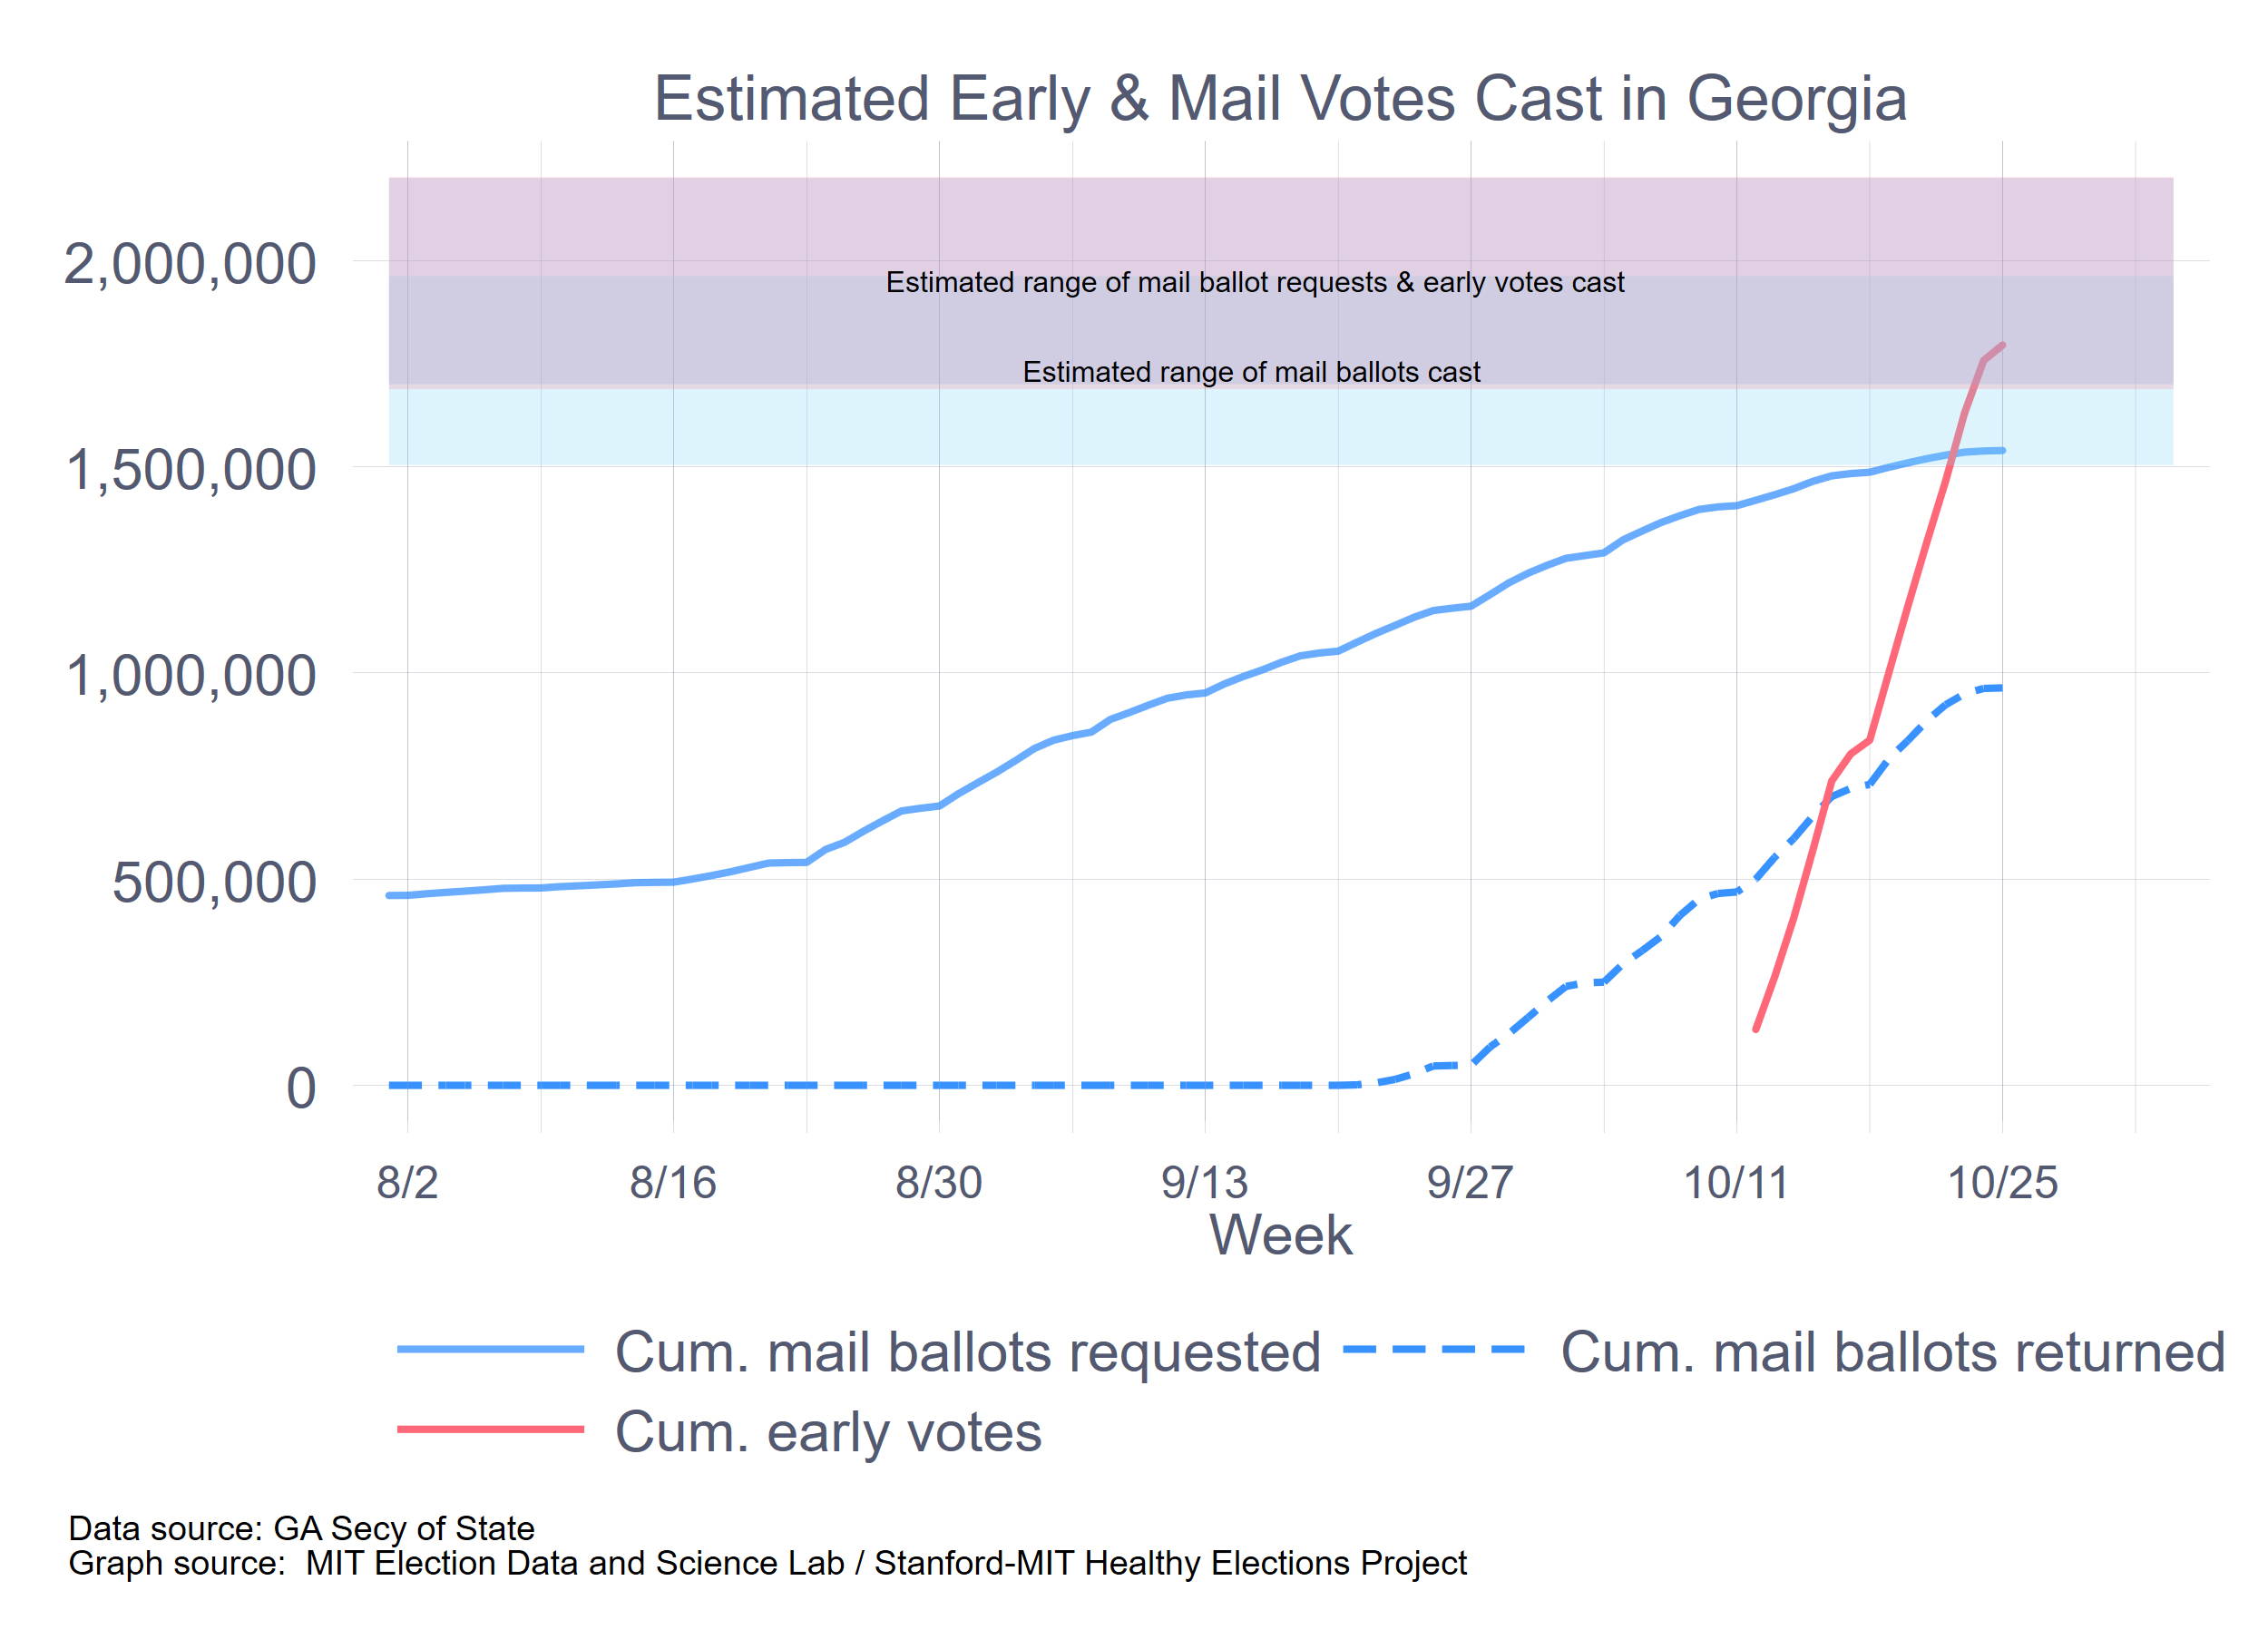
As of yesterday (October 25), 1,539,302 mail ballots have been requested. Last week saw an average of 7,700 new mail requests each day. If that is the pace of requests in the coming week (the deadline for submitting an absentee request is Friday), Georgia won’t even see 1.6 million requests for mail ballots. In other words, it appears that Georgia will under-shoot even the low-ball estimate.
If requests appear to be coming in below the estimate, then the number of mail ballots requested are likely to, as well. As of yesterday, 963,616 ballots had been returned. To reach the low end of the estimated range of absentee ballots, Georgia would need to see about 79,000 ballots returned each business day between now and November 3. That would be nearly double the pace of past week. This is not out of the range of the possible, but it would still put Georgia on a track for 1.5 million mail ballots cast, which is right at the low end of estimates, assuming the survey results are correct and Georgia gets turnout of 4.6 million.
The big story is early voting, and here the pace exceeds poll-based expectations. As of yesterday, over 1,792,000 early votes had been cast, which means that it has already pierced the low-end estimate of 1,688,000. For the past week, Georgia has been averaging nearly 135,000 early votes a day. With five more days left for early voting, that pace would add another 675,000 voters, pegging total early voting turnout at around 2,467,000, which is well above the high-end estimate of 2.2 million.

However, there’s every reason to believe that the pace of early voting will accelerate even further next week. This expectation is based on the pattern of early voting thus far, which is illustrated by the accompanying graph, which compares daily early voting numbers for 2016 and 2020. (Click on the graph to enbiggen.) Weekday early voting volumes have ranged from 29% to 70% higher than the comparable day in 2016. Furthermore, early voting picked up the pace in the final week before the election in 2016, crescendoing to a quarter million on the last day.
If we assume that daily early voting turnout will continue running about 40% above last year’s pace, as it did last week, then Georgia is on a path to add an additional 1.4 million early votes by the end of this week. Combined with the 1,792,000 early votes already in the ballot boxes, we could see around 3.2 million early votes cast in Georgia when it is all over.
All told, it is looking like Georgia is on a path to see 3.7 million advanced votes this cycle, 1.5 million by mail and 3.2 million early in person. (In contrast, it saw nearly 2.4 million advance votes in 2016, with total turnout at near 4.2 million.)
The following graph summarizes these estimates.
Where does this leave Election Day itself?
This is where the turnout estimate really matters. Simply assuming that turnout is 10% above 2016—in other words, slightly above population growth—gives us a turnout estimate of 4.6 million, leaving only 900,000 voters for Election Day. The regression-based estimate of 6.0 million leaves a much larger number, 2.3 million. For context, nearly 1.8 million cast Election Day votes in 2016.
Although we do not know what total turnout will be, nor how many early and mail ballots will be cast next week, it already seems obvious that the Voter Study Group estimates are off by quite a lot. Those estimates are consistent with the volume of early votes being only about 10% greater than the volume of mail votes. But, the trajectories are currently putting early votes at twice the rate of mail votes. This is no particular dig at the Voter Study Group, whose results are entirely consistent with other polling that has been shared with me in confidence.
Nor does this appear to be simply a matter of voters intending to vote by mail and then switching to in-person early voting. Thus far, around 10% of early voters are recorded as having previously requested a mail ballot. It’s certainly true that if we reallocate 10% of the estimated early voters to the mail ballot group, the early/absentee voting gap closes, but the relative dominance of early voting would still be roughly a factor of two, rather than parity.
This is a puzzle to be resolved by the researchers after the election. Where does it leave the state, as it plans for the next eight days? First, it seems obvious that the state needs to brace for even greater early voting volume this coming week. Second, it also seems that the state cannot be complacent about Election Day. The cruel reality this year is that we won’t know if this is a high turnout election, or a high HIGH turnout election until the polls close on November 3.