Author Archives: Michael Alvarez

Questions about postal voting

Since the origins of the Caltech/MIT Voting Technology Project in 2000, the VTP has noted a number of concerns about postal voting. Our original report in 2001 noted that postal voting represents clear tradeoffs, with benefits including convenience, but with potential risks, especially regarding the reliability and security of balloting by mail.

Our most recent report reiterated these same concerns, but added another, as there is new research indicating that many of the reductions in residual votes (a key measure of voting system reliability and accuracy) are at risk because of the increase in postal voting. One of these papers studies residual votes in California (“Voting Technology, Vote-by-Mail, and Residual Votes in California, 1990-2010”). The other is a national-level study, “Losing Votes by Mail.” There is an important signal in the residual vote data from recent elections, increased postal voting is associated with increased residual votes.

Now comes word of a new concern about the reliability of postal voting. Upcoming Austrian elections might be postponed due to faulty glue used in the ballot envelopes. This video helps explain the problem.

While we’ve raised questions in the past about the reliability of the mail system for balloting (in particular, noting that there’s always a risk that balloting materials might be delayed or misdirected, especially for overseas and military voters covered by the UOCAVA and MOVE Acts), a basic malfunction of postal voting material is not an issue that we’ve heard much of in the past. But clearly it may be an issue in the future, so researchers will need to keep an eye on what is learned from this Austrian postal ballot problem, how it it resolved, and determine how to prevent problems like these from happening.

California’s massive 2016 voter guide

I’m glad that I recently had a large and sturdy mailbox installed at the end of our driveway. Our previous mailbox was small, rusty, and was starting to lean to one side — had the mail carrier tried to leave California’s massive, 224-page, 2016 general election voter information guide in our old mailbox, I have no doubt it would have immediately toppled over.

The LA Times has a fun video that shows the printing of this super-sized voter information guide:
http://www.latimes.com/la-pol-vn-printing-the-california-voter-information-guide-2-20160909-premiumvideo.html

Don’t get me wrong, I think that it’s great that California voters receive the voter information guide from our Secretary of State (it’s available online in pdf format as well, which might be more easily usable for many voters). The information guide helps remind voters about the upcoming election, it provides useful information about voter rights and resources about registration and voting, and it also gives lots and lots of detailed information about all of the ballot measures that we will have on our ballots in California this fall.

But with seventeen statewide measures on the ballot (this does not include county or local measures), the information guide is a bit intimidating this election season. Californians are being asked to provide their input into a wide range of statewide issues, including fiscal matters like school and revenue bonds, tax extensions and new taxes, the death penalty, and marijuana legalization. These are important issues, and this fall voters will need to take a close look at the voter information guide to get a better understanding of these issues and to figure out how to cast their ballots.

With so many issues on the ballot, and with a lot of important candidate races (a presidential race, the U.S. Senate contest, and lots of competitive congressional and state legislative races), it’s a long ballot. Combine the long ballot with a lot of interest in this election, there’s a good chance we will see strong turnout through the state this fall, which even with widespread voting by mail will likely mean long waits at polling places on election day.

In any case, Californians should be on the lookout for their massive voter information guide in their mailboxes, or take a look at the online version. Just make sure that you have a sturdy mailbox, and don’t drop it on your toes when your copy arrives soon.

Estimating Turnout with Self-Reported Survey Data

There’s long been a debate about the accuracy of voter participation estimates that use self-reported survey data. The seminal research paper on this topic, by Rosenstone and Wolfinger, was published in 1978 (available here for those of you with JSTOR access). They pointed out a methodological problem in the Current Population Survey data they used in their early and important analysis: there seemed to be more people in the survey reporting that they voted, than likely voted in the federal elections they studied.

In the years since the publication of Rosenstone and Wolfinger’s paper, there’s been a lot of debate among academic researchers about this apparent misreporting of turnout in survey self-reports of behavior, much more than I can easily summarize here. But many survey researchers have been using “voter validation” to try to alleviate these potential biases in their survey data, which involves matching survey respondents who say they voted to administrative voter history record (after the election); this approach has been used in many large-scale academic surveys of political behavior, including many of the American National Election Studies.

In an important new study, recently published in Public Opinion Quarterly, Berent, Krosnick and Lupia, set out to test the validation of self-reports of turnout against post-election voter history data. Their paper, “Measuring Voter Registration and Turnout in Surveys: Do Official Government Records Yield More Accurate Assessments”, is one that people interested in studying voter turnout using survey data should read. Here’s the important results from their paper’s abstract:

We explore the viability of turnout validation efforts. We find that several apparently viable methods of matching survey respondents to government records severely underestimate the proportion of Americans who were registered to vote. Matching errors that severely underestimate registration rates also drive down “validated” turnout estimates. As a result, when “validated” turnout estimates appear to be more accurate than self-reports because they produce lower turnout estimates, the apparent accuracy is likely an illusion. Also, among respondents whose self-reports can be validated against government records, the accuracy of self-reports is extremely high. This would not occur if lying was the primary explanation for differences between reported and official turnout rates.

This is an important paper, which deserves close attention. As it is questioning one of the common means of trying to validate self-reported turnout, not only do we need additional research to confirm their results, we need new research to better understand how we can best adjust self-reported survey participation to get the most accurate turnout estimate that we can, using survey data.

Estimating racial and ethnic identity from voting history data

Researchers who have participated in redistricting efforts, or who for other reasons have used voter history files in their work, know how difficult it is to estimate a voter’s racial and ethnic identity from these data. These files typically contain a voter’s name, date of birth, address, date of registration, and their participation in recent elections. The usual approach that many have take to estimate each voter’s racial or ethnic identity has been to use “surname dictionaries” which will classify many of the last names in a voter history file to many racial or ethnic groups.

The obvious problem is that with an increasingly diverse society, this surname matching procedure may be less and less accurate. The surnames of many Americans are no longer necessarily accurate for estimating racial or ethnic identity.

Charles recently wrote about one recent paper in Political Analysis on this topic, by Kosuke Imai and Kabir Khanna, “Improving Ecological Inference by Predicting Individual Ethnicity from Voter Registration Records”. Charles provided an excellent summary of this article, but I’d like to point out to readers that the Imai and Khanna article is now available for free reading online, so check it out asap!

The the other recent article in Political Analysis on this question is by J. Andrew Harris, “What’s in a Name? A Method for Extracting Information about Ethnicity from Names.” Here’s Harris’s abstract:

Questions about racial or ethnic group identity feature centrally in many social science theories, but detailed data on ethnic composition are often difficult to obtain, out of date, or otherwise unavailable. The proliferation of publicly available geocoded person names provides one potential source of such data—if researchers can effectively link names and group identity. This article examines that linkage and presents a methodology for estimating local ethnic or racial composition using the relationship between group membership and person names. Common approaches for linking names and identity groups perform poorly when estimating group proportions. I have developed a new method for estimating racial or ethnic composition from names which requires no classification of individual names. This method provides more accurate estimates than the standard approach and works in any context where person names contain information about group membership. Illustrations from two very different contexts are provided: the United States and the Republic of Kenya.

Harris’s paper is open access, which means it’s also freely available for people to read online.

There’s a lot of interesting research going on in how to use these types of administrative datasets for innovative research; I encourage readers to take a look at both papers, and I’d also like to note that the code and data for both papers are available on the Political Analysis Dataverse.

VTP report: The Voting Technology Project: Looking Back, Looking Ahead”

The Caltech/MIT Voting Technology Project has recently released the first of a series of reports for the 2016 U.S. presidential election. This report, “The Voting Technology Project: Looking Back, Looking Ahead” outlines the history of the Caltech/MIT Voting Technology Project (VTP), and discusses some of the issues and states where the VTP will be focusing their collective research activities for this fall’s election.

As this report discusses, the VTP was formed immediately after the 2000 presidential election. In particular, the project was established to study the problems associated with voting technologies in that election, and to propose solutions for those technological problems before the next presidential election in 2004. To assess the problems with voting technology in 2000, the VTP was constituted as a bicoastal, interdisciplinary research group.

While studying the issues with voting technology in the 2000 presidential election was our initial focus, the team quickly figured out that voting technologies were not the only issues plaguing U.S. elections: our studies revealed that significant numbers of votes were lost in the 2000 presidential election to problems other than bad voting technology. The non-technological issues that the VTP identified were voter registration, absentee voting, and problems with polling place practices.

The VTP issued our first major research studies in June and July 2001 — fifteen years ago! The first of those studies examined the reliability of existing voting technologies, using the residual votes metric; the second study took a broader focus, and used the lost votes measure to compare the problems of voting technology to those associated with other aspects of the election process in the U.S. Both of these 2001 studies were significant: they were widely read by policymakers, election officials, other academics, and the interested public. These studies played important roles in the development of federal, state, and local election reform efforts after 2001, including the Help America Vote Act. These studies also laid the foundation for the development of a surge of interest in the study of election administration and voting technology by academics, which fifteen years later has grown to include researchers across the globe, who jointly have produced many important books and articles on voter registration, voter identification, absentee voting, voting technology, polling place practices, and election administration.

Fifteen years later, the VTP continues to carry out ambitious and important research on voting technology and election administration. As a project, we have released a number of important policy reports since 2001, we have published our research widely, we have helped election officials and policymakers across the globe improve their voting technology and election administration practices, we have trained many students in the science of elections, and we have collaborated widely with researchers at many other colleges and universities.

As this new report discusses, going into the 2016 November general elections in the U.S., the VTP will be focusing on many of the same issues which have received our attention in the past (ironically, in some of the same states where we have focused our studies in past elections). Our efforts will involve the study of how to improve polling place practices, in particular the elimination of long lines at polling places on Election Day. We will continue our studies of voter identification and authentication procedures, and how new technologies might allow for accurate identification without disenfranchisement. The VTP will be looking closely at the performance of old and new voting technologies that will be used this fall. Finally, we will also be studying voting-by-mail and early voting in the states which widely use those convenience voting options. We’ll provide additional reports about those studies as the election season progresses, and issue post-election evaluations when we have results to share with our colleagues and readers.

The 2000 presidential election was unique, and the combination of problematic voting technologies with a very close election focused the attention of the world on how American elections are conducted. The good news is that much has improved in the conduct of federal elections in the U.S. since 2000, and the research community now has metrics and methods to study election performance well.

However, in battleground states, where the presidential election will be fought, it’s likely that attention will again focus on administrative and technological issues in November 2016, especially if none of the presidential candidates can easily claim an Electoral College victory the evening of November 8, 2016. We hope that the release of this report, and the others that we will published between now and Election Day, will help minimize the number of votes that are lost in the electoral process.

Media exit polls, election analytics, and conspiracy theories

The integrity of elections is a primary concern in a democratic society. One of the most important developments in the study of elections in recent decades has been the rapid development of tools and methods for evaluation of elections, most specifically, what many call “election forensics.” I and a number of my colleagues have written extensively on election evaluation and forensics; I refer interested readers to the book that Lonna Atkeson, Thad Hall, and I wrote, Evaluating Elections, and to the book that I edited with Thad and Susan Hyde, Election Fraud.

One question that continues to arise concerns whether observed differences between election results and media exit polls is evidence of electoral manipulation or election fraud. These questions have been raised in a number of recent U.S. presidential elections, and have come up again in the recent presidential primary elections in the U.S. In a recent piece in the New York Times, Nate Cohn wrote about these claims, and why we should be cautious in the use of media exit polls to detect election fraud. Each of the points that Cohn makes is valid and important, so this is an article worth reading closely.

I’d add to Cohn’s arguments, and note that while media exit polls have clear weaknesses as the sole forensic tool for determining the integrity of an election, we have a wide variety of other tools and methods to use in situations where there are questions raised about an election.
As Lonna, Thad and I wrote in Evaluating Elections, a good post-election study of an election’s integrity should involve a variety of data sources and multiple methods: including surveys and polls, post-election audits, and forensic analysis of disaggregated election returns. Each analytic approach has it’s strengths and weaknesses (media exit polls included), so by approaching the study of election integrity using as many data sources and different methods as we can, we can best locate where we might want to launch further investigation of potential problems in an election.

I have no doubt that we will hear more about the use of exit polls to evaluate the integrity of the presidential election this fall. Keep in mind Cohn’s cautionary points about using exit polls for this purpose, and also keep in mind that there are many other ways to evaluate the integrity of an election that have been tested and used in past elections. Media exit polls aren’t a great forensic tool, as Cohn argues: the types of exit polls that the news media uses to make inferences about voting behavior are not designed to detect election fraud or manipulation. Rather, those interested in a detailed examination of an election’s integrity should instead use the full array of analytic forensic tools that have been developed and tested in the research literature.

California’s 2016 Primary Election: Lessons Learned?

I headed to my local polling place this morning at about 8am, which this election was in our neighborhood firestation. I have to confess, I had quite feeling of deja vu this morning, having again experienced and seen many of the same things that I’ve seen in the hundreds of polling places I’ve visited in my time associated with the Caltech/MIT Voting Technology Project (since the 2000 presidential election).

First, good and bad news. The good news is that my polling place was busy this morning; the bad news was that meant that parking wasn’t straightforward (I had to circle the block to find street parking, a typical problem regarding polling places in densely-populated urban areas). I also had to wait a bit, it took me about 3-4 minutes to check in an to then get my ballot, and then I had to wait for just over 5 minutes to be able to use a ballot booth with an Inkavote device (I’m an LA County voter). Part of my wait time, of course, arose because one voter cut in front of the folks waiting in line (which generated some irritation).

But based on what I saw this morning, I’m betting that turnout in today’s California primary election will be higher than seen in recent statewide primary elections.

Second, there was again the same confusion we’ve seen in polling places in previous elections regarding the rules of the top-two primary, which admittedly are complex. Some non-party-preference voters don’t understand that they can request the party ballot for only some parties, and at least one person who seemed to be a registered Green party voter was vocal in their irritation at not being able to vote for Sanders. There was also confusion in the minds of some voters about which ballot booths to use, because they needed to use a specific vote recorder (and thus a specific party booth) in this election.

Third, one of the two Inkavote ballot scanners seemed to be having some problems; when I arrived, there was some sort of commotion regarding one of the two ballot scanners, with three poll workers trying to figure out why a voter was having some sort of problem scanning their ballot. Whether that was resolved or not was hard for me to tell, as it wasn’t the scanner associated with my voting precinct.

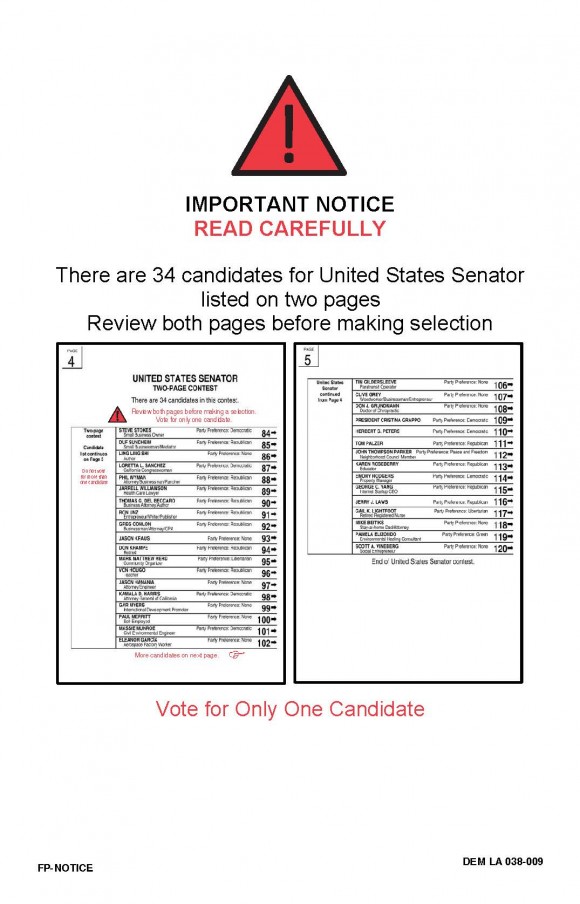
Fourth, as I had written about earlier, the ballot for the U.S. Senate race was confusing. The ballot had a warning page about the ballot design, and while I think that it was about as well laid out as possible for the InkaVote system, it was confusing. I’m hypothesizing that once the election is over and we have data to study, we are likely to see a higher-than-expected residual vote (caused by overvoting) with respect to this race.

So a mixed evaluation. Clearly, since 2000 academics and election officials have learned a lot about how to study and conduct elections. But it’s also somewhat frustrating to see the same issues cropping up again, with not terribly accessible polling locations, lines, voter confusion about the rules of the election, potential problems with ballot designs, and seemingly glitchy voting technologies. In general, it all seemed a bit more chaotic than necessary. Hopefully between now and November many of these issues will be mitigated or eliminated, as it’s looking like a contested and controversial general election is heading our way.

Computational Social Science and Election Administration

I recently edited a volume for Cambridge University Press, Computational Social Science: Discovery and Prediction. A summary of the book, and some ideas about new directions for this evolving field, is in a blog post that was just published on the CUP’s blog (fifteeneightyfour), “Computational Social Sciences: Advances and Innovation in Research Methods.”

computational-social-science-615x290

There’s a lot in this book that will be of interest to readers of this blog. Contributions include essays by Ines Levin, Julia Pomares and I on using machine learning techniques to detect election fraud; papers on how to use big data tools to improve government policymaking (Price and Gelman, and Griepentrog et al.); and chapters on a variety of new tools for analyzing text data, networks, and high-dimensional data.

Here we go again? Ballot design and the June California primary

Political observers will remember the 2003 California gubernatorial recall election, where 135 candidates ran in the election to replace Governor Davis. Rod Kiewiet and I wrote about how this complex election produced difficult decision problems for voters, and in a different paper (with Goodrich, Kiewiet, Hall and Sled) I also wrote about how the complexity of the recall election posed administrative problems for election officials.

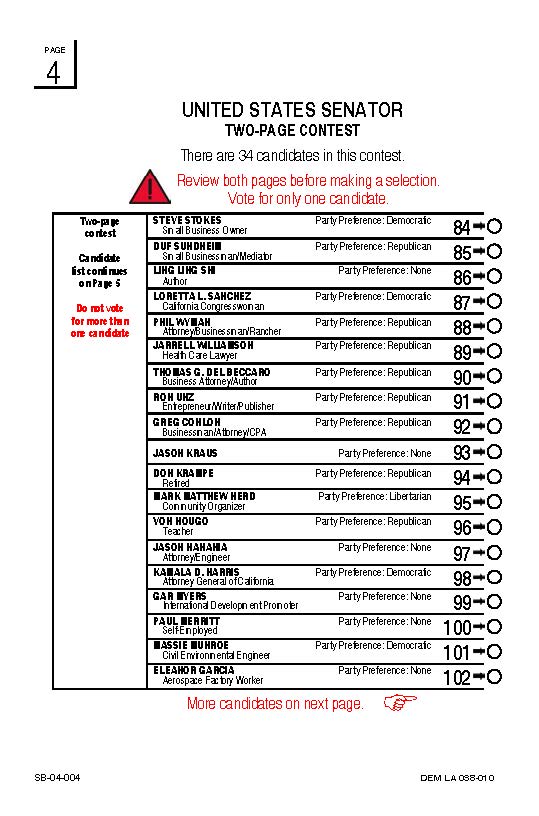
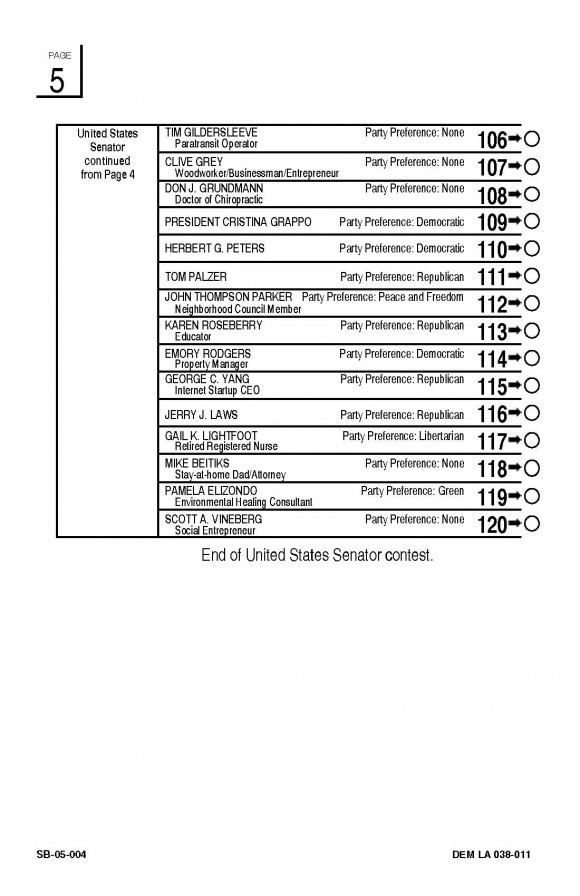
The upcoming June primary in California is shaping up as one where again we have a complicated race, though this time it is for the U.S. Senate. In the primary for the U.S. Senate there are 34 candidates competing to win the primary, and to move on to the general election in November. There have been a few preliminary reports in the media about how the crowded ballot might be problematic for voters when they try to find their candidates in the primary election.

So I took a look at the sample Democratic ballot for Los Angeles County, which is reproduced below. The first page is designed to tell voters that the ballot for the U.S. Senate will have two pages, and it reproduces each page.

sample-ballot_Page_1

The next two pages show what the ballot will look like in L.A. County; in this example, there are 19 candidates listed on the first page, and 15 candidates listed on the second page. The way this ballot is laid out, voters would need to look for their candidate on the first page, and then if they don’t find their candidate listed there, flip to the second page to find their preferred candidate.

sample-ballot_Page_2

sample-ballot_Page_3

This is just an example from L.A. County, which uses a unique voting system (“InkaVote”). While the sample ballot provides ample warnings to voters to only vote for one candidate, and to check both pages for their candidate of choice, there’s a good chance that we’ll see voters make mistakes. In particular, we may see a increased risk of overvotes for the U.S. Senate race, as some voters may not understand that they are only supposed to vote for one candidate (or not see the warnings) and instead may believe they are supposed to make a mark for a candidate on each page. We may also see voters get confused and just skip this race, which might result in an increased rate of undervoting in this election.

As other counties are using different ballot designs and layouts for this race, this is just an example of what might happen in L.A. County. Given the complexity of this ballot and election, there’s a good chance that we might see increased rates of both undervoting and overvoting across the state this June, though the exact causes for that will depend on the specifics of ballot design and layout in each county.

Whether these designs and layouts lead to systematic voter errors of the sort seen in 2000 is not clear at this point, as I’ve not had a chance yet to look at sample ballots from many of the larger counties in the state. However, we do know from research published about the infamous “butterfly ballot” used in Palm Beach County in the 2000 presidential election, even a relatively small number of voter mistakes can be influential in a close election (see the paper by Wand et al. on the butterfly ballot). If the U.S. Senate primary is close in June, we could see some scrutiny of ballot design and layout, and whether problems with design and layout may have led to voter error.

Making sure that California election officials are ready for the upcoming primary

California’s statewide primary is approaching rapidly, and it sounds as if voter interest in the primary is building. This could be an important test of the state’s top-two primary system, and it might the first time that we see strong voter turnout under the top-two. Clearly election officials throughout the state need to be prepared — there might be a lot of last-minute new registrants, a lot of ballots cast by mail, and perhaps many new voters showing up on election day. The LA Times editorialized about this exactly concern, “How do we prevent the California primary from becoming another Arizona?”.