Category Archives: 2016 Election

The plot thickens: Which Florida counties were targeted by hackers?

Earlier this week I wrote about the recent news that hackers may have gained access to election administration systems in at least one Florida county in 2016: see How to avoid an election meltdown in 2020: Improve voter registration database security and monitoring.

Now in the news are reports that may have been two Florida counties where hackers may have gained access to county election administration system in 2016 (see the NYT story, for example, “Russians Hacked Voter Systems in 2 Florida Counties. But Which Ones?”). This has set off a guessing game — which Florida county election administration systems might have been breached in 2016, and what where the consequences?

I’d like to return attention, though, to what I think is the most important issue here. It’s not whether one or two county systems were breached in 2016, the most important thing is to make sure that as we go into the 2020 election cycle, that security and auditing systems are in place to detect any malicious or accidental manipulations of voter registration databases. It’s now May 2019, and we have plenty of time to evaluate the current security protocols for these critical databases in every state, to improve those protocols where necessary, and to put in place database auditing and monitoring tools like those we have been working on in our Monitoring the Elections project.

Now’s the time to act — while we still can improve the security of voter registration systems, and establish auditing procedures to detect any efforts to manipulate the critical information in those systems.

How to avoid an election meltdown in 2020: Improve voter registration database security and monitoring

One of the most shocking parts of the Mueller report details the widespread efforts by Russian hackers to attack American election infrastructure in 2016.

Specifically, the report presents evidence that the Russian intelligence (GRU) targeted state and local election administration systems, that they have infiltrated the computer network of the Illinois State Board of Elections and at least one Florida County during the 2016 presidential election, using means such as SQL injection and spear phishing. They also targeted private firms that provide election administration technologies, like software systems for voter registration.

This is stunning news, and a wake-up call for improving the integrity and security of election administration and technology in the United States.

The Mueller report does not provide evidence that these hacking attempts altered the reported results of elections in 2016 or 2018. Instead the report highlights hacking efforts aimed at gaining access to voter registration databases, which might seem surprising to many.

Prior to the 2000 presidential election, voter registration data was maintained in a hodgepodge of ways by county and state election officials. After the passage of the Help America Vote Act in 2002, states were required to centralize voter registration data in statewide electronic databases, to improve the accuracy and accessibility of voter registration data in every state.

But one consequence of building statewide voter registration datasets is that they became attractive targets for hackers. Rather than targeting hundreds or thousands of election administration systems at the county level, hackers can now target a single database system in every state.

Why would hackers want to target voter registration systems?

First, a hacker could alter registration records in a state or county, or delete records, with the goal being to wreak havoc on Election Day. By dropping voters, or by changing voter addresses, names, or partisan affiliations, a hacker could create chaos on Election Day—for instance, voters could go to the right polling place, only to find that their name is not on the roster, and thus be denied the chance to vote.

A hack of this type, if done in a number of counties in a battleground state like Florida, could lead to an election meltdown like we saw in the 2000 presidential election.

Second, a hacker could be more systematic in their efforts. They could add fake voters to the database, and if they had access to the electronic systems used to send absentee ballots, get access to ballots for these fake voters.

This type of hack could enable a large-scale effort to actually change the outcome of an election, if the hackers marked and returned the ballots for these fake voters.

These vulnerabilities are real, and an unintended consequence of the development of centralized electronic statewide voter registration databases in the United States. There is little doubt that the attempts by hackers to target voter registration systems in 2016 and 2018 could have produced widespread disruption of either election, had they been successful.

There is also little doubt that efforts to hack voter registration databases in the United States will continue. The GRU will have better knowledge as to what vulnerabilities exist in our election systems and how to target them. What can we do to secure these databases, to prevent these attacks and to make sure that we can detect them if hackers gain access to registration databases?

Obviously, state and county election officials must continue their efforts to solidify the security of voter registration databases. They must also continue their efforts to make sure that strong electronic security practices are in place, to make sure that hackers cannot gain access to passwords and other administrative systems they might exploit to gain access to registration data.

There are further steps that can be taken by election officials to secure registration data.

In a pilot project that we at Caltech have conducted with the Orange County (California) Registrar of Voters, we built a set of software applications that monitor the County’s database of registered voters for anomalies. This pilot project was financially supported by a research grant to Caltech from the John Randolph Haynes and Dora Haynes Foundation. Details are available on the project’s website.

Working with the Registrar, we began getting daily snapshots of the County’s dataset of about 1.5 million registered voters about a year ago. We run our algorithms to look for anomalous changes in the database. Our algorithms can detect situations when unexpectedly large numbers of records are removed or added, and when unexpectedly large numbers of records are being changed. Thus, our algorithms can detect attempts to manipulate voter registration data.

After running our algorithms, we produce detailed reports that we send to the Registrar, letting them know if we see anomalies that require further investigation. We have developed other data-driven tools to monitor the 2018 elections in Orange County, looking at voting-by-mail patterns, turnout, and social media mentions. The results of this comprehensive monitoring appear on our pilot project’s website, providing transparency that we believe helps voters and stakeholders remain confident that the County’s voter registration data is secure.

This type of database and election system monitoring is critical for detecting and mitigating attempts to hack an election. It also helps isolate other issues that might occur in the administration of an election. By finding problems quickly, election officials can resolve them. By making the results of our monitoring available to the public, voters and stakeholders can be assured in the integrity of the election.

We are now working to build similar collaborations with other state and county election officials, to provide independent third-party monitoring of registration databases, and other related election administration infrastructure. Not only is it critical for election officials to monitor their data systems to make sure they have a high degree of integrity, it is also important that the public know that registration data is being monitored and is secure.

Residual votes in the 2016 presidential election

After generally declining after the 2000 presidential election, the national residual vote rate rose in the 2016 presidential election. Why?

We tackle this question in a new VTP working paper, “Residual Votes and Abstention in the 2016 Election,” which Charles Stewart III and I wrote with Stephen Pettigrew and Cameron Wimply. Here’s the paper’s abstract:

We analyze the significant increase in the residual vote rate in the 2016 presidential election. The residual vote rate, which is the percentage of ballots cast in a presidential election that contain no vote for president, rose nationwide from 0.99% to 1.41% between 2012 and 2016. The primary explanation for this rise is an increase in abstentions, which we argue results primarily from disaffected Republicans more than from alienated Democrats. In addition, other factors related to election administration and electoral competition also explain variation in the residual vote rates across states, particularly the use of mail/absentee ballots and the lack of competition at the top of the ticket in non-battleground states. However, we note that the rise in the residual vote rate was not due changes in voting technologies. The analysis relies on a combination of public opinion and election return data to address these issues.

Research on polling place lines and dynamics in PRQ!

Readers may remember that in 2016 a consortium of researchers from across the U.S. (including Caltech) participated in a large study of polling places lines and dynamics in the November general election. The great news is that some of the results have been published in the journal Political Research Quarterly. The study is a wonderful example of how much progress has been made in developing a science of election study.

The paper, “Waiting to Vote in the 2016 Presidential Election: Evidence from a Multi-county Study”, is now available on the journal’s website. The lead author is Robert M. Stein. Here’s the paper’s abstract:

This paper is the result of a nationwide study of polling place dynamics in the 2016 presidential election. Research teams, recruited from local colleges and universities and located in twenty-eight election jurisdictions across the United States, observed and timed voters as they entered the queue at their respective polling places and then voted. We report results about four specific polling place operations and practices: the length of the check-in line, the number of voters leaving the check-in line once they have joined it, the time for a voter to check in to vote (i.e., verify voter’s identification and obtain a ballot), and the time to complete a ballot. Long lines, waiting times, and times to vote are closely related to time of day (mornings are busiest for polling places). We found the recent adoption of photographic voter identification (ID) requirements to have a disparate effect on the time to check in among white and nonwhite polling places. In majority-white polling places, scanning a voter’s driver’s license speeds up the check-in process. In majority nonwhite polling locations, the effect of strict voter ID requirements increases time to check in, albeit modestly.

Report on “Voter Fraud” Rife With Inaccuracies

I look forward to a more detailed analysis by voter registration and database match experts of the GAI report that will be presented to the Presidential Advisory Commission on Election Integrity , but even a cursory reading reveals a number of serious misunderstandings and confusions that call into question that authors’ understanding of some of the most basic facts about voter registration, voting, and elections administration in the United States.

Fair warning: I grade student papers as part of my job, and one of the comments I make most often is “be precise”. Categories and definitions are fundamentally important, especially in a highly politicized environment like that current surrounding American elections.

The GAI report is far from precise; it’s not a stretch to say at many points that it’s sloppy and misinformed. I worry that it’s purposefully misleading. Perhaps I overstate the importance of some of the mistakes below. I leave that for the reader to judge.

  • The report uses an overly broad and inaccurate definition of vote fraud.

American voter lists are designed to tolerate invalid voter registration records, which do not equate to invalid votes, because to do otherwise would lead to eligible voters being prevented from casting legal votes.

But the report follows a very common and misleading attempt to conflate errors in the voter rolls with “voter fraud”. Read their “definition”:

Voter fraud is defined as illegal interference with the process of an election. It can take many forms, including voter impersonation, vote buying, noncitizen voting, dead voters, felon voting, fraudulent addresses, registration fraud, elections officials fraud, and duplicate voting.8

Where did this definition come from? As the source of the definition, they cite the Brennan Center report “The Truth About Voter Fraud” (https://www.brennancenter.org/sites/default/files/legacy/The%20Truth%20About%20Voter%20Fraud.pdf). 

However, the Brennan Center authors are very careful to define voter fraud. From Pg. 4 of their report in a way that directly warns against an overly broad and imprecise definition:

Voter fraud” is fraud by voters. More precisely, “voter fraud” occurs when individuals cast ballots despite knowing that they are ineligible to vote, in an attempt to defraud the election system.1

This sounds straightforward. And yet, voter fraud is often conflated, intentionally or unintentionally, with other forms of election misconduct or irregularities.

To be fair to the authors, they do not conflate in their analysis situations such as being registered in two places at once with “voter fraud”, but the definition is sloppy, isn’t supported by the report they cite, and reinforces a highly misleading claim that voter registration errors are analogous to voter fraud.

David Becker can describe ad nauseam how damaging this misinterpretation has been.

  • The report makes unsubstantiated claims about the efficacy of Voter ID in preventing voter fraud.

Regardless of how you feel about voter ID, if you are going to claim that voter ID prevents in-person vote fraud, you need to provide actual proof, not just a supposition. The report authors write:

GAI also found several irregularities that increase the potential for voter fraud, such as improper voter registration addresses, erroneous voter roll birthdates, and the lack of definitive identification required to vote.

The key term here is “definitive identification”, a term that appears nowhere in HAVAThe authors either purposely or sloppily misstate the legal requirements of HAVA.  On pg. 20 of the report, they write that HAVA has a

“requirement that eligible voters use definitive forms of identification when registering to vote”

The word “definitive” appears again, and a bit later in the paragraph, it appears that a “definitive” ID, according to the authors, is:

“Valid drivers’ license numbers and the last four digits of an individual’s social security number…”,

But not according to HAVA. HAVA requirements are, as stated in the report:

“Alternative forms of identification include state ID cards, passports, military IDs, employee IDs, student IDs, bank statements, utility bills, and pay stubs.”

The rhetorical turn occurs at the end of the paragraph, when the authors conclude that these other forms of ID are:

“less reliable than the driver’s license and social security number standard”. This portion of the is far from precise.

and apparently not “definitive” and hence prone to fraud.

Surely the authors don’t intend to imply that a passport is “less reliable” than a drivers license and social security number. In many (most?) states, a “state ID card” is just as reliable as a drivers license. I’m not familiar with the identification requirements for a military ID—perhaps an expert can help out?[ED NOTE: I am informed by a friend that a civilian ID at the Pentagon requires a retinal scan and fingerprints]–but are military IDs really less “definitive” than a driver’s license?

If you are going to claim that voter fraud is an issue requiring immediate national attention, and that states are not requiring “definitive” IDs, you’d better get some of the most basic details of the most basic laws and procedures correct.

  • The authors claim states did not comply with their data requests, when it appears that state officials were simply following state law

The authors write:

(t)he Help America Vote Act of 2002 mandates that every state maintains a centralized statewide database of voter registrations.14

That’s fine, but the authors seem to think this means that HAVA requires that the states make this information available to researchers at little to no cost. Anyone who has worked in this field knows that many states have laws that restrict this information to registered political entities. Most states restrict the number of data items that can be released in the interests of confidentiality.

Rather than acknowledging that state officials are constrained by state law, the authors claim non-compliance:

In effect, Massachusetts and other states withhold this data from the public.

I can just hear the gnashing of teeth in the 50 state capitols.I am sympathetic with the authors’ difficulties in obtaining statewide voter registration and voter history files. Along with the authors, I would like to see all state files be available for a low or modest fee, and to researchers.

There is no requirement that the database be made available for an affordable fee, nor that the database be available beyond political entitles.  These choices are left to the states.  it is wrong to charge “non-compliance” when an official is following statute (passed by their state legislatures).

I don’t know whether the report authors didn’t have subject matter knowledge or were purposefully trying to create a misleading image of non-cooperation with the Commission.

  • The report shows that voter fraud is nearly non-existent, while simultaneously
    claiming the problem requires “immediate attention”.

But let’s return to the bottom line conclusion of the report: voter fraud is pervasive enough to require “immediate attention.” Do their data support this claim?

The most basic calculation would be the rate of “voter fraud” as defined in the report The 45,000 figure (total potential illegally cast ballots) is highly problematic, based on imputing from suspect calculations in 21 states, then imputed to 29 other states without considering even the most basic rules of statistical calculation.

Nonetheless, even if you accept the calculation, it translates into a “voter fraud” rate of 0.000323741007194 (45,000 / 139 million), or three thousandths of a percent.

This is almost exactly the probability that you will be struck across your whole lifetime (a chance of 1 in 3000 http://news.nationalgeographic.com/news/2004/06/0623_040623_lightningfacts.html)

I’m not the first one to notice this comparison—see pg. 4 of the Brennan Center report cited below. And here I thought I found something new!


There are many, many experts in election sciences and election administration that could have helped the Commission conduct a careful scientific review of the probability of duplicate registration and duplicate voting.  This report, written by Lorraine Minnite more than a decade ago lays out precisely the steps that need to be taken to uncover voter fraud and how statewide voter files should be used in this effort. There are many others in the field including those worried about voter fraud and those who are skeptics of voter fraud who have been calling for just such a careful study.

Unfortunately, the Commission instead chose to consult a “consulting firm” with no experience in the field, and which chose to consult database companies who also had no expertise in the field.

I’m sure that other experts will examine in more detail the calculations about duplicate voting. However, at first look, the report fails the smell test. It’s a real stinker.


Paul Gronke
Professor, Reed College
Director, Early Voting Information Center

http://earlyvoting.net
Felony Disenfranchisement

I frequently am asked by students, colleagues, and the media, about how many people in the U.S. cannot participate in elections because of felony disenfranchisement laws. Given the patchwork quilt of felony disenfranchisement laws across the states, and a lack of readily available data, it’s often hard to estimate what the rate of felony disenfranchisement might be.

The Sentencing Project has released a report that provides information and data about felony disenfranchisement and the 2016 federal elections in the U.S. Here are their key findings, quoted from their report:

“Our key findings include the following:

– As of 2016, an estimated 6.1 million people are disenfranchised due to a felony conviction, a figure that has escalated dramatically in recent decades as the population under criminal justice supervision has increased. There were an estimated 1.17 million people disenfranchised in 1976, 3.34 million in 1996, and 5.85 million in 2010.

– Approximately 2.5 percent of the total U.S. voting age population – 1 of every 40 adults – is disenfranchised due to a current or previous felony conviction.

– Individuals who have completed their sentences in the twelve states that disenfranchise people post-sentence make up over 50 percent of the entire disenfranchised population, totaling almost 3.1 million people.

– Rates of disenfranchisement vary dramatically by state due to broad variations in voting prohibitions. In six states – Alabama, Florida, Kentucky, Mississippi, Tennessee, and Virginia – more than 7 percent of the adult population is disenfranchised.

– The state of Florida alone accounts for more than a quarter (27 percent) of the disenfranchised population nationally, and its nearly 1.5 million individuals disenfranchised post-sentence account for nearly half (48 percent) of the national total.

– One in 13 African Americans of voting age is disenfranchised, a rate more than four times greater than that of non-African Americans. Over 7.4 percent of the adult African American population is disenfranchised compared to 1.8 percent of the non-African American population.

– African American disenfranchisement rates also vary significantly by state. In four states – Florida (21 percent), Kentucky (26 percent), Tennessee (21 percent), and Virginia (22 percent) – more than one in five African Americans is disenfranchised.”

This looks like a useful resource for those interested in understanding the possible electoral implications of felony disenfranchisement laws across the U.S.

Media exit polls, election analytics, and conspiracy theories

The integrity of elections is a primary concern in a democratic society. One of the most important developments in the study of elections in recent decades has been the rapid development of tools and methods for evaluation of elections, most specifically, what many call “election forensics.” I and a number of my colleagues have written extensively on election evaluation and forensics; I refer interested readers to the book that Lonna Atkeson, Thad Hall, and I wrote, Evaluating Elections, and to the book that I edited with Thad and Susan Hyde, Election Fraud.

One question that continues to arise concerns whether observed differences between election results and media exit polls is evidence of electoral manipulation or election fraud. These questions have been raised in a number of recent U.S. presidential elections, and have come up again in the recent presidential primary elections in the U.S. In a recent piece in the New York Times, Nate Cohn wrote about these claims, and why we should be cautious in the use of media exit polls to detect election fraud. Each of the points that Cohn makes is valid and important, so this is an article worth reading closely.

I’d add to Cohn’s arguments, and note that while media exit polls have clear weaknesses as the sole forensic tool for determining the integrity of an election, we have a wide variety of other tools and methods to use in situations where there are questions raised about an election.
As Lonna, Thad and I wrote in Evaluating Elections, a good post-election study of an election’s integrity should involve a variety of data sources and multiple methods: including surveys and polls, post-election audits, and forensic analysis of disaggregated election returns. Each analytic approach has it’s strengths and weaknesses (media exit polls included), so by approaching the study of election integrity using as many data sources and different methods as we can, we can best locate where we might want to launch further investigation of potential problems in an election.

I have no doubt that we will hear more about the use of exit polls to evaluate the integrity of the presidential election this fall. Keep in mind Cohn’s cautionary points about using exit polls for this purpose, and also keep in mind that there are many other ways to evaluate the integrity of an election that have been tested and used in past elections. Media exit polls aren’t a great forensic tool, as Cohn argues: the types of exit polls that the news media uses to make inferences about voting behavior are not designed to detect election fraud or manipulation. Rather, those interested in a detailed examination of an election’s integrity should instead use the full array of analytic forensic tools that have been developed and tested in the research literature.

Here we go again? Ballot design and the June California primary

Political observers will remember the 2003 California gubernatorial recall election, where 135 candidates ran in the election to replace Governor Davis. Rod Kiewiet and I wrote about how this complex election produced difficult decision problems for voters, and in a different paper (with Goodrich, Kiewiet, Hall and Sled) I also wrote about how the complexity of the recall election posed administrative problems for election officials.

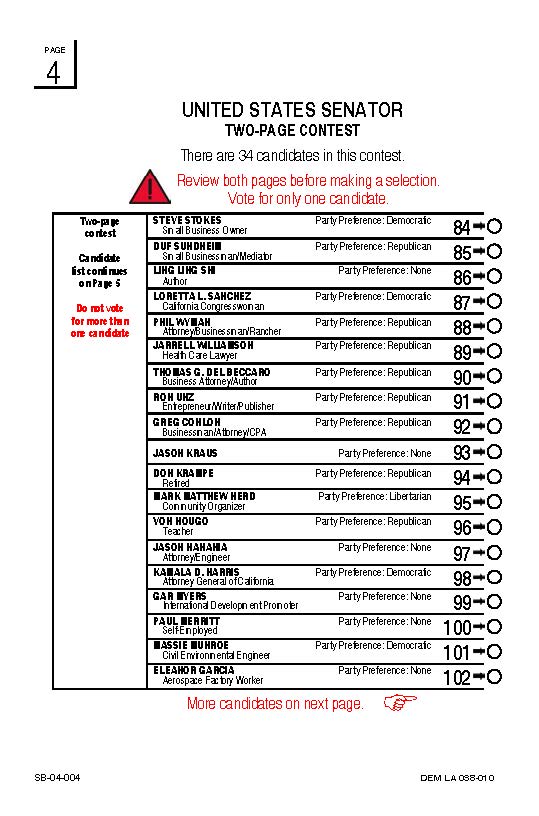
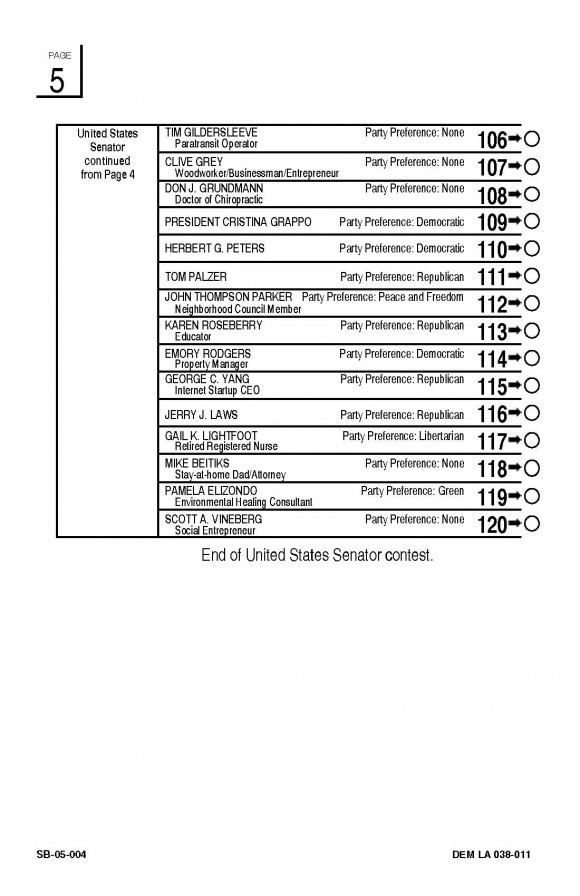
The upcoming June primary in California is shaping up as one where again we have a complicated race, though this time it is for the U.S. Senate. In the primary for the U.S. Senate there are 34 candidates competing to win the primary, and to move on to the general election in November. There have been a few preliminary reports in the media about how the crowded ballot might be problematic for voters when they try to find their candidates in the primary election.

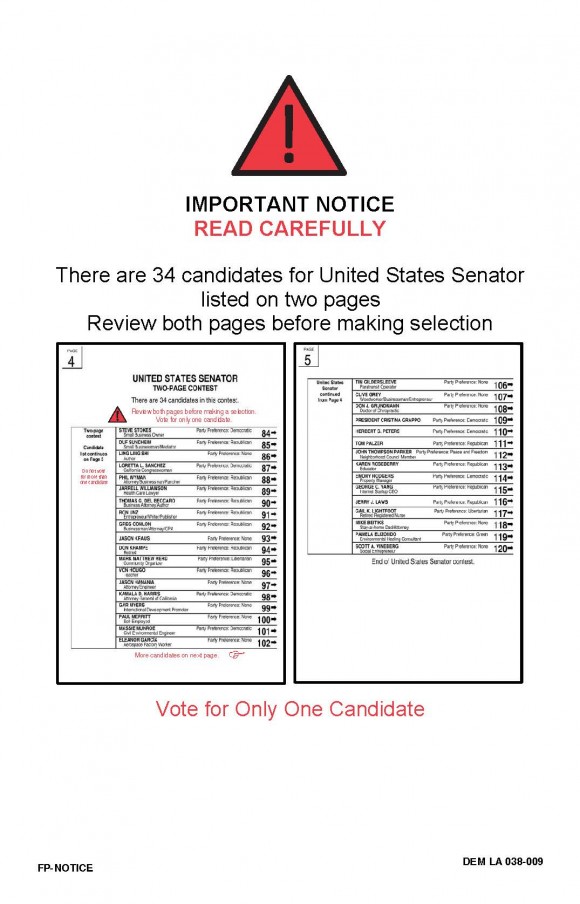
So I took a look at the sample Democratic ballot for Los Angeles County, which is reproduced below. The first page is designed to tell voters that the ballot for the U.S. Senate will have two pages, and it reproduces each page.

sample-ballot_Page_1

The next two pages show what the ballot will look like in L.A. County; in this example, there are 19 candidates listed on the first page, and 15 candidates listed on the second page. The way this ballot is laid out, voters would need to look for their candidate on the first page, and then if they don’t find their candidate listed there, flip to the second page to find their preferred candidate.

sample-ballot_Page_2

sample-ballot_Page_3

This is just an example from L.A. County, which uses a unique voting system (“InkaVote”). While the sample ballot provides ample warnings to voters to only vote for one candidate, and to check both pages for their candidate of choice, there’s a good chance that we’ll see voters make mistakes. In particular, we may see a increased risk of overvotes for the U.S. Senate race, as some voters may not understand that they are only supposed to vote for one candidate (or not see the warnings) and instead may believe they are supposed to make a mark for a candidate on each page. We may also see voters get confused and just skip this race, which might result in an increased rate of undervoting in this election.

As other counties are using different ballot designs and layouts for this race, this is just an example of what might happen in L.A. County. Given the complexity of this ballot and election, there’s a good chance that we might see increased rates of both undervoting and overvoting across the state this June, though the exact causes for that will depend on the specifics of ballot design and layout in each county.

Whether these designs and layouts lead to systematic voter errors of the sort seen in 2000 is not clear at this point, as I’ve not had a chance yet to look at sample ballots from many of the larger counties in the state. However, we do know from research published about the infamous “butterfly ballot” used in Palm Beach County in the 2000 presidential election, even a relatively small number of voter mistakes can be influential in a close election (see the paper by Wand et al. on the butterfly ballot). If the U.S. Senate primary is close in June, we could see some scrutiny of ballot design and layout, and whether problems with design and layout may have led to voter error.

Making sure that California election officials are ready for the upcoming primary

California’s statewide primary is approaching rapidly, and it sounds as if voter interest in the primary is building. This could be an important test of the state’s top-two primary system, and it might the first time that we see strong voter turnout under the top-two. Clearly election officials throughout the state need to be prepared — there might be a lot of last-minute new registrants, a lot of ballots cast by mail, and perhaps many new voters showing up on election day. The LA Times editorialized about this exactly concern, “How do we prevent the California primary from becoming another Arizona?”.