Category Archives: 2018 Election

The Blue Shift in California Elections

Guest Blog by Michelle Hyun

Michelle is an undergraduate student at Caltech. In the summer of 2019, she was a Summer Undergraduate Research Fellow (SURF) at Caltech. Her research was conducted in collaboration with Yimeng Li and R. Michael Alvarz. We have recently released a working paper, it’s now available online, “Why Do Election Results Change After Election Day? The Blue Shift in California Elections.”

With the presidential primaries ongoing, and the November 2020 general election looming, it is critical to explain the trends of voters and the integrity of the election. In many past elections, the occurrence of the electoral “Blue Shift,” in which vote margins are observed to shift towards favoring Democratic candidates, has provided a surge of votes in the later parts of the vote count that has caused changes in leads more often than expected. This shift can cause people to call into question the integrity of the election system, which is dangerous for the legitimacy of democratic elections and the participation of voters in their government.

The blue shift has been observed in several past elections: one such example was the 39th District’s 2018 election for the U.S. House of Representatives, Young Kim believed she had won the race, but after a few weeks, it was revealed that her opponent, Gil Cisneros, had actually won. Elections in Orange County, California in 2012, 2014, 2016, and 2018 for House of Representative seats, gubernatorial seats, and presidential seats were analyzed to seek the cause of the drift. Shifts occurred across almost all of these elections, and while they may not have been enough to change the results of all the elections, the drift was certainly enough to raise questions.

Technological advances have made ballot counting and transmission of election results faster than ever. In many states including California, soon after polls close, election officials release results from early-voting ballots and mail ballots that have been processed before Election Day, followed by regular ballots cast on Election Day as precincts report them. Major cable networks, radio stations, and other media organizations receive these results from The Associated Press correspondents stationed at local government offices and data feeds provided by local governments as soon as they become available and make projections on most races. As a result, for voters following Election Day coverage on TV, radio, the Internet, or through morning newspapers, it may appear that elections are mostly over except for a few close contests by the end of Election Night. This perception masks the reality that a significant fraction of ballots is counted after Election Day, especially in states like California where voting by mail and provisional ballots are common.

This paper shows that the demographics of the voters and the number of ballots that are counted later in the election process are directly related to the magnitude of the blue shift. Using data from the Orange County Registrar of Voters (OCROV), we were able to find a positive association between Democratic voters and blue shifts; additionally, using data from the Cooperative Congressional Election Survey (CCES) and the Survey of the Performance of American Elections (SPAE), we were able to find that young, non-white voters are more likely to cast ballots that are counted later in the vote count process. Our findings are significant in that they explain a phenomenon that may call into question the integrity of our voting system. As the presidential primaries continue and as the general election approaches, we seek to establish voter confidence to encourage voter participation and ensure a smooth transition of power.
The 2018 Voting Experience

My fellow VTP Co-director, Charles Stewart III and some of his research team, released an important study last week: “The 2018 Voting Experience: Polling Place Lines.” Charles and his team continue to find that long lines can be an issue in many states and election jurisdictions. They estimated that in 2018, 5.7% of those who tried to vote on Election Day waited more than 30 minutes to vote, and that this was significantly longer than what they had found in the previous federal midterm election in 2014. Importantly, they also show that wait times are not distributed uniformly across the electorate, with nonwhite and voters in densely populated areas waiting longer to vote than whites and voters in less densely populated areas. Finally, as they note that wait times are strongly correlated with a voter’s overall experience at the polls, long wait times are an issue that needs continued attention in the United States. This is especially true as we are heading into what may be a very closely contested array of state and federal primary and general elections in 2020, where many states and jurisdictions may see much higher turnout than in 2016 and 2018.

How to avoid an election meltdown in 2020: Improve voter registration database security and monitoring

One of the most shocking parts of the Mueller report details the widespread efforts by Russian hackers to attack American election infrastructure in 2016.

Specifically, the report presents evidence that the Russian intelligence (GRU) targeted state and local election administration systems, that they have infiltrated the computer network of the Illinois State Board of Elections and at least one Florida County during the 2016 presidential election, using means such as SQL injection and spear phishing. They also targeted private firms that provide election administration technologies, like software systems for voter registration.

This is stunning news, and a wake-up call for improving the integrity and security of election administration and technology in the United States.

The Mueller report does not provide evidence that these hacking attempts altered the reported results of elections in 2016 or 2018. Instead the report highlights hacking efforts aimed at gaining access to voter registration databases, which might seem surprising to many.

Prior to the 2000 presidential election, voter registration data was maintained in a hodgepodge of ways by county and state election officials. After the passage of the Help America Vote Act in 2002, states were required to centralize voter registration data in statewide electronic databases, to improve the accuracy and accessibility of voter registration data in every state.

But one consequence of building statewide voter registration datasets is that they became attractive targets for hackers. Rather than targeting hundreds or thousands of election administration systems at the county level, hackers can now target a single database system in every state.

Why would hackers want to target voter registration systems?

First, a hacker could alter registration records in a state or county, or delete records, with the goal being to wreak havoc on Election Day. By dropping voters, or by changing voter addresses, names, or partisan affiliations, a hacker could create chaos on Election Day—for instance, voters could go to the right polling place, only to find that their name is not on the roster, and thus be denied the chance to vote.

A hack of this type, if done in a number of counties in a battleground state like Florida, could lead to an election meltdown like we saw in the 2000 presidential election.

Second, a hacker could be more systematic in their efforts. They could add fake voters to the database, and if they had access to the electronic systems used to send absentee ballots, get access to ballots for these fake voters.

This type of hack could enable a large-scale effort to actually change the outcome of an election, if the hackers marked and returned the ballots for these fake voters.

These vulnerabilities are real, and an unintended consequence of the development of centralized electronic statewide voter registration databases in the United States. There is little doubt that the attempts by hackers to target voter registration systems in 2016 and 2018 could have produced widespread disruption of either election, had they been successful.

There is also little doubt that efforts to hack voter registration databases in the United States will continue. The GRU will have better knowledge as to what vulnerabilities exist in our election systems and how to target them. What can we do to secure these databases, to prevent these attacks and to make sure that we can detect them if hackers gain access to registration databases?

Obviously, state and county election officials must continue their efforts to solidify the security of voter registration databases. They must also continue their efforts to make sure that strong electronic security practices are in place, to make sure that hackers cannot gain access to passwords and other administrative systems they might exploit to gain access to registration data.

There are further steps that can be taken by election officials to secure registration data.

In a pilot project that we at Caltech have conducted with the Orange County (California) Registrar of Voters, we built a set of software applications that monitor the County’s database of registered voters for anomalies. This pilot project was financially supported by a research grant to Caltech from the John Randolph Haynes and Dora Haynes Foundation. Details are available on the project’s website.

Working with the Registrar, we began getting daily snapshots of the County’s dataset of about 1.5 million registered voters about a year ago. We run our algorithms to look for anomalous changes in the database. Our algorithms can detect situations when unexpectedly large numbers of records are removed or added, and when unexpectedly large numbers of records are being changed. Thus, our algorithms can detect attempts to manipulate voter registration data.

After running our algorithms, we produce detailed reports that we send to the Registrar, letting them know if we see anomalies that require further investigation. We have developed other data-driven tools to monitor the 2018 elections in Orange County, looking at voting-by-mail patterns, turnout, and social media mentions. The results of this comprehensive monitoring appear on our pilot project’s website, providing transparency that we believe helps voters and stakeholders remain confident that the County’s voter registration data is secure.

This type of database and election system monitoring is critical for detecting and mitigating attempts to hack an election. It also helps isolate other issues that might occur in the administration of an election. By finding problems quickly, election officials can resolve them. By making the results of our monitoring available to the public, voters and stakeholders can be assured in the integrity of the election.

We are now working to build similar collaborations with other state and county election officials, to provide independent third-party monitoring of registration databases, and other related election administration infrastructure. Not only is it critical for election officials to monitor their data systems to make sure they have a high degree of integrity, it is also important that the public know that registration data is being monitored and is secure.

New developments in the fight on election interference

There is a news report today that in last fall’s midterm elections, the U.S. Cyber Command and the NSA worked to take Russian cyber-trolls offline. It’s an interesting new development in the continuing fight against interference in U.S. elections. Here’s a link to the Washington Post story, and here’s the summary:

The strike on the Internet Research Agency in St. Petersburg, a company underwritten by an oligarch close to President Vladi­mir Putin, was part of the first offensive cyber-campaign against Russia designed to thwart attempts to interfere with a U.S. election, the officials said.

“They basically took the IRA offline,” according to one individual familiar with the matter who, like others, spoke on the condition of anonymity to discuss classified information. “They shut them down.”

Interesting development in the continuing struggle to fight cyber interference in elections.

On the recounts: Let’s get it right

Why don’t we immediately know the results of American elections right after polls close on election night?

The answer is simple. American elections are highly decentralized, and highly complex. The laws, procedures, and technologies used for our elections are not designed to produce quick results. Rather the way we administer elections in America requires patience, as we want to get the numbers right, not rely on guesswork.

In America we pride ourselves on our federalist system. One important principle of our democracy is that states many rights under the U.S. Constitution, and important state rights is running elections. States have wide authority to determine the conduct of their elections, and that’s one reason that we see such vast differences in how elections are run in America.

But the decentralization goes further, because in most states elections are largely run by counties or even municipalities. This means that we don’t have a single federal election, nor do we have fifty elections in the states. Rather we have thousands of elections in the November of each even-numbered year, with very different procedures and technologies.

The reality of this extreme decentralization of election administration in America, which is largely unique in the world, is that we have to rely on under-resourced local governments to run elections with integrity. That’s a big ask, because elections are complex administrative tasks.

At Caltech, we’ve been working in collaboration with the Orange County Registrar of Voters here in Southern California, and studying various methods to help audit their election administration practices. When you look under the hood, and see exactly how elections are administered in Orange County, you see quickly how complicated it is.

In the elections this fall, Orange County had over 1500 polling locations, and had to recruit thousands of poll workers to service the polling locations. They have about 1.5 million registered voters, with at least 8,000 of them living abroad or serving in the military. 1.1 million ballots were sent to voters in the mail before the election.

Our research group spent time observing voting in five of Orange County’s early voting centers, and in 35 polling places on Election Day. Seeing how poll workers do their jobs, how the technology works, and witnessing voter experiences directly, is an invaluable experience. We observed just how diligent polling place inspectors and clerks about about trying to provide a good experience for voters.

But we also saw how complicated the process is for poll workers, and saw first-hand why it takes so long for final election results to be tabulated and certified in places like Orange County.

In every Election Day polling place we visited, we saw many voters bringing in their completed and sealed mail ballots, depositing them in the ballot box. Many voters who had received a by-mail ballot brought them along, and surrendered them at the polling place, preferring to vote at the polling place instead. Some of the by-mail voters forgot to bring their ballots to surrender, and others could not be found in the registration books, leading many voters to cast provisional ballots.

All of these ballots have to be confirmed and reconciled after the polls close on Election Day. Despite what people may claim, election officials count every valid ballot — but they must first determine which ballots are valid, and they need to reconcile the vast array of ballots coming from different sources: from in-person early voting, absentee ballots sent by mail, ballots from overseas voters and military personnel, Election Day ballots, provisionals, and mail ballots dropped off on Election Day.

Keep in mind that this process happens in every election jurisdiction in America. The exact procedures and voting technologies used differ across states and counties, but every one of those jurisdictions is doing this very process to come up with a final and accurate tally of all valid votes that were cast in this midterm election. Some jurisdictions do it quickly, others will be slower, but in every single election jurisdiction in America, it takes time to count all of the votes.

This process isn’t pretty to watch, but it’s vital for the health of our democracy. And this process just takes time, because election officials want to get the most accurate count of the vote as is possible.

Not having final election results just after the polls close is not an indication of fraud, or any necessary indication that there was something wrong with the election. Instead, the delay in reporting final results is generally a good thing, as it means that election officials are working hard to make sure that all valid votes are included in the final tabulation.

So why don’t we have final results in many places, a week after the election? Because American elections are decentralized, and complex. Election officials are working to get the results right. We need to give them the time to do that, free from political pressure.

My advice?

Be patient, let the process continue, and make sure that every valid vote cast in the midterm election is counted.

The close gubernatorial election in Georgia: monitoring public opinion about the administration of the election

By Nicholas Adams-Cohen

This is a guest essay, written by Nicholas Adams-Cohen, a Ph.D. student at Caltech, who is working on the Monitoring the Election project.

Nearly half of the American public turned out to vote on November 6th 2018, representing more ballots cast in a midterm than in the last 50 years. As is often the case in a closely contested election, concerns about voter fraud and suppression were broadcast by various media institutions, with journalists and pundits concerned about the ways the democratic process might have been compromised. What if there was a way to detect problem areas in real-time, gauging how voters react to problems in the voting process as incidents occur? Detecting these issues early might allow us to troubleshoot areas where voting procedures break down, ultimately improving the democratic process.

With these goals in mind, the California Institute of Technology’s “Monitoring the Election” project has built a social media election monitor aimed at pinpointing problem areas through social media discussions. If we can determine how the intensity of discussions about various instances of voter fraud correlate with the severity of issues in the voting process, it becomes possible to detect and address voting issues as they occur.

Historically, if social scientists wanted to study whether or not voters had concerns about the voting process, they might rely on voter satisfaction surveys. While useful, survey methods suffer from numerous issues, including non-response biases that are increasingly difficult to correct and a lag between when citizens vote and when they eventually fill out a survey. Our method instead tracks social media streams, specifically Twitter, to discover when, who, and how voters discuss problems in real-time. By collecting all messages mentioning keywords related to potential problems in the voting process, we can extract a signal about where and when the voting process breaks down.

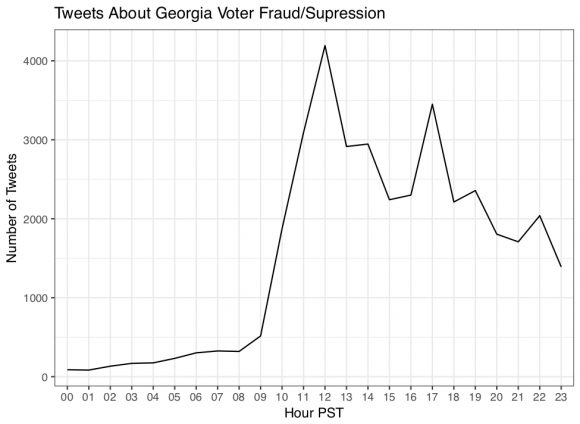
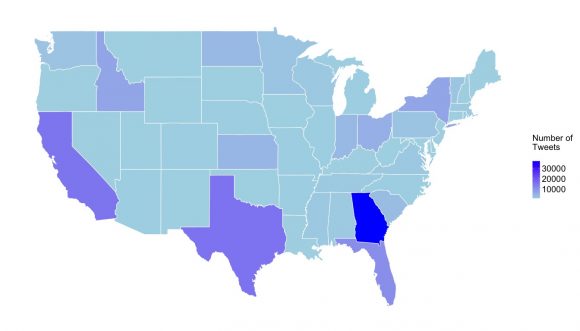
This monitor ran throughout the November 6th, 2018 election, and with the data we collected we can analyze how conversations concerning voter fraud evolved throughout this historic midterm. One of the most insightful ways we can use these data is by determining which areas of the United States faced the most criticisms about voter fraud and suppression. To that end, we used various natural language processing methodologies to determine which messages about fraud and suppression were directed at specific states. The results of this analysis is found in the following map, where we use a gradient the highlight the number how many messages about voter fraud mention a specific state. As shown in the plot below, which charts the number of tweets, we find an unusually high number of messages concerned with Georgia, where the Governor’s race between Brian Kemp and Stacey Abrams was inundated with concerns about voter suppression. For examples of news reports, you can see the articles here and here.

As shown in line plot below, which plots the number of tweets concerned with voter suppression in Georgia over time, our monitor detected a potential issue with Georgia as early as 12pm PST, before many media groups could widely broadcast these concerns.

As voters become more vocal about the electoral process on social media platforms, these maps and monitors serve as an important and powerful prognosis tool for officials to solve problems and citizens to discover disturbances in the voting process. Ultimately, we hope to continue developing tools to provide transparency, increase efficiency, and help understand the American electoral process.

A High-Intensity Midterm Election: Lessons

Yesterday’s midterm elections across the U.S. were intense. There were highly contested gubernatorial, U.S. Senate, and U.S. House elections, across the country. While final results on voter turnout, and the exact outcome of many of the contested races, will take days or weeks to determine, the good news is that despite the pressure that was put on U.S. election infrastructure yesterday, in general the elections went smoothly.

Keep in mind that before Tuesday, there were concerns about potential attempts to infiltrate the infrastructure of U.S. elections. At this point there’s no evidence of any successful hacks. And as we move into post-election ballot tabulation and reconciliation, we’ll be paying close attention and continue to monitor the integrity of the midterm elections.

And our electoral infrastructure was under pressure yesterday. We will be working to put together data from our OC election integrity pilot project, in particular, documenting the observations from our election-day monitoring, from our Twitter monitor, and the various auditing and forensics analyses we will be doing in coming weeks. All of these will be summarized on the general election dashboard for our project, and we’ll also be pushing out notifications via social media.

So stay tuned.

OCRV project gearing up for the general election

Our Orange County election integrity project is gearing up for the general election.

At this point, we are tracking by-mail ballots, the most recent data on ballots mailed and ballots returned is on the general election dashboard, at “Vote By Mail Return.”

We are also monitoring a number of different conversations about the elections on Twitter, you can see what that conversation looks like at the “National Twitter Monitor”. We are currently seeing a lot of Twitter conversation about Election Day voting and about Remote voting (early and voting by mail).

Finally, we have recently posted a summary report that presents the results from our voter registration auditing collaboration with OCRV. The summary report can be found on the “Voter Registration Database Auditing” tab, on the general election dashboard.

We will continue to update the dashboard over the next few weeks!

Five books to read for the 2018 midterm elections

As we head into the final stretch of the 2018 midterm election season, I thought I’d share five interesting, well-written, and engaging books that I’ve read recently, books that might provide some useful context for the midterms.

The first is Jill Lepore’s These Truths: A History of the United States. Don’t be intimidated by this book’s length (it’s 960 pages!), as it’s highly engaging, and written in a style that is quite easy to read. I’m impressed by Lepore’s ambition (covering American history in 960 pages), and by the way she weaves through the book detailed stories of many of the personalities behind the important events she covers. This book provides great context for this important midterm election.

A second book is Ron Chernow’s Grant. This is also an imposing book, just over 1000 pages (I read parts some, listened to most). I enjoyed this book, mainly as there is a lot of Grant’s story that I didn’t know well, especially his role in the western theater of the Civil War, and the events of his presidency. Reading this book, I was struck by a number of parallels to current politics, and it was quite interesting to read about Grant’s personal and professional struggles, and how he resolved many of the issues he encountered as a person, a military leader, and as president.

Third, I recommend David Sanger’s The Perfect Weapon: War, Sabotage, and Fear in the Cyber Age. Sanger covered the Russian attempts to interfere in the 2016 presidential election at the New York Times, and this book provides both great context for the evolution of cyberwar, he carefully and thoroughly discusses what is known about the attempts to manipulate the 2016 elections. As many of you know, we’ve been working on election security for a long time, and a particular focus of our recent research at Caltech has been on developing methodologies for detecting attempts at manipulating voter registration databases. Sanger’s book is a readable resource for anyone trying to understand the security risk that election administrators face.

The next two books are more academic in nature, but I’ve been fielding a lot of questions recently about these topics, so I thought I’d put a book about voter turnout and about polling on this list.

So regarding voter turnout, the best contemporary book on the subject was written by my colleagues Jan E. Leighley and Jonathan Nagler, Who Votes Now? Demographics, Issues, Inequality, and Turnout in the United States. If you really want to know why people in the U.S. vote, why they don’t vote, and why it matters — you should read Leighley and Nagler. I have a well-read copy in my office, and I find that I refer to their book quite frequently. They are the experts on voter participation, having studied for decades why people vote and why the don’t vote, and their book provides the best analysis of this important subject that I’m aware of.

Then there is polling. In 2016 there were many issues with the public polls, especially those trying to gauge voter turnout and sentiment in the final weeks of the election in the battleground states. Polling and survey methodology is in a state of flux; the traditional methods of sampling and contacting respondents (like random-digit dialing) are under considerable scrutiny, and academics and professional pollsters are turning to many different types of respondent-driven survey approaches. The best resource today for understanding the current state of polling and survey methods is the Oxford Handbook of Polling and Survey Methods, which I edited with Lonna Atkeson. It’s a hefty handbook, and it’s not cheap, but it surveys the landscape of polling and survey methods from sampling, to questionnaire design, survey implementation, and the analysis/presentation of survey results. If you have a question about polling or surveying, the answer is likely to be in this handbook.

Okay, so perhaps you were looking for me to recommend some books that weren’t political history, about cyberwar, or academic treatments of turnout and polling. If so, here’s a few quick suggestions. For the past few years, I’ve taken the suggestion of Nick Hornby and journaled all of the books that I’ve started, keeping track of the ones I’ve read and enjoyed, those I’ve read and not enjoyed, and those I didn’t finish. Here are five works of fiction; if you are looking for something to keep your attention away from the midterm elections. Five of my favorite recent fiction reads, in no particular order, are: Delia Owens, Where the Crawdads Sing; Kristin Hannah, The Great Alone; Paul Tremblay, A Head Full of Ghosts; Sebastian Barry, Days Without End; and George Saunders, Lincoln in the Bardo.