By Nicholas Adams-Cohen
This is a guest essay, written by Nicholas Adams-Cohen, a Ph.D. student at Caltech, who is working on the Monitoring the Election project.
Nearly half of the American public turned out to vote on November 6th 2018, representing more ballots cast in a midterm than in the last 50 years. As is often the case in a closely contested election, concerns about voter fraud and suppression were broadcast by various media institutions, with journalists and pundits concerned about the ways the democratic process might have been compromised. What if there was a way to detect problem areas in real-time, gauging how voters react to problems in the voting process as incidents occur? Detecting these issues early might allow us to troubleshoot areas where voting procedures break down, ultimately improving the democratic process.
With these goals in mind, the California Institute of Technology’s “Monitoring the Election” project has built a social media election monitor aimed at pinpointing problem areas through social media discussions. If we can determine how the intensity of discussions about various instances of voter fraud correlate with the severity of issues in the voting process, it becomes possible to detect and address voting issues as they occur.
Historically, if social scientists wanted to study whether or not voters had concerns about the voting process, they might rely on voter satisfaction surveys. While useful, survey methods suffer from numerous issues, including non-response biases that are increasingly difficult to correct and a lag between when citizens vote and when they eventually fill out a survey. Our method instead tracks social media streams, specifically Twitter, to discover when, who, and how voters discuss problems in real-time. By collecting all messages mentioning keywords related to potential problems in the voting process, we can extract a signal about where and when the voting process breaks down.
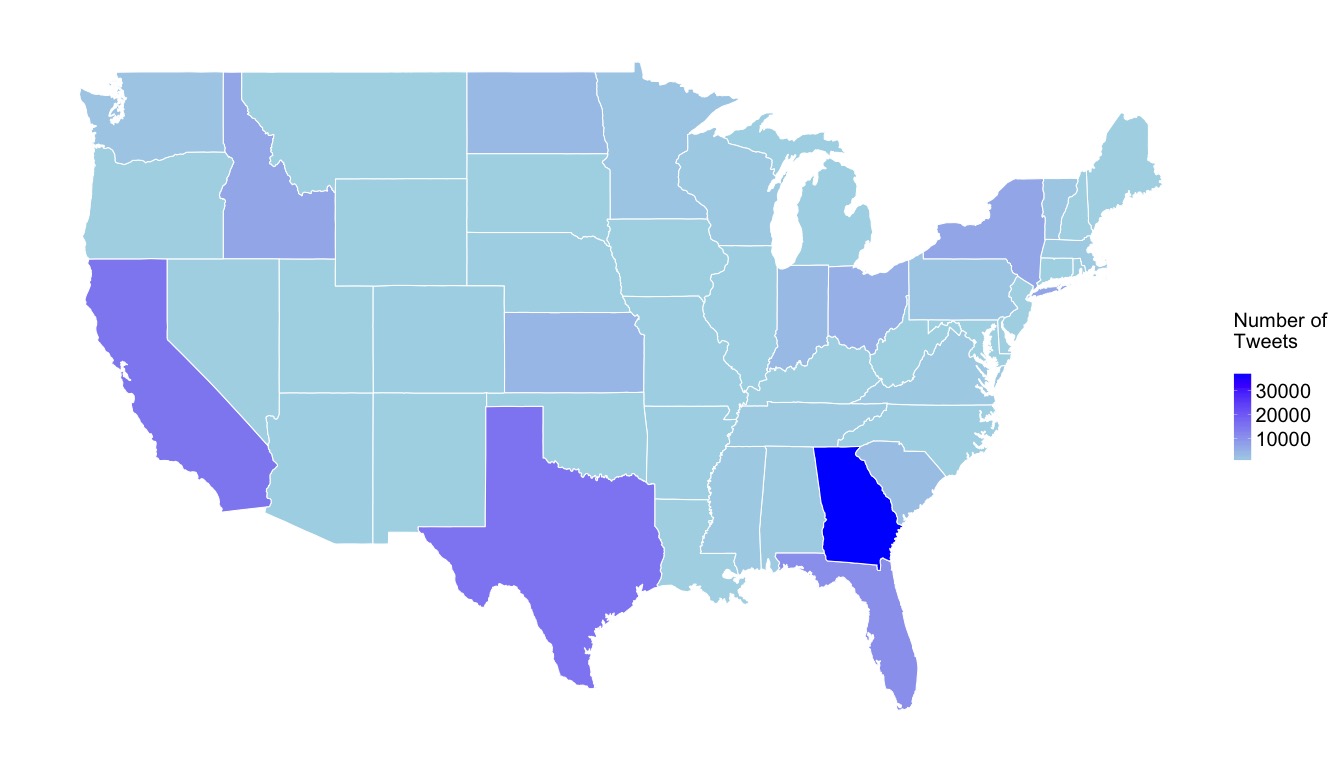
This monitor ran throughout the November 6th, 2018 election, and with the data we collected we can analyze how conversations concerning voter fraud evolved throughout this historic midterm. One of the most insightful ways we can use these data is by determining which areas of the United States faced the most criticisms about voter fraud and suppression. To that end, we used various natural language processing methodologies to determine which messages about fraud and suppression were directed at specific states. The results of this analysis is found in the following map, where we use a gradient the highlight the number how many messages about voter fraud mention a specific state. As shown in the plot below, which charts the number of tweets, we find an unusually high number of messages concerned with Georgia, where the Governor’s race between Brian Kemp and Stacey Abrams was inundated with concerns about voter suppression. For examples of news reports, you can see the articles here and here.
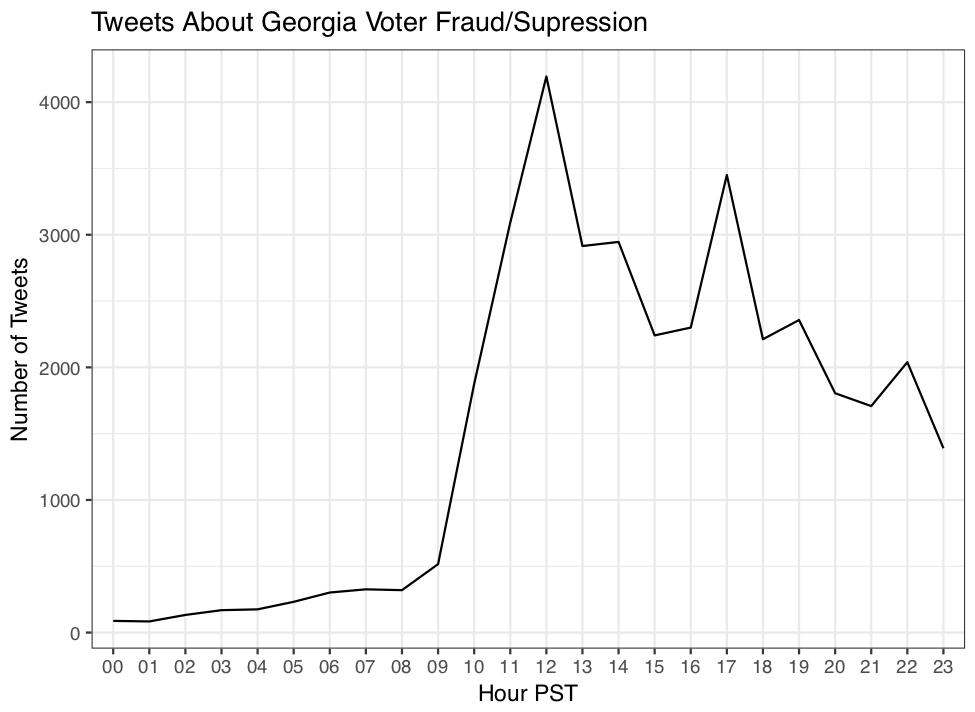
As shown in line plot below, which plots the number of tweets concerned with voter suppression in Georgia over time, our monitor detected a potential issue with Georgia as early as 12pm PST, before many media groups could widely broadcast these concerns.
As voters become more vocal about the electoral process on social media platforms, these maps and monitors serve as an important and powerful prognosis tool for officials to solve problems and citizens to discover disturbances in the voting process. Ultimately, we hope to continue developing tools to provide transparency, increase efficiency, and help understand the American electoral process.