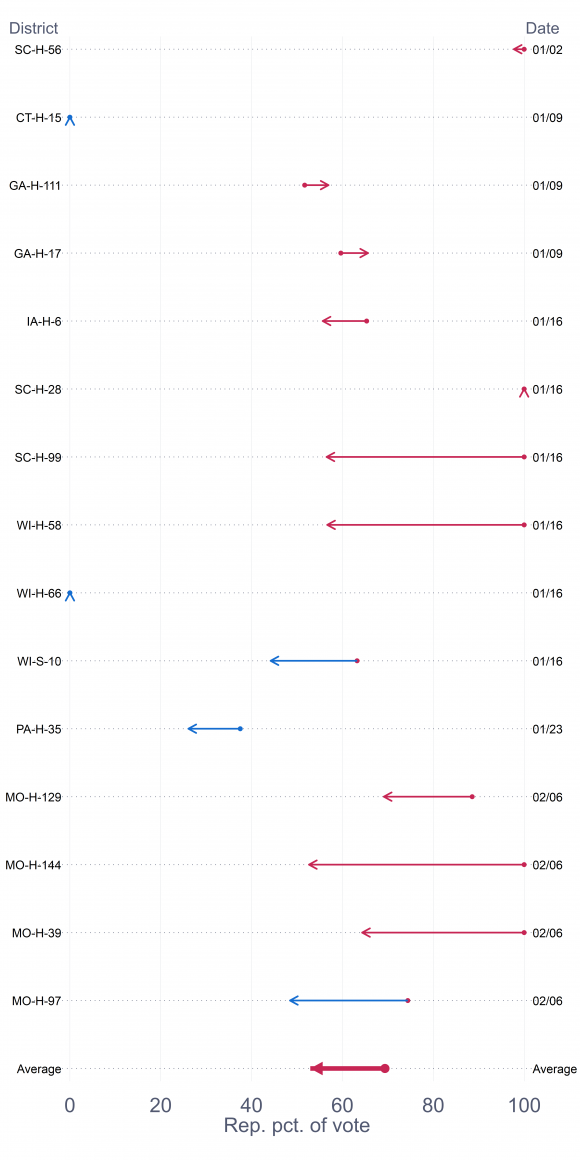
Today starts a regular feature of the MIT Election Data and Science Lab called “Special Election Watch.” The idea is to follow special elections in 2018 as a guide to the extent of the Democratic swing in the November 2018 election. First, a couple of words of background, and then a guide to the graph we will be updating regularly.
Political scientists have long followed the partisan “swing” from one election to the other. Analysis of the “uniform national swing” has been a staple of discussing British politics going back to the 1940s. The question of whether the swing is so uniform in the U.S. has a distinguished pedigree, perhaps most notably represented by a small book by Tom Mann, Unsafe at Any Margin, in 1979 and an article by Gary Jacobson, “The Marginals Never Vanished” in 1988.
Despite the fact that the partisan swing of electoral fortunes varies across districts in a particular election, the average swing across districts is a good starting point for gauging the degree to which one of the political parties will be favored.
Which brings us to the special election watch. It’s widely accepted that 2018 will be a good electoral year for the Democrats. But, by how much? One common measure is the so-called generic congressional poll. Another way to measure relative electoral strength is to calculate the change in electoral fortunes of the parties as they defend legislative seats in special elections. That’s the approach we’ll be following here.
Ballotpedia’s 2018 election calendar currently lists over 40 special elections between now and June for state legislative seats. As each one is held, we’ll be following the returns and comparing them to the results when the seat was last contested, usually in 2016. The accompanying graph shows the results for this year’s special elections up to last Tuesday. (Click on the graph to biggify it.)
Here’s the guide to how to read the graph. Each row represents a state legislative special election, with the district indicated on the left and the date of the election on the right. The code for the district is the postal state code + “H” for House or “S” for Senate + district number. The circle represents the percentage of the vote received by the Republican candidate in the last regular election; it’s red if the Republican won and blue if the Democrat won. The arrow points to the Republican percentage in the special election; the arrow is red if the Republican won the special election and blue if the Democrat won. At the very bottom, we show the average.
As of last Tuesday, taking all the special elections into account, the average swing has been about 16 points in favor of Democratic candidates.
Of course, there is more to this graph than just the average. For instance, a large number of these seats were originally won without a contest. Indeed, of the 15 elections shown here, 8 were originally won without a contest, 6 by Republicans and 2 by Democrats. Not surprisingly, the average pro-Democratic swing was greatest in the previously uncontested seats (27 points) than in the seats that had been contested (4 points). About half of all state legislative races were uncontested in 2016. If the patterns in the special elections hold in the general elections, we can expect a sharp drop in uncontested elections at the state level, which will be a significant event in itself.
This past week, there has been considerable press coverage of the special election in the 97th Missouri House district, which flipped to the Democratic column after it had given Donald Trump a large majority in 2016. While seat-flipping is certainly notable, the larger story was the overall mobilization of Democratic voters in the four Missouri districts that had special elections on the same day. Two of the districts (the 39th and 144th) had gone uncontested in 2016. The fact that these districts attracted strong Democratic candidates, one of whom came close to winning, is almost as important as the Democratic victory in the 97th, at least from the perspective of measuring the relative appeal of the two parties’ legislative candidates these days.
The 2018 election year is just starting. It’s a long way to November. However, as Gary Jacobson and Sam Kernell taught us in their classic book, Strategy and Choice in Congressional Elections, the most important events of a congressional election year happen at the beginning, when the candidates, parties, and potential backers size up the field. So far, the elections that are currently being held are consistent with even more good Democratic candidates jumping in and even more good Republicans staying (or moving to) the sidelines.