Every indication suggests that the 2018 midterm election will come in as expected from longstanding political models: seat losses in the House for the president’s party in the midterm, like usual, and a standoff in the Senate, which is also to be expected, given the specific configuration of the president’s party in 2012 and 2018. (On this latter point, see my post from yesterday by clicking here.
Despite the fact that the auguries are pointing toward a Democratic pick-up in the House, fretting is beginning to emerge over whether the pick-up might evaporate or, at the very least, may not be big enough to give the House Democrats the freedom they would like to dominate business in the House. While the former is highly unlikely, the latter does have some basis in the facts about the marginal House seats in 2018 — that is, the seats on which control of the House will turn in this election.
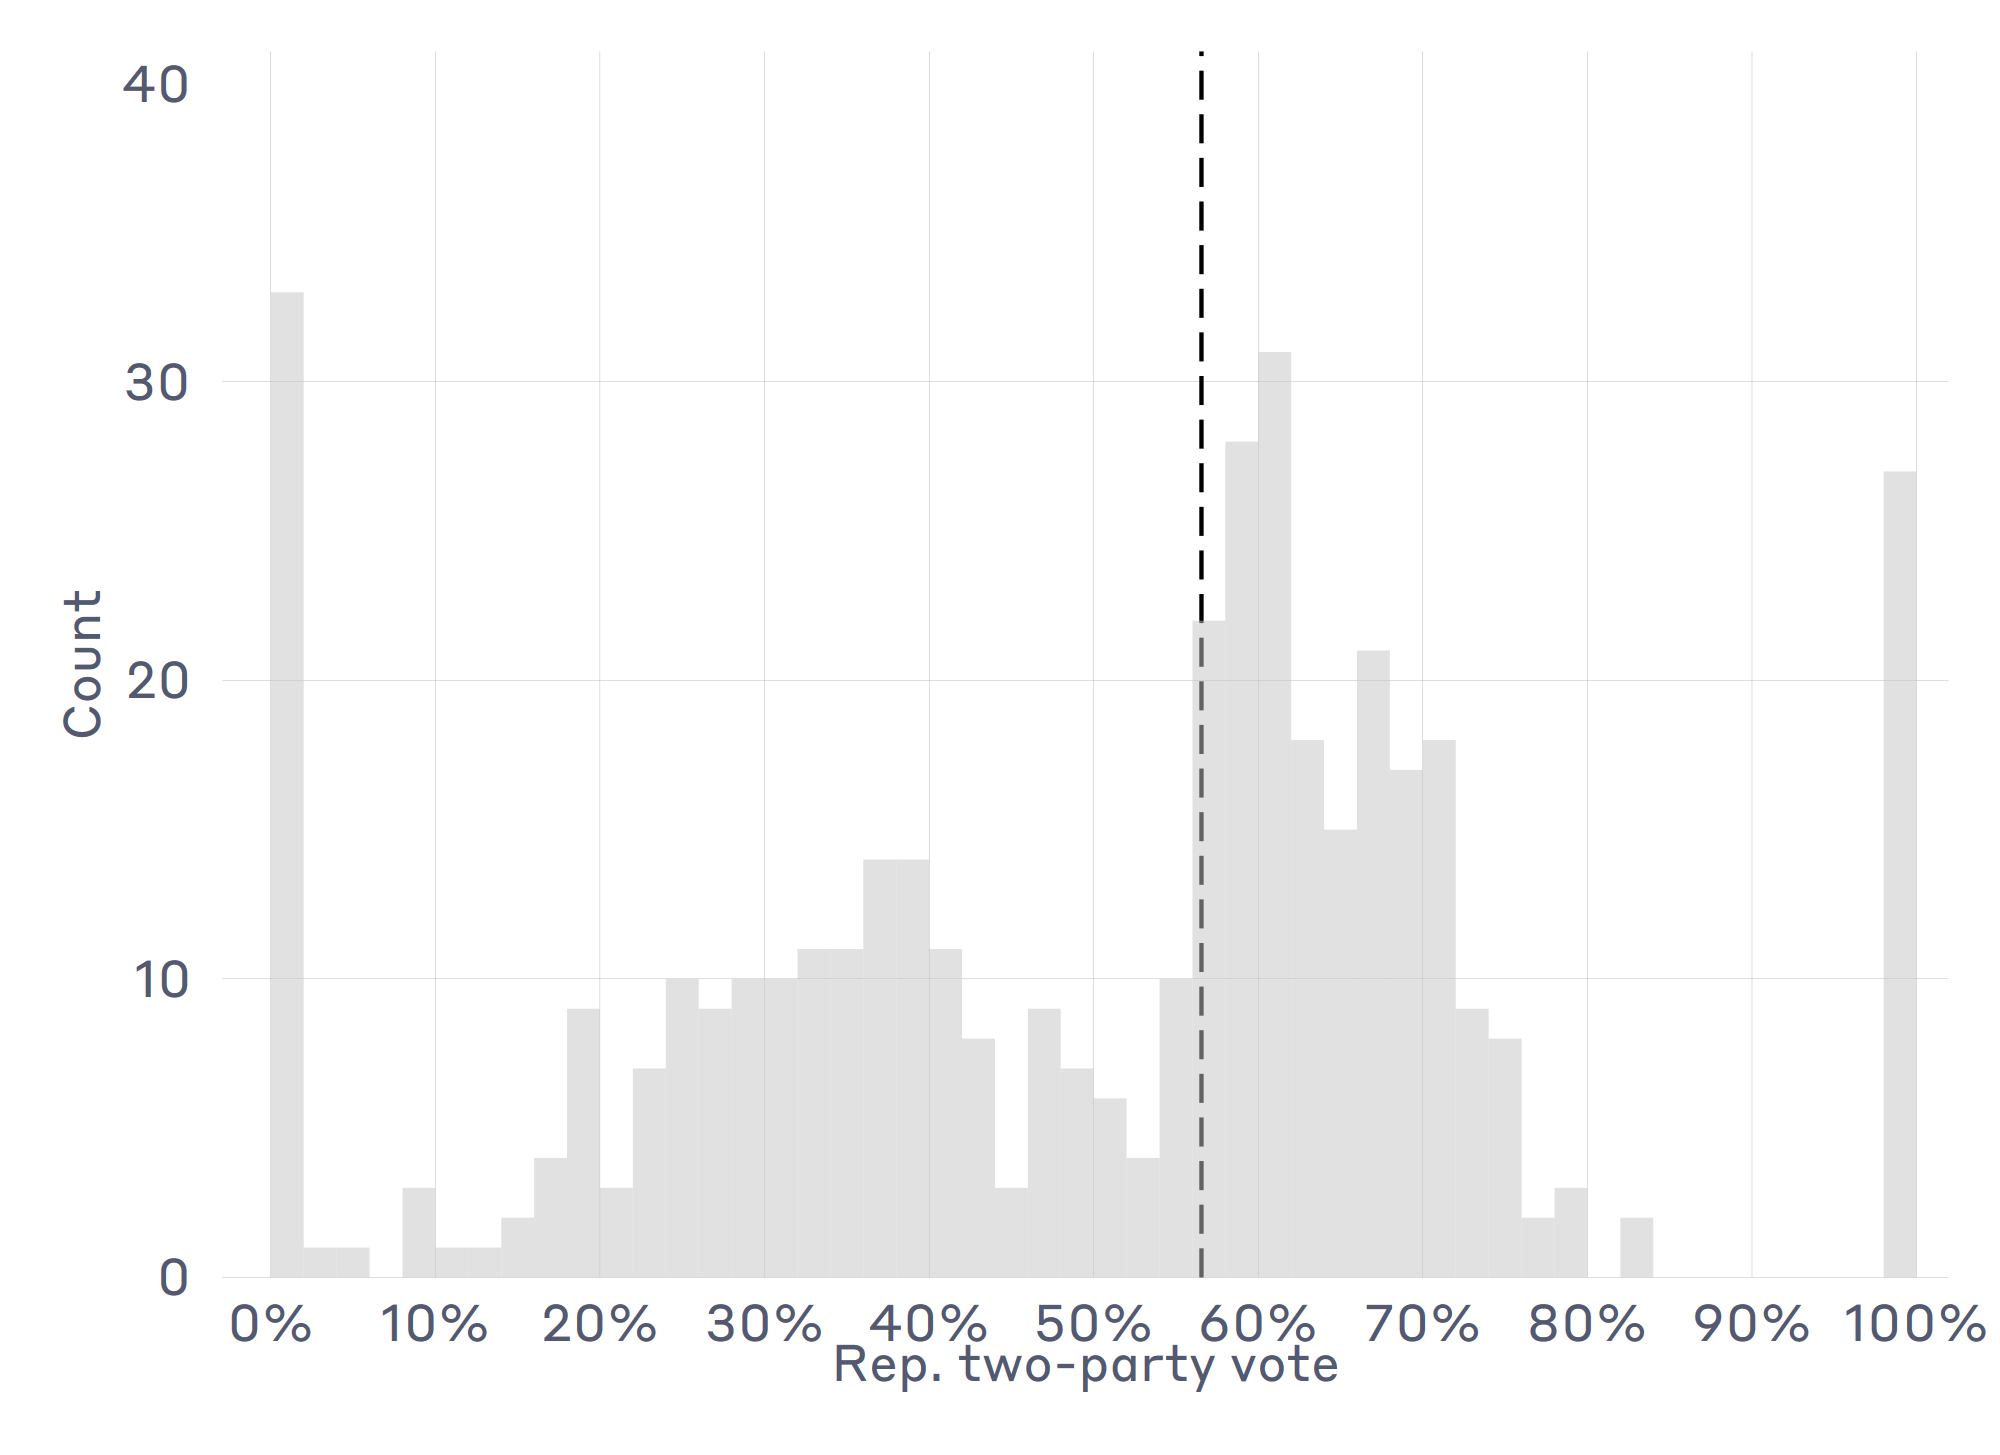 To appreciate the situation, we first need to return to the election of 2016 and the distribution of returns from the House election. The accompanying graph shows the percentage of the two-party vote received by the Republican candidate in each district. (Click on the graph to enlargify.)
The dashed line shows the location of the median district — the 218th from the left, or the district that would flip the House to Democratic control if we added the same percentage of Democratic votes to each district. That district (NC-2) had a Republican two-party vote share of 56.7% in 2016. Thus, if we were to shift the entire distribution to the left by 6.7 points, we get a majority of Democratic seats.
Note, however, that the median district is located right as the fat part of the two-party vote-share distribution begins for Republicans. This means that if the shift in vote share from 2016 is just slightly less than 6.7 points, it won’t make much of a difference in the party distribution of the House — other than the fact that Republicans still control it — but if we shift it slightly more than 6.7 points, it makes a huge difference. If, for instance, the shift is a point greater, at 7.7 points, Democrats control the House with 14 seats to spare; at a shift of 8.7 points, Democrats control the House with 25 seats to spare.
As of right now, the FiveThirtyEight models are consistent with a shift of about 8.5 points compared to 2016. That’s consistent with a healthy Democratic majority, but also notice that because of the distribution of partisan support in the pivotal districts, it’s possible for the actual outcome to significantly over- or under-shoot that mark. It’s for that reason that the Democrats’ fortunes are in “boom or bust” territory: If they come in slightly ahead of expectations on the popular vote, they will have a healthy majority to control the chamber with. If they come in slightly behind expectations, controlling the chamber will be very, very difficult, from a practical perspective.
Caveats and conclusions
The analysis I just performed is a simplistic version of “uniform swing analysis,” which has been around in political science for a century. The advantage of uniform swing analysis is that it gives us intuitions about how more sophisticated modelling techniques work. Without reference to the 2016 two-party vote distribution, for instance, it is not necessarily clear why the various modelers are hedging their predictions a bit. All models are uncertain, of course, but 2018 is especially uncertain because of how partisan support arrays itself among the pivotal House districts.
On the whole, new- and old-school of models midterm elections are pointing to a Democratic pick-up of seats in the House. The degree of that pick-up is hard to nail down at this point, mainly because of the districts that are in play.