Charles Stewart III
One week to go.
The Healthy Elections Project has been running a series of surveys in a half dozen battleground states, asking how voters intend to cast their ballots. I have previously published thoughts on Florida, North Carolina and Wisconsin, with a bonus posting about Georgia (where we are not surveying, ourselves.) This brief note focuses on Arizona.
First, as to the intentions themselves. The table below shows that there was very little movement in reported intentions across the first three waves of the surveys, but in the last one, there is a move away from Election Day voting, in favor of voting by mail. For that reason, I’m going to focus this analysis just on the last wave of the survey.
|
Vote mode intention among likely voters, including don’t knows |
|||||
| Date | Election Day | Early | Don’t know | N | |
| Sept. 4 – Sept. 11 | 24.3% | 7.8% | 66.1% | 1.8% | 493 |
| Sept. 16 – Sept. 25 | 28.7% | 10.6% | 57.9% | 2.9% | 477 |
| Sept. 30 – Oct. 9 | 27.1% | 11.4% | 58.1% | 3.4% | 496 |
| Oct. 14 – Oct. 21 | 16.6% | 12.6% | 68.8% | 2.0% | 495 |
|
Total |
24.1% |
10.6% |
62.8% |
2.5% |
1,962 |
|
Vote mode intention among likely voters, excluding don’t knows |
||||
|
Date |
Election Day |
Early |
|
N |
|
Sept. 4 – Sept. 11 |
24.7% |
8.0% |
67.3% |
484 |
|
Sept. 16 – Sept. 25 |
29.5% |
10.9% |
59.6% |
463 |
|
Sept. 30 – Oct. 9 |
28.1% |
11.8% |
60.1% |
479 |
|
Oct. 14 – Oct. 21 |
16.9% |
12.8% |
70.3% |
485 |
|
Total |
24.8% |
10.9% |
64.4% |
1,911 |
(By the way, the overall 95% confidence interval for all four waves combined is around +/- 2.2 points. For any one wave, it’s around 4.4 points.)
Second, to convert these expectations to raw numbers, we need an estimate of turnout. In previous memos, I’ve done this by adding 10% to 2016 turnout and then utilizing a simple regression model. Since then, I have come across the state-level turnout estimates that are produced as a byproduct of the FiveThirtyEight presidential election forecasting model, and so I’ll use those instead. For Arizona, the low and high estimates are 2.7 and 3.7 million, respectively, which is what I’ll use here. (For the record, a 10% increase would get you 2.7 million and the regression technique would get you 3.5 million.)
Third, here is what the combination of numbers above imply for the final distribution of votes in Arizona, by mode:
| Vote mode, combining four waves of survey | |||
| Assumed turnout | Election Day | Early | |
| 2.7 million | 456k | 345k | 1.898M |
| 3.7 million | 625k | 474k | 2.601M |
Fourth, a final calculation needs to be made, if we want to estimate the number of mail ballots that will be requested, since not all mail ballots are returned. For the states that make their absentee ballot files available, it appears that in 2016, around 85% of requested mail ballots were returned. If that return rate holds for Arizona, then it should expect between 2.2 million and 3.1 million requested ballots. Of course, with the large size of the Arizona permanent absentee list, I should put the word “requested” in quotes (which I just did), because most of these requests didn’t even need to be made for this election.
I’m relying on data being collected and reported on a private website maintained by Data Orbital. The most recent report from Arizona, which is updated to yesterday (October 26) states that 3,343,186 ballots have been requested and 1,816,615 returned.
One thing to keep in mind is that according to Michael McDonald, Arizona combines early in-person and mail voting statistics, so we can’t distinguish the two. For that reason, we need to combine both early in-person and mail balloting figures to come up with the comparable statistics that are reported by Arizona. On the request side, we need to add expected in-person early votes to estimates mail requests, which get us an equivalent of 2.5 million to 3.6 million estimated requests. We then need to add together the in-person early and mail ballot numbers, to get between 2.2 million and 3.1 million estimated early votes.
Over the past week, Arizona has been averaging 118,000 returned ballots per day. Applied to the eight remaining days before Election Day, that works out to 944,000 additional ballots to be returned. If we add this to the 1.8 million already returned, we get an estimate of 2.7 million early votes eventually to be returned, which is within the estimated range from previous paragraph.
These early voting estimates can be summarized in the following graph:
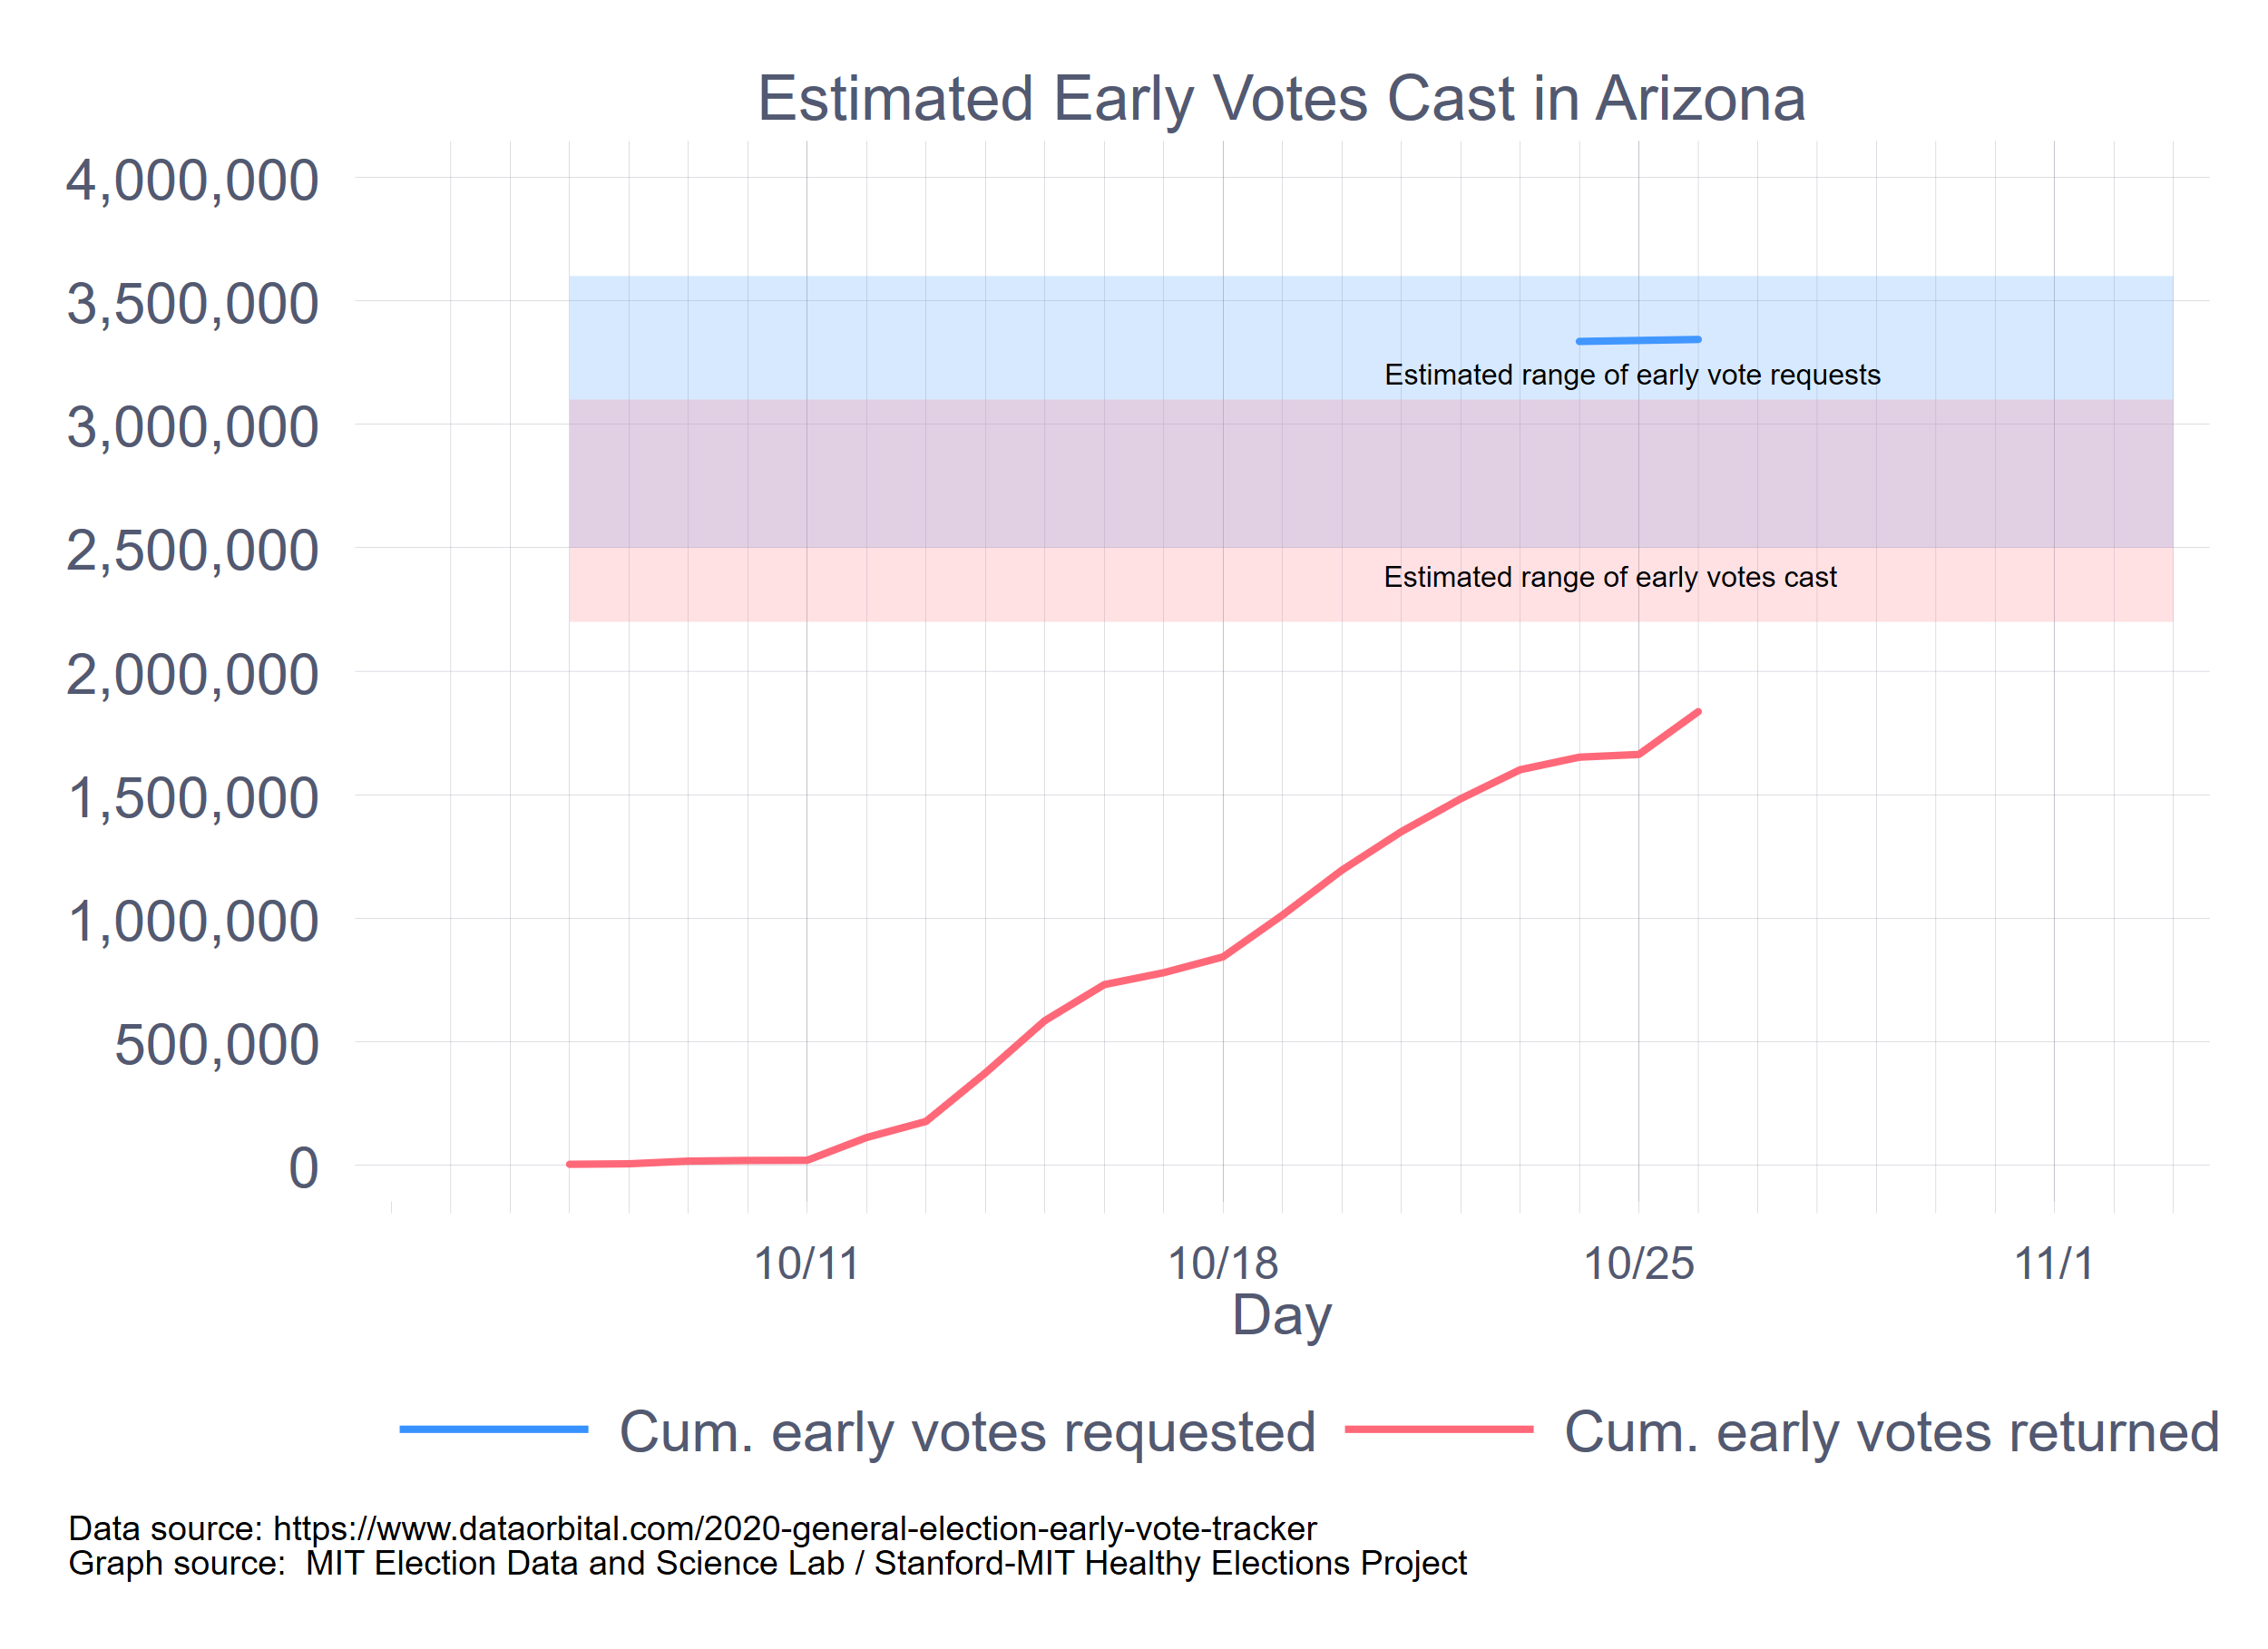
Note that the 2.7 million early votes that I estimate will be returned, if Arizona keeps on its current track, is 100% of the lower estimate for total turnout. Obviously, Arizona will see some degree of turnout on Election Day, but how much? The midpoint of the two turnout estimates is 3.2 million. Taking that as the turnout point estimate, then we get an estimate of 500,000 to turn out on Election Day. This is only slightly below the half-way point between the high and low estimates of Election Day voting first calculated above, which suggests that an Election Day turnout level in the range of 500,000 to 600,000 on Election Day would not be out of the question.