Today the Election Law @ Moritz program is hosting this conference, HAVA @ 10. Fellow Election Updates bloggers Gronke, Hall and Stewart are in attendance — looking forward to hearing their comments and remarks!
Latest article on election forensics
The latest edition of Political Analysis just landed in my in-box, with an article by Bernd Beber and Alexandra Scacco entitled “What the Numbers Say: A Digit-Based Test for Election Fraud.” Here is the abstract:
Is it possible to detect manipulation by looking only at electoral returns? Drawing on work in psychology, we exploit individuals’ biases in generating numbers to highlight suspicious digit patterns in reported vote counts. First, we show that fair election procedures produce returns where last digits occur with equal frequency, but laboratory experiments indicate that individuals tend to favor some numerals over others, even when subjects have incentives to properly randomize. Second, individuals underestimate the likelihood of digit repetition in sequences of random integers, so we should observe relatively few instances of repeated numbers in manipulated vote tallies. Third, laboratory experiments demonstrate a preference for pairs of adjacent digits, which suggests that such pairs should be abundant on fraudulent return sheets. Fourth, subjects avoid pairs of distant numerals, so those should appear with lower frequency on tainted returns. We test for deviations in digit patterns using data from Sweden’s 2002 parliamentary elections, Senegal’s 2000 and 2007 presidential elections, and previously unavailable results from Nigeria’s 2003 presidential election. In line with observers’ expectations, we find substantial evidence that manipulation occurred in Nigeria as well as in Senegal in 2007.
Here is the link to the table of contents, though I suspect that gaining access to the article will depend on whether your at an academic institution that subscribes to Oxford journals.
I can’t wait to dig into the details.
And, while it’s not on the topic of election forensics, elections maven Susan D. Hyde has an article with Nikolay Marinov in the same issue with the title “Which Elections Can Be Lost?” which is about how to measure the competitiveness of elections.
If the public “thinks” something is a problem, does that make it a problem? Voter ID and the new Rasmussen Poll
The new Rasmussen Poll on voter ID opens with this tendentious lead-in:
Despite his insistence that voter fraud is not a serious problem, Attorney General Eric Holder was embarrassed last week when a video surfaced of someone illegally obtaining a ballot to vote under Holder’s name in his home precinct in Washington, D.C.
First, le’s remind ourselves of what really happened: an activist showed up at a DC voting location, asked “Do you have an Eric Holder,” identified their ward location, identified how the name was spelled, and then said their name was “Eric Holder,” and then refuses to sign his name.
No ballot was obtained.
No fraudulent votes were cast.
And the activist, if he’d been stupid enough to sign, would have committed a felony.
Yet this is evidence of a “serious problem”? Perhaps the problem is uncritical media attention to what was essentially a non-event. Here is some context to judge this polling result:
- Throughout most of the 1940s and 50s, approximately 25% of the public expressed support for poll taxes, and another 10-15% were undecided.
- In 1986, 21% of respondents still thought it was “true” that the “US Constitution permits a state to require a literacy test before a citizen could register to vote.”
- 55% of respondents in a 2007 poll said that someone who could not speak English should not be allowed to vote.
- (Results courtesy of the Roper Center / Gallup).
Luckily, we don’t allocate fundamental democratic rights by public opinion poll.
Another cool panel on election rules, procedures, and voter choice
One of our bloggers is on this panel as discussant. Andre Blais is principal investigator for “Making Electoral Democracy Work,” a very interesting sounding comparative elections project coming out of the Canadian research system. Finally, if memory serves (confirmed from his website), Garrett is one of Mike’s many successful graduate students. Aha! And Morgan is on this panel, too! Guess I’m waking up early again tomorrow.
25-3 Election Procedures: The Impact of Polling Places, Ballots, and Voting Systems
Date: Friday, April 13 8:30 am
Chair(s): Andre Blais, Université de Montréal
Paper(s): Does the Location of a Polling Place Influence Voting Behavior?: Voting in Churches and Support for Proposition 8
This paper examines whether support for California’s Proposition 8 (banning gay marriage) was higher in those voting precincts that used churches as their polling place as compared to those precincts that used some other type of public building.
Garrett Glasgow, University of California, Santa Barbara
Straight-ticket Scapegoat? The Impact of the Straight-ticket Option on State Legislative Contests
An analysis of 1990s Illinois state legislative electoral returns demonstrates that the removal of the straight-ticket option from state ballots may have been counterproductive to partisans seeking an advantage via changes to the ballot design.
Michael Allen Lewkowicz, Georgia Gwinnett College
The Effect of Electronic Voting on Voter Behavior and Representation
This paper tests the hypothesis that electronic voting effects voter behavior and representation, relative to paper voting. Using ballot level data, we analyze voter expression and choice conditional on an individual’s voting technology choice.
Morgan Llewellyn, Institutions Markets Technologies, Lucca
The Effects of Ranked-choice Voting Systems on Racial Group Voting Behavior in Urban Elections
An examination of strategic racial cross-over voting in two ranked-choice voting urban mayoral elections. Data are individual ranked-choice ballots with race of voter estimated via a modified ecological inference procedure.
Jason Alan McDaniel, San Francisco State University
James Newburg, Brown University
Prevalence and Moderators of the Candidate Name Order Effect: Evidence from all Statewide General Elections in California
Does the order of candidates’ names on the ballot have the power to alter vote shares and change election outcomes? This research re-evaluates conflicting results of order effects in California elections, revealing a consistent pattern of influence.
Josh Pasek, University of Michigan
Jon Krosnick, Stanford University
Alexander Moss Tahk, Stanford University
Discussant(s): Andre Blais, Université de Montréal
Charles H. Stewart, Massachusetts Institute of Technology
Strategic Voting and Election Laws
This panel looks cool! My students have been big fans of election rules, laws, and strategic voting.
Chair(s): Ken Kollman, University of Michigan
Paper(s): Voting Behavior in Dual Ballot Contests: The Case of French Presidential Elections
Using survey data from French presidential elections, we examine the extent to which voters’ strategies differ in dual ballot contests. Specifically, we explore if the differences demonstrate some kind of sophisticated behavior on the part of voters.
Eric Belanger, McGill University
Mathieu Turgeon, Universidade de Brasilia
Duverger’s Law and Information: The Role of Media Availability in the Relationship Between Electoral and Party System
This paper examines whether variation in the availability of reliable election information from the media affects coordination on two parties in single member plurality systems.
Emily Clough, Newcastle University
Estimating Strategic Voting at the District Level
We present the first approach to estimate strategic vote transfers at the district level. Using data from British General Elections we examine, among other things, how many constituencies changed hands due to strategic votes.
Michael Herrmann, University of Konstanz
Simon Munzert, University Konstanz
Peter Selb, University of Konstanz
Every Election You May Make Progress: The Gradual Impact of Electoral Reform on Voting Behavior
Using a regression discontinuity design, the paper addresses the question of how electoral reform changes the voting behavior of young people. In order to test the arguments, the 1994 New Zealand electoral reform is examined.
Pedro Riera, European University Institute
Choice, Information and Complexity: Voting Behaviour in Swiss Elections
The Swiss open ballot PR electoral system allows voters to cast a customized ballot but doing so requires considerable political information. We consider who customizes their ballot using survey data from the Making Electoral Democracy Work project.
Laura B. Stephenson, University of Western Ontario
Marian Bohl, University Zurich
Ekrem Karakoc, Pennsylvania State University
Andre Blais, Université de Montréal
Hanspeter Kriesi, University Zurich
Discussant(s): Steven J. Brams, New York University
Ken Kollman, University of Michigan
Data ARE awesome, graphics maybe less so
Doug Chapin just doesn’t have enough snark.
He rightly lauds the District of Columbia’s election office for making detailed early voting information easily accessible.
But then he puts this put this graphic up front: Mike DeBonis? Ick!  I guess it’s colorful!
DeBonis did a nice job cranking out the figures, but he commits a few mild sins in his presentation. The most common is to express the numbers of early voters are raw numbers rather than percentage of registered voters, but the largest ward has 42% more voters (party registration figures vary even more–by 70%). This makes Ward 2 look like it’s casting fewer early votes, but it is the smallest ward. But using proportions would actually expand some of the differences (DeBonis deserves credit when he compares by party).
But you’d need to take a few more swipes to really show what Doug notes: how early voting varies by “campaign and candidate specific factors.” I think he’s probably right, but as DeBonis notes, early voting can take place at any of eight locations, so the interesting cut here would be to compare the ward of residence with ward of vote. I can’t find the original data on the DCBOEE website to see if that’s possible.
New edition of California Journal of Politics and Policy, articles on election reform
I just got sent the new edition of the California Journal of Politics and Policy, and there are a number of excellent papers related to election reform. The articles all seem to be freely distributable as PDFs at this point. All articles are linked below.
Introduction–Dedication to Tim Hodson
Reforming California: Political Patchwork versus a Constitutional Convention
Di Sarro, Brian; Hussey, Wesley; Lascher, Edward L.
Redistricting California: An Evaluation of the Citizens Commission Final Plans
Kogan, Vladimir; McGhee, Eric
The Top Two Primary: What Can California Learn from Washington?
Donovan, Todd
Power to the People: Checking Special Interests in California
Gordon Fisher, Stacy B.; Nalder, Kimberly L.; Lesenyie, Matthew
The Limits of Citizen Support for Direct Democracy
Dyck, Joshua J.; Baldassare, Mark
Administering Democracy: Public Opinion on Election Reform in California
Bergman, Elizabeth
Do clean elections produce extremists?
Nice paper being presented at next week’s Midwest Political Science Association meeting, and blogged by Seth Masket here:
http://enikrising.blogspot.com/2012/04/imagine-no-campaign-donations-its-easy.html
Michael Miller, his collaborator, has written about clean elections in the Election Law Journal.
Simple Ways to do Risk Limiting Auditing
I’m at the Election Verification Network Conference being held in my home town of Santa Fe, New Mexico.
We’ve heard some great talks on ballot security, usability, Internet voting , election auditing, etc.
I’d like to highlight a talk by Philip Stark on a fairly simple process that states could employ to do a risk limiting post election audit. I’ve provided links below to his slides and papers on this topic.
Today’s slides are here:
http://statistics.berkeley.edu/~stark/Seminars/evnLongView12.pdf
http://statistics.berkeley.edu/~stark/Seminars/evnGOTA12.pdf
His paper that talks about ballot-polling audits is here:
http://statistics.berkeley.edu/~stark/Preprints/gentle12.pdf
His paper on evidence-based elections is here:
http://statistics.berkeley.edu/~stark/Preprints/evidenceVote12.pdf
The NYT article on Fla. third party voter registration misses the big story
Today’s New York Times article on the effect of HB 1355 on the activity of third party voter registration groups misses the most important voter registration story in Florida.
The more important story is the fact that voter registration from all sources has crashed, from the heights leading up to the elections of 2000 and 2004. Maybe HB 1355 is seriously restricting the ability of third party groups to register voters. But, why not an article about why the number of voter registrations in Florida over the 2005-08 cycle fell 54% compared to the 01-04 cycle, or 36% compared to the 97-00 cycle?
Here are the basic patterns, gleaned from a great set of reports on the Florida Elections Division web site.
First, I simply took the monthly totals in these reports and plotted the totals against month in the four-year cycle between presidential elections. Here is that picture.

A little explanation: I have broken down the data into four periods, each corresponding to the four-year period proceeding the elections of 2000, 2004, 2008, and 2012. The thin solid line shows the number of new voter registrations filed in Florida for the four years leading up to the 2000 presidential election — 1997, 1998, 1999, and 2000. The dashed line traces out the same numbers for the period leading up to the 2004 election; the dotted line pertains to the period before the 2008 election; and the dark solid line traces out the number of registrations each month leading up to the 2012 general election. With the exception of the time series associated with 2012, there are 48 data points represented for each election. For 2012, the most recent report is for February 2012, so the line ends there.
Two things stand out in this figure. (Click on it for a larger version that is easier to read.) The first is that in 2000, 2004, and 2008, there was a big peak toward the end of the year, right before the general election. (There were smaller peaks early in 2000 and 2004, corresponding with the presidential preference primaries, but not in 2008, or apparently, in 2012.) The second thing that stands out is how the time series for 2000 and 2004 are at much higher levels than the two time series for 2008 and 2012. Indeed, close inspection reveals where the world changed — February 2006, where the dotted line takes a sharp dive downward, never to join the time series for 2000 and 2004 again.
Thus, the first thing that needs to be said is that, compared to 2000 and 2004, voter registration levels are at surprisingly low levels in Florida. What happened? I wish the New York Times would write about that. Unfortunately, there’s not a high-profile law to blame, so the explanation is going to take some work.
One of the reasons the top-line numbers in Florida are so interesting is that when we dive deeply into the sources of registration, the fall-off in registration numbers appear everywhere. Here are graphs that show the number of registrations, according to the source of the registration. For the period covered by the Election Division reports, the most common source of voter registration is through the Department of Highway Safety and Motor Vehicles (DHSMV). Here is the graph of registrations received at this source, by month:
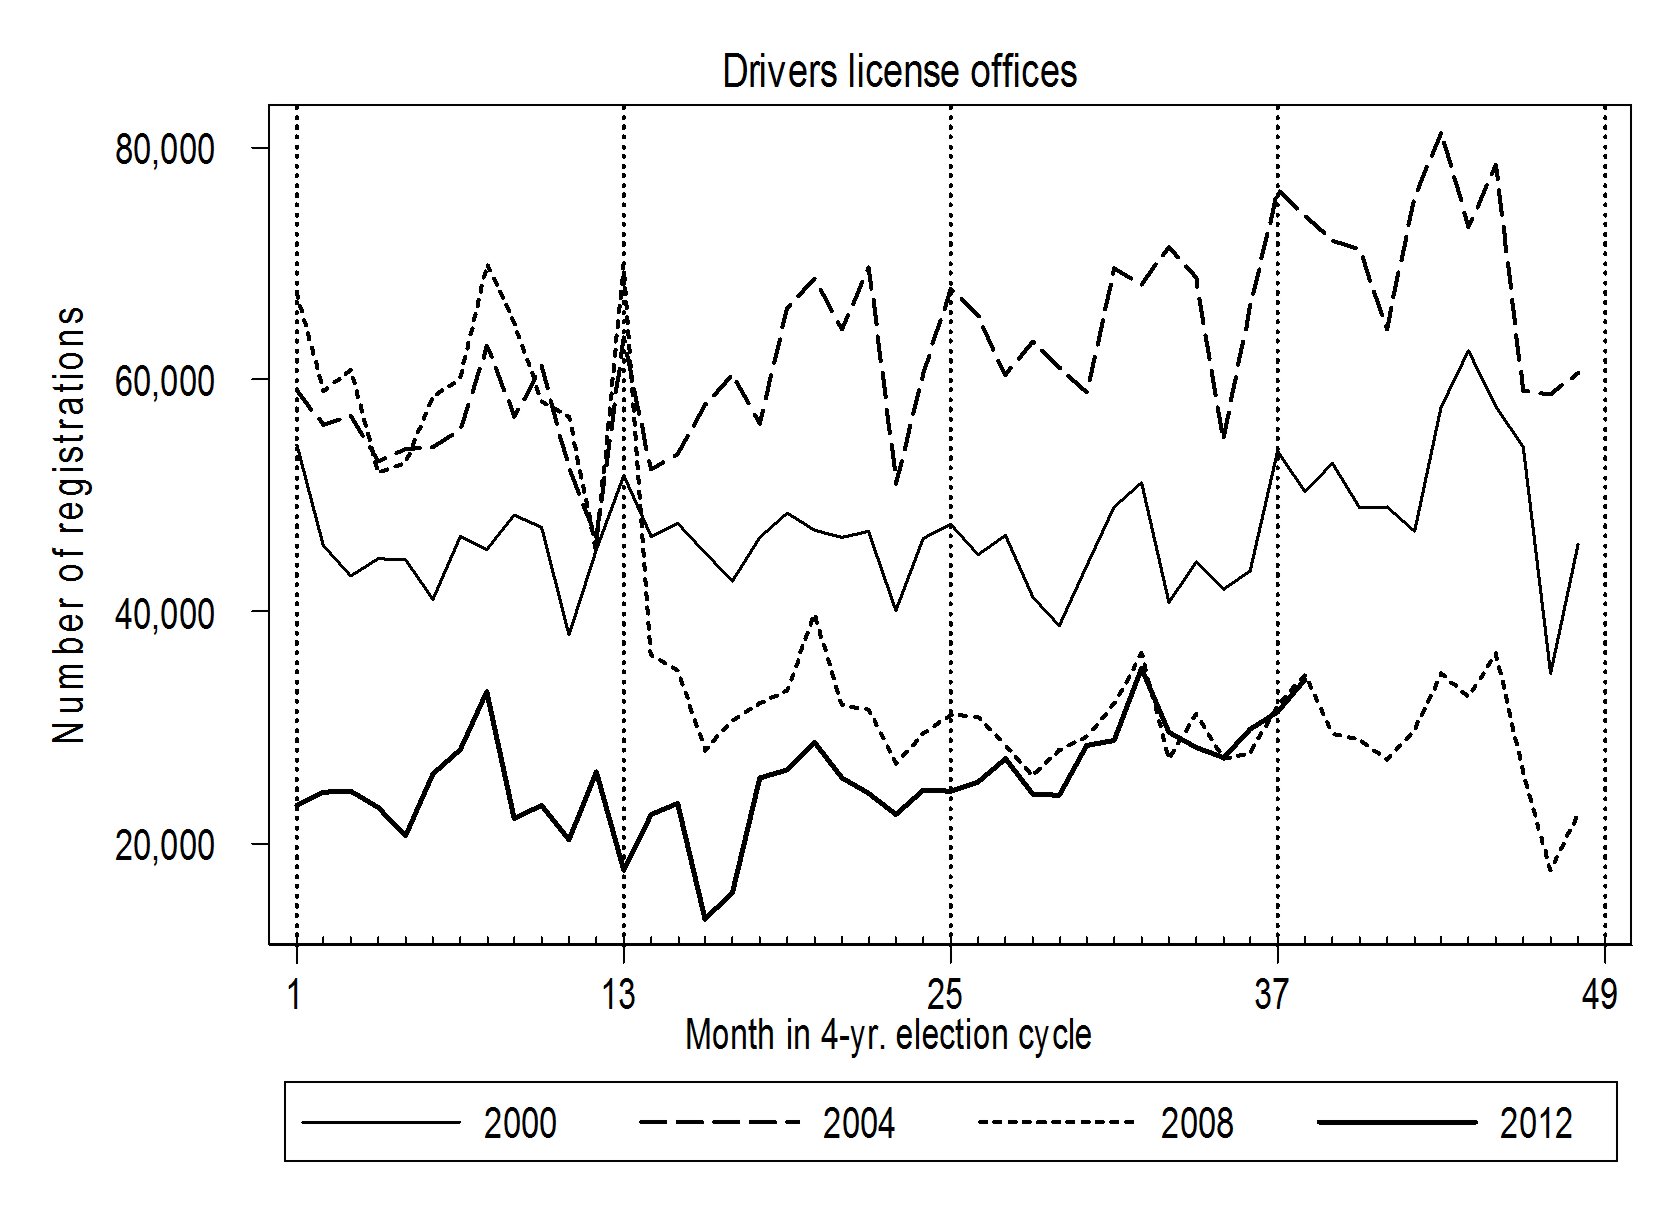 Compared to the other sources of voter registration in Florida, the DHSMV is fairly steady. That said, the early-2006 crash seen in the overall totals is evident in this graph. This is perhaps related to the roll-out of the new Florida Voter Registration System. I would like to hear from anyone who knows the full story.
Looking at the dark solid line, which indicates the current trend in this time series, we see that the number of new voter registrations originating in drivers license offices was historically low after the election of 2008. It continued at about half the rate of four years before for all of 2009, and significantly underperformed the last midterm election year in 2010. Last year, however, the number of voter registrations coming from the DHSMV has tracked closely the number originating there four years before.
The number-two source of voter registrations in Florida for the past decade has been the mail route. The following chart shows the number of voter registration forms received by mail each month in Florida over the past four presidential election cycles:
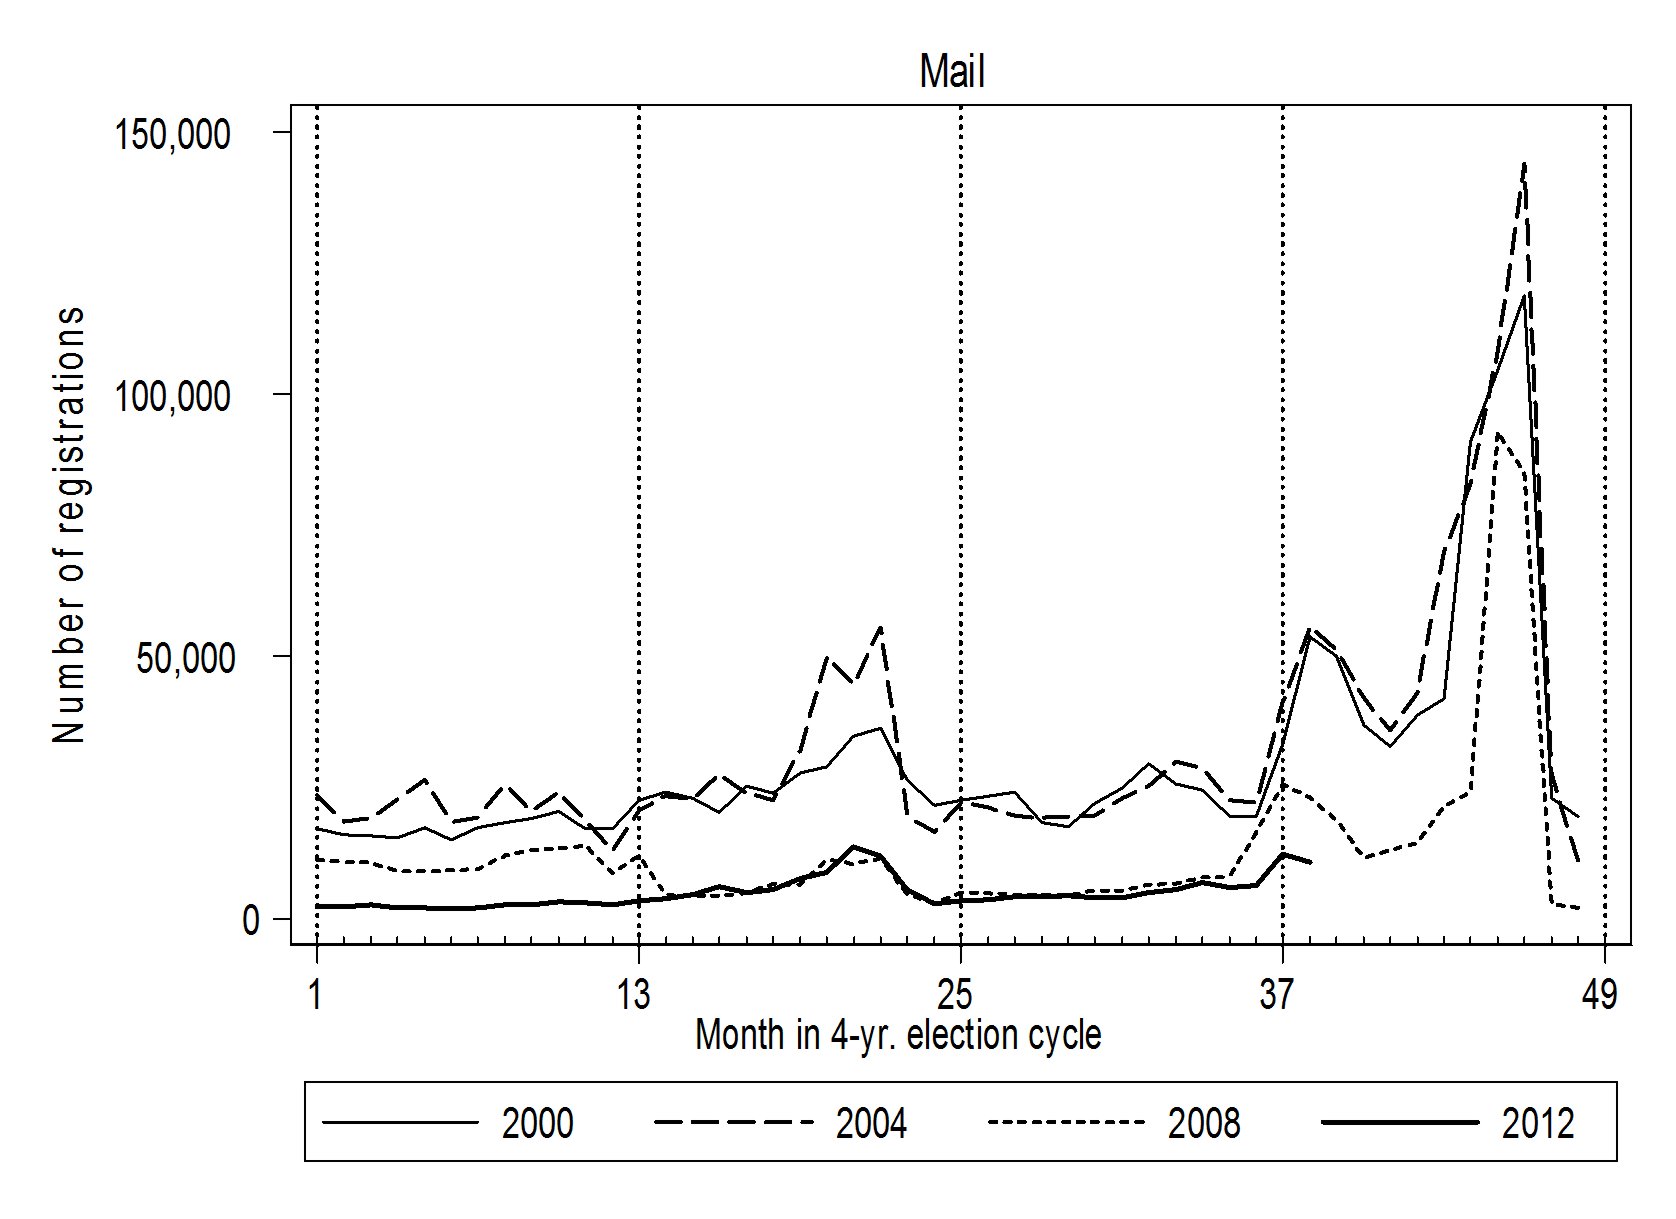
The pattern of the registration number is highly seasonal, with large spikes around each of the general elections, along with the presidential preference primaries. Again, we see a steep decline in the number of so-called “post card” registrations in early 2006, which parallels the steep decline in overall registrations and in registrations processed through drivers license offices. The number of registration forms that were mailed in was highly depressed in 2009, compared to 2005, and then kept pace in 2010 (compared to 2006). The pattern of registrations received via the mails in the current cycle diverged significantly from the pattern four years ago in December of last year. Whether this is an indirect indicator of a depression of third-party voter registration is unknown. What is clear is that the total number of registration forms received by mail for the current presidential cycle is about half of what it was for the comparable period leading up to the 2008 election, and only about one-fifth what it was in 2000 and 2004.
The number-three source of voter registrations in Florida for the past decade has been the “other” category, which lumps together two substantively important source of voter registrations: registrations generated by third-party voter registration drives, and registration forms filled out at the office of the county Supervisor of Elections. The following graph shows how these numbers have fluctuated over the past four presidential election cycles:
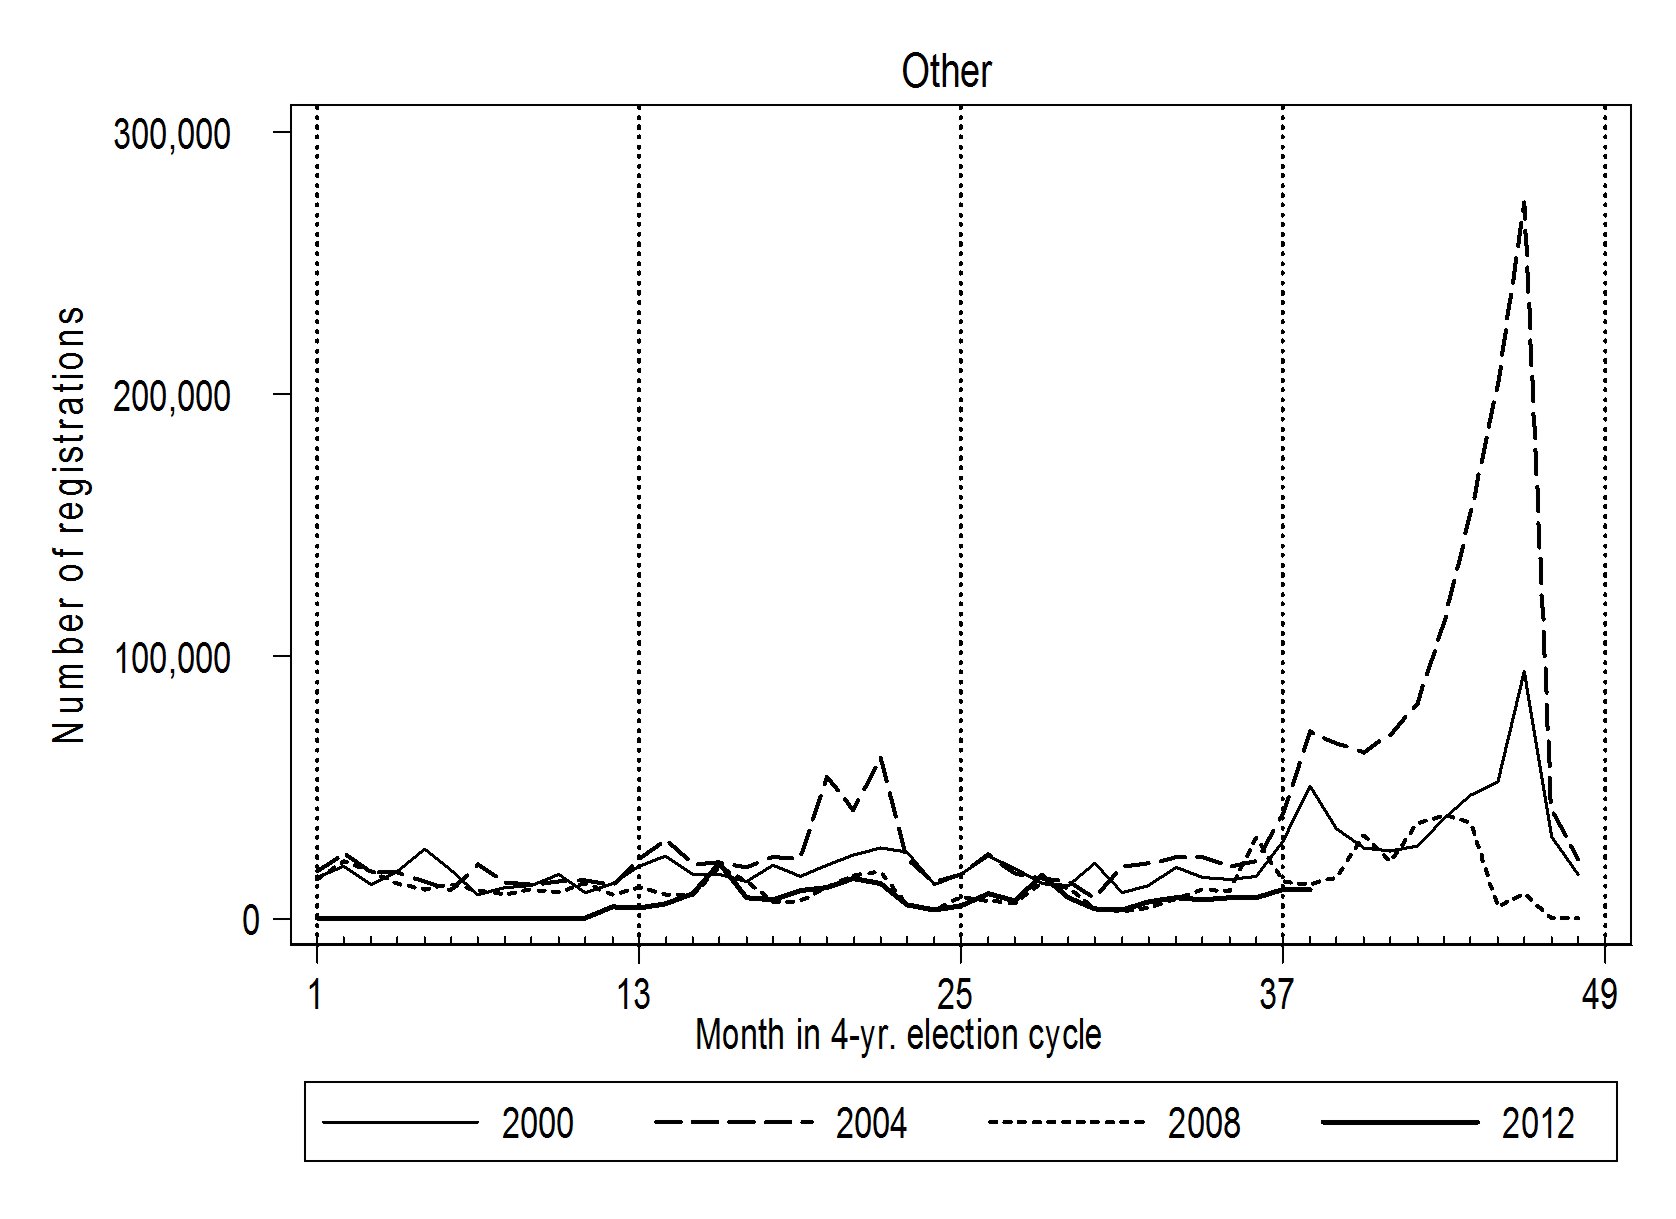
Unlike registrations coming from the drivers license bureau, registrations coming from “other” sources are very much a seasonable phenomenon. By far, the biggest spike in the data occurred in the fall of 2004, when over a quarter million registration forms from these sources were received in September and October, with another 240,000 in August. No other months in the whole time series even come close to these.
In the current presidential cycle, the number of registrations coming in through this channel is dramatically below recent history — a pattern that emerged well before the passage of HB 1355. Indeed, the number was effectively zero in 2009. In 2010 and 2011, it rose to numbers comparable to four years before. Since the passage of HB 1355, the number of registrations attributed to this category has run behind the benchmark rates of four years ago. However, it should be noted that beginning with January 2012, the state has begun accounting for the number of third party registrations separately from the number of registration forms turned filled out at the county election office. Those reports suggest that the third party registration figures are only about 10% of the “other” category. Of course, if the gist of the New York Times article is correct, these numbers are depressed below what they could have been, had HB 1355 not passed. Still, past patterns indicate that the number of registration forms originating from this part of the system is likely to be small until mid-year. Stay tuned, as more reports roll out in the coming months.
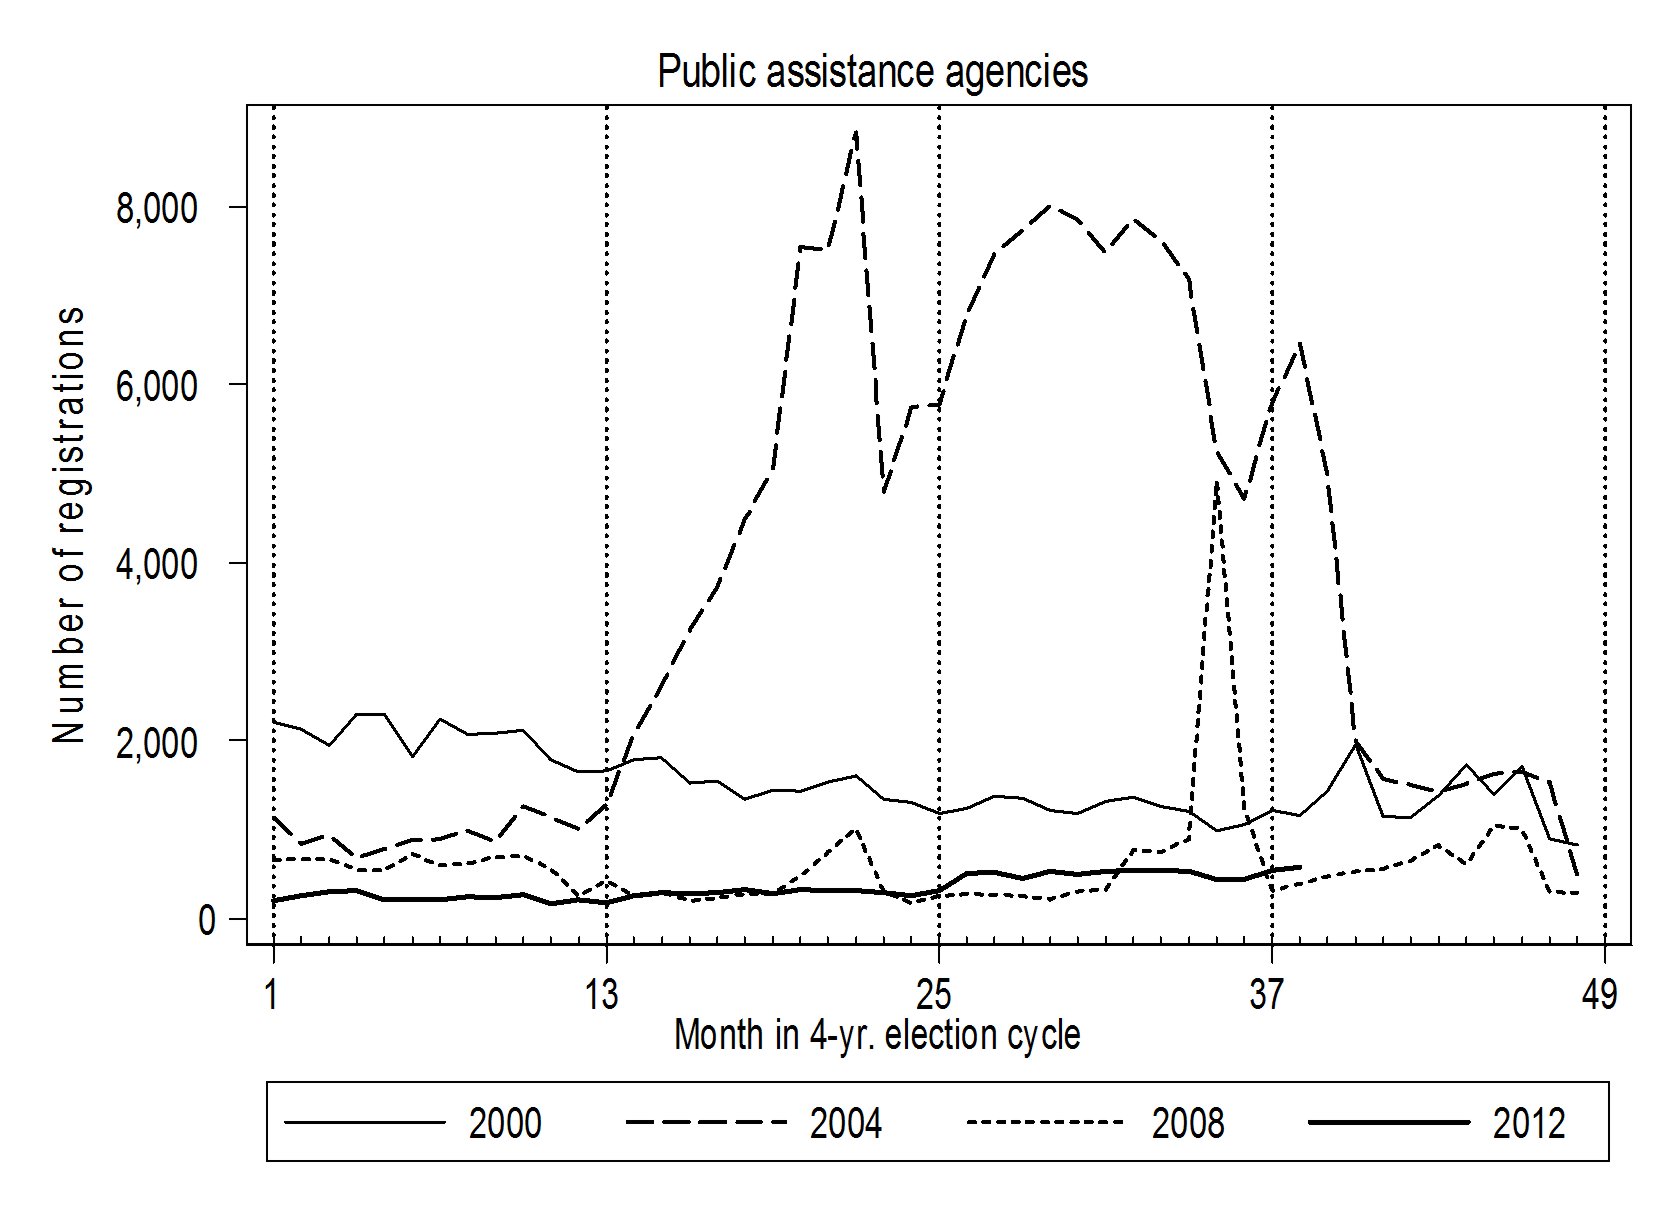
The fourth voter registration category is public assistance agencies. As the accompanying figure shows, with the notable exception of the period stretching from mid-2002 to early 2004, Florida has not been known for generating voter registrations at offices that cater to those needing assistance from the state. The exceptional period (along with the odd spike in November 2007) calls for explanation. This may be an error. However, if it isn’t, I am assuming there is an interesting story that someone could tell about this anomalous surge in voter registration forms emanating from Florida’s social service agencies. Again, I’d love to hear from anyone who knows what the story is.
After the public assistance agencies, there are the public libraries as a source of voter registrations in Florida. The following chart shows that time series:
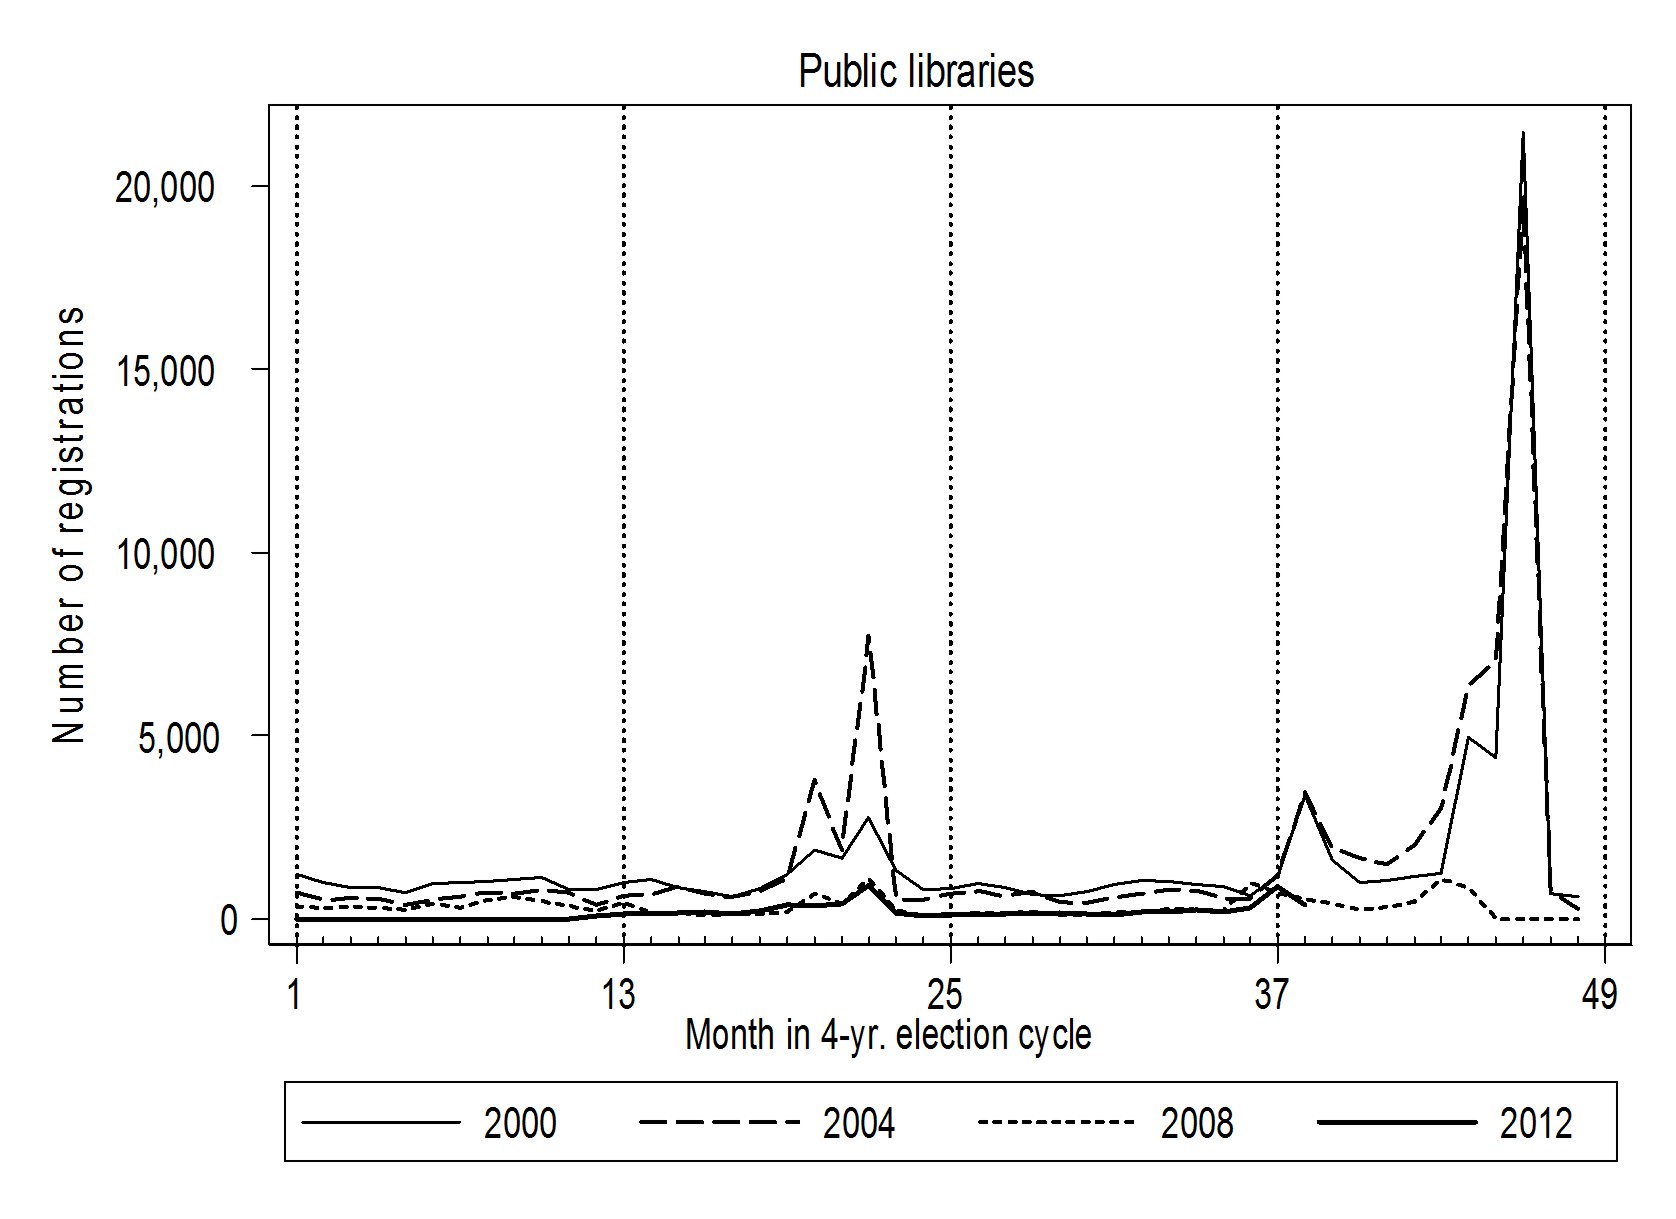
The pattern here is very similar to that of the “other” graph, only at a very much lower level of total registrations. With the possible exception of a little extra activity around midterm elections, registration at public libraries was mostly a story of presidential election activity in 2000 and 2004. As we have seen with so many of the other sources, the 2008 and 2012 presidential election cycles have seen a dramatically lower voter registration level from this source since the advent of the new voter registration system.
The next-to last source of voter registrations in Florida is agencies that serve the disabled. Here is the chart:
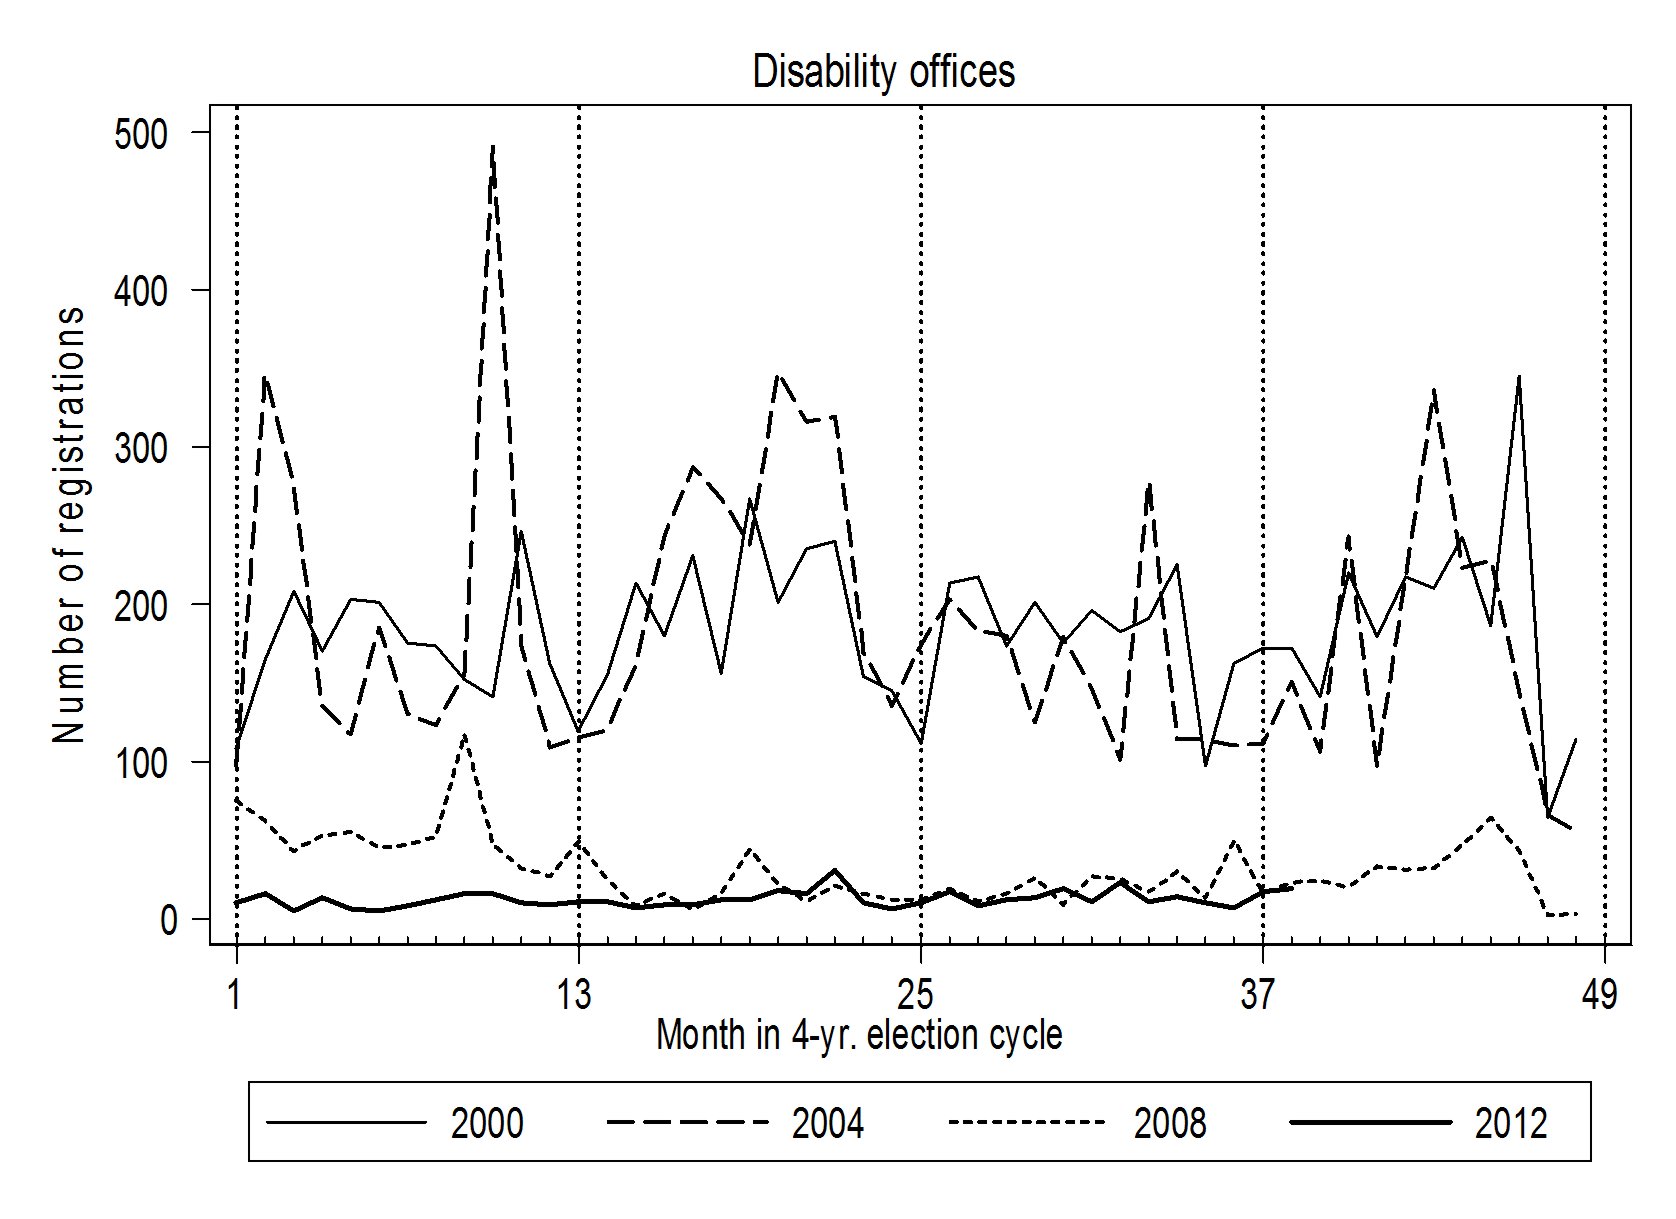
Even in the 2000 and 2004 election cycles, these offices were the source of very few voter registrations in Florida. Still, beginning in early 2006, it has been difficult to distinguish the numbers from zero in most months.
The least common source of voter registrations in Florida has been military recruiters. The following is the month-to-month graph of the numbers:
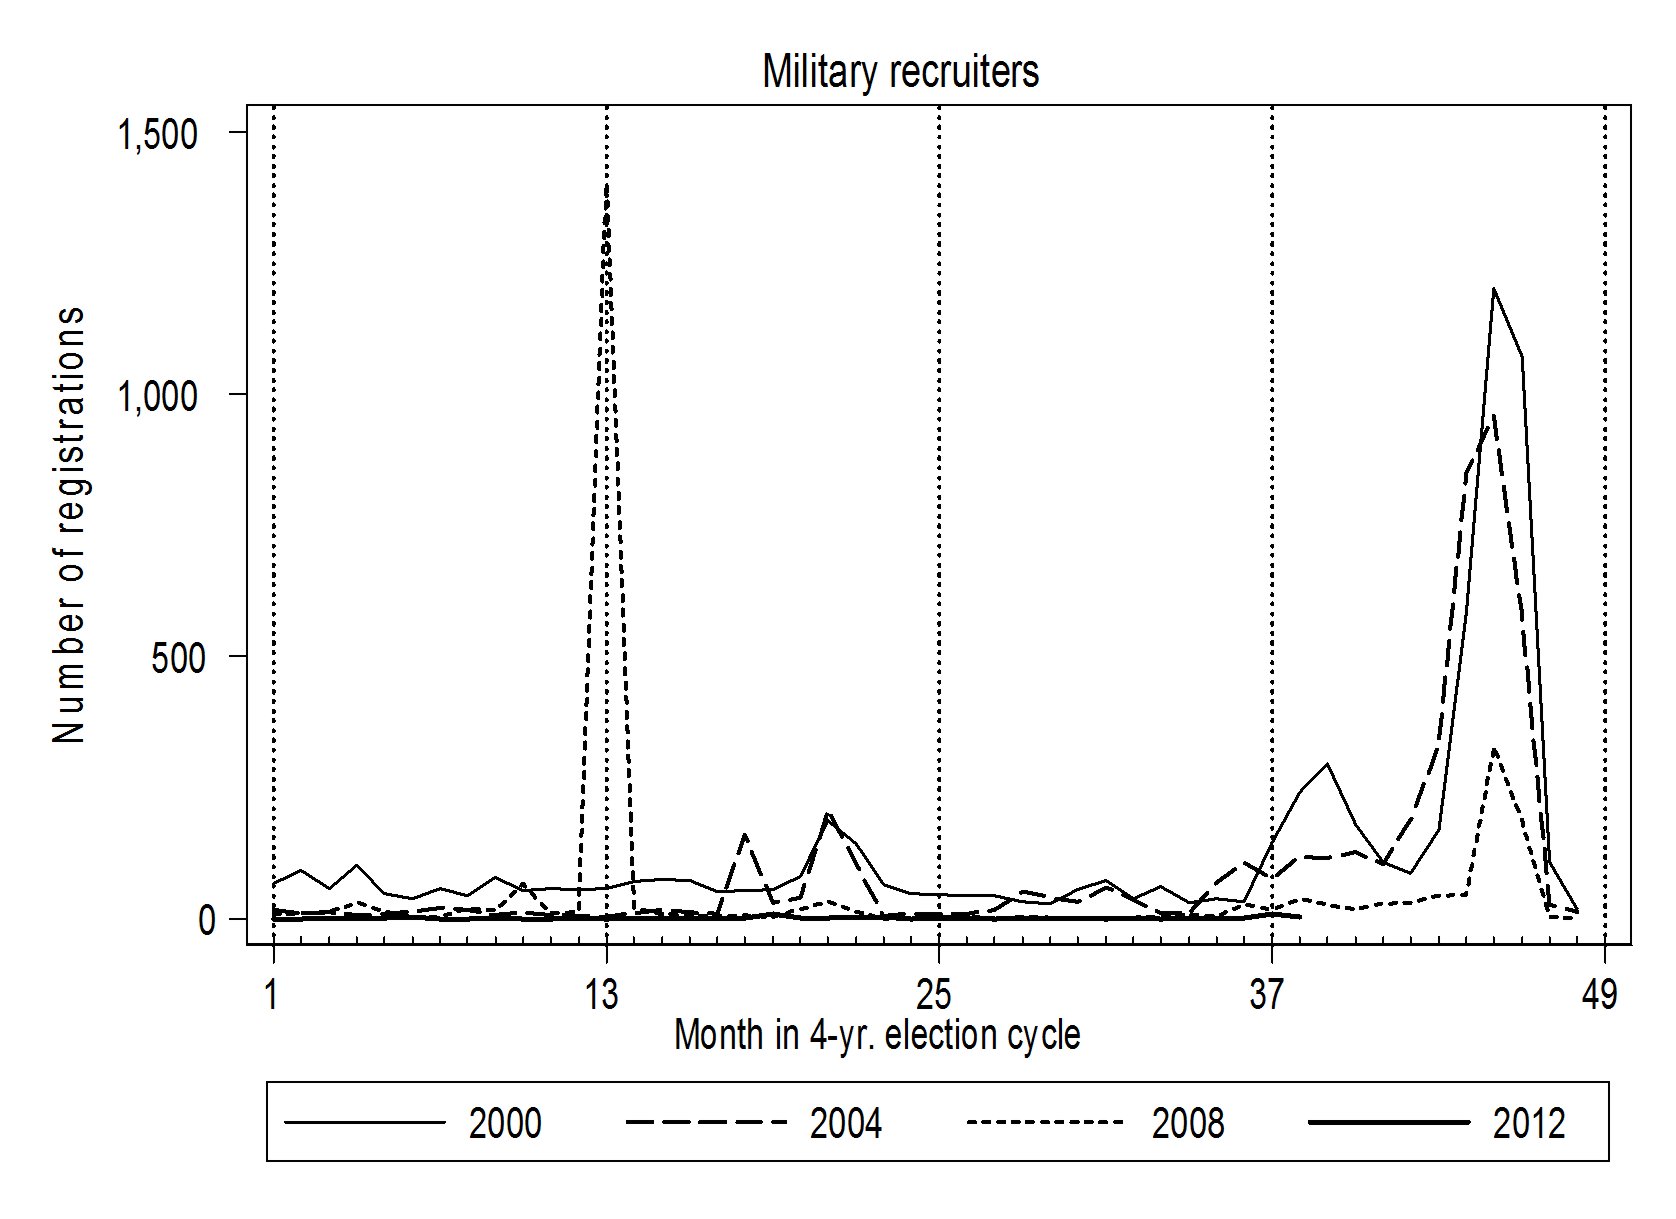 With the exception of an odd spike in early 2005, the number of voter registration forms coming from military recruiters has mostly been a phenomenon of presidential election years. As has been true for most of the other sources of registrations, 2008 was significantly below 2000 and 2004. The pattern for 2012 has been a flat line around zero for most of the cycle.
If you have lasted through this entire posting, I hope you get a sense of the larger picture of voter registration patterns in Florida. Perhaps HB 1355 has had a depressing effect on voter registration drives in the state. This is a matter before the public and the courts. The most striking thing about Florida voter registration patterns is how the numbers have shrunk since the institution of the Florida Voter Registration System in early 2006. Perhaps the dramatic shift in registration numbers is a artifact of how the statistics are being generated now. Or, perhaps it is part of a conscious decision to make it more difficult to register to vote in the Sunshine State. (Or, maybe the demographics are working against voter registration in Florida.) The important thing to note is that the potentially depressing effect of HB 1355 on third-party voter registration efforts is only the tip of the iceberg in Florida. The real prize here is understanding the larger pattern, rather than picking at piece of the puzzle, as if they were not related.