Encouraging researcher access to American polling places

I spent yesterday at the annual workshop on election integrity, hosted by Pippa Norris’s Electoral Integrity Project. It was an interesting day.  This year, the theme was about the 2016 U.S. election in comparative perspective. Leaving aside the obvious cracks about people who study only the United States being achingly narrow, we who study how Americans conduct elections can learn a lot from those who study how elections are conducted in other countries.

One of the most useful presentations at the workshop was by Nandi Vanka of the Carter Center, who discussed a report on the observability of elections in the 50 states.  You can download that report here.  The report provides useful context to the helpful NCSL web page on policies for election observers.  (The Carter Center team that wrote the report also provided the underlying research for the NCSL page.)

I took away two major thoughts after hearing the presentation and reading the report.  The first is that the United States lags far behind in upholding its international obligations to make its elections available to international observers.  My own experience is that state and local officials have nothing to fear from teams of professional, well-trained international observers taking a look at all aspects of the election process.  The elections profession in the U.S. can learn when election professionals from other countries comment on our procedures.  It’s just the right thing to do.

The second important point is that we (by which I mean, academics) need to do a better job working with election administrators to pave the way for academic researchers to have access to polling places.  Lonna Atkeson’s work in New Mexico demonstrates that both original academic research and improved electoral practices can emerge when the right conditions are set for researchers to be in polling places.  New Mexico is the rare — and perhaps only — state that lists academic researchers as one category of individuals allowed in polling places to watch the process.

We can’t wave any magic wands to transfer the New Mexico experience to the rest of the 50 states, but the following steps could probably help facilitate greater access to polling places by academics.

First, academics interested in doing fieldwork in polling places should develop personal connections to a few local election administrators, who can serve as mentors and (later) as recommenders.

Second, having established a personal connection, arrange to just sit in a few polling places on Election Day to watch and take notes — but not to write up anything for public consumption.  Best to know the lay of the land before jumping into publishable research.  Also, once you have observed a polling place on your own, you will have a better idea about how to deploy researchers into polling places without them getting in the way of the voting.

Third, in arranging access to polling places to do research, academics should have both a clear sense of what the research will accomplish, including an idea about how the research can benefit the administrator.  If nothing else, offer to share findings with administrators as a part of the write-up.  (This is not much different from our typical offer to share reports of our research with people who fill out our questionnaires.)

We may also want to think about ways to accredit academic researchers.  Election officials should be assured that when academic researchers go into polling places, they know how to act professionally, work unobtrusively, and follow the laws that constrain what goes on in a polling place.


Election Science Panels at APSA

I’m jetting off to the annual meeting of the American Political Science Association, which this year is in San Francisco.  For the non-political scientists who read this blog, the APSA meeting is the biggest convention of political scientists, with over 7,000 in attendance.  Naturally, there will be a number of panels of interest to those who follow the field of election science.  For the aid of those who will be attending, below I list the panels (and a few poster sessions) that have papers likely to be of interest to the field.  I likely missed some, and would welcome hearing about additional ones I might add.

The links go to the panel descriptions.  I’ve been warned that the links don’t always work, so caveat emptor.

In addition, Pippa Norris and her crew will be holding their annual pre-APSA election integrity workshop, where Barry Burden will be presenting a paper he and I co-authored with some great coauthors, about the Wisconsin recount. Take a look at the workshop website here.

Below are the election science panels I’ve identified for the main APSA conference.  Enjoy!

Title Day Time Hotel Room
Election Timing: Causes and Consequences Thu 10:00 Hilton Union Square Franciscan B
Who Votes? Thu 12:00 Hotel Nikko Bay View Room
Electoral Accountability, Integrity, & Security Thu 16:00 Hilton Union Square Golden Gate 7
Experiments on Voter Participation and Partisanship in Southern and East Africa Thu 16:00 Westin St. Francis Essex
Big Data and Machine Learning Thu 16:00 Parc 55 Divisadero
Voting and Turnout in the 50 States Fri 8:00 Parc 55 Fillmore
Racial and Partisan Gerrymandering: New Approaches for the Next Decade? Fri 8:00 Westin St. Francis Yorkshire
Experimental Replication Studies Fri 8:00 Parc 55 Embarcadero
Field Experimental Studies of Registration, Turnout, and Vote Choice Fri 10:00 Hilton Union Square Nob Hill 8 & 9
Democracy’s Legitimacy at Risk: Critical Perspectives from Mexico Fri 10:00 Hilton Union Square Franciscan A
Breaking News Panel: The Legitimacy of Elections: Russia, Fraud, and Public Confidence in the Electoral Process Fri 10:00 Hilton Union Square Continental Ballroom 6
Representation and Electoral Systems (Poster session) Fri 11:30 Hilton Union Square Grand Ballroom
Featured Papers in Information Technology and Politics Fri 12:00 Hilton Union Square Union Square 14
How Do Parties Respond to Electoral Rules? Fri 12:00 Westin St. Francis Elizabethan B
Elections, Public Opinion, and Voting Behavior (Poster session) Fri 13:00 Hilton Union Square Grand Ballroom
Voting, Representation, and Legitimacy in the American States Fri 14:00 Hilton Union Square Union Square 25
Democracy in Africa: New Opportunities, New Challenges Sat 8:00 Westin St. Francis Essex
Electoral Malpractice in East and Southeast Asia Mini-Conference (Mini-conference) Sat 8:00 Westin St. Francis California West
Modifications to State & Local Electoral Rules Sat 10:00 Hilton Union Square Union Square 17 & 18
Election Law and Voter Participation Sat 10:00 Hilton Union Square Franciscan D
Report of the Campaign Finance Research Task Force (Roundtable) Sat 10:00 Westin St. Francis Elizabethan C
Electoral Legitimacy and Representation Sat 12:00 Hilton Union Square Nob Hill 10
Making Democracy Work: Comparative Democratization in Brazil and South Africa Sat 14:00 Hotel Nikko Carmel II
Electoral Systems and Voting Rules Sat 14:00 Hilton Union Square Union Square 17 & 18
Research Methodologies Using Twitter and Facebook Sat 16:00 Parc 55 Fillmore
Public Opinion and Law Enforcement Sat 16:00 Hilton Union Square Plaza A
The Effects of Electoral System Rules Sun 8:00 Hilton Union Square Golden Gate 5

Deja vu? The National Academies of Science voter registration databases research

Over the past few months, I’ve had this strange sense of deja vu, with all of the news about potential attacks on state voter registration databases, and more recently the questions that have been asked about the security and integrity of state voter registries.

Why? Because many of the questions that are being asked these days about the integrity of US voter registration databases (in particular, by the “Presidential Commission on Election Integrity” (or “Pence commission”), have already been examined in the National Academies of Science (NAS) 2010 study of voter registration databases.

The integrity of state voter registries was exhaustively studied back in 2010, when I was a member of this NAS panel studying how to improve voter registries. In 2010 our panel issued it’s final report, “Improving State Voter Registration Databases”.

I’d call upon the members of the “Pence commission” to read this report prior to their first meeting next week.

I think that if the commission members read this report, they will find that many of the questions they seem to be asking about the security, reliability, accuracy, and integrity of statewide voter registration databases were studied by the NAS panel back in 2010.

The NAS committee had a all-star roster. It had world-renown experts on computer security, databases, record linkage and matching, and election administration; it also included a wide range of election administrators. The committee met frequently with a wide range of additional experts, consulted with a wide range of research, and produced the comprehensive report in 2010 on the technical considerations for voter registries (see Chapter 3 of the report, “Technical Considerations for Voter Registration Databases”). The committee also produced a series of short-term and long-term recommendations for improvement of state registries (Chapters 5 and 6 of the report).

At this point in time, the long-term recommendations from the NAS report bear repeating.

  • Provide funding to support operations, maintenance, and upgrades.
  • Improve data collection and entry.
  • Improve matching procedures.
  • Improve privacy, security, and backup.
  • Improve database interoperability.

As we look towards the 2018 election cycle, my assessment is that scholars and election administrators need to turn their attention to studying matching procedures, improving interoperability, and how to make these datafiles both more secure and more private. States need to provide the necessary funding for this research, and for these improvements. I’d love to see the “Pence commission” engage in a serious discussion of how to improve funding for research and technical improvements of voter registration systems.

So my reaction to the recent requests from the “Pence commission” is that there’s really no need to request detailed state registration and voter information from the states; the basic research on the strengths and weaknesses of state voter registries has been done. Just read the 2010 NAS report, you’ll learn all you need to know about the integrity of state voter registries and steps that are still needed to improve their security, reliability, and accuracy.

First Thoughts about the Pence Commission Voting List Request

I’ve had a chance now to read the letter that vice-chair Kris Kobach has sent to the states, requesting that they send the Pence Commission copies of their publicly available voter files.  My initial reactions fall into two buckets, the small and the expansive.

I want to make clear that there is no intrinsic problem with matching voting lists against other lists and reporting the results. In fact, valuable insights can emerge from linking voter records. I don’t know a better way to advance knowledge and practice than to conduct research, report the results, and then hash out what they mean.

But here’s the caveat.  As a social scientist who has conducted voter roll matching both for scientific research and for litigation, I know how hard it is to do this right.  For example, the well-known “birthday problem” makes it likely that two different people will be mistakenly matched to one another. Few people have the expertise to handle these complexities correctly.  Just as litigation is rarely the best vehicle to advance the science of a field, I worry about developing matching routines on the fly in the context of a commission that is controversial.

Now on to the letter.

I am well aware that many people view with skepticism the appointment of the Pence Commission.  I have nothing to add to the partisan fight over the commission’s appointment and work.  Instead, my reaction is from the perspective of someone who believes that careful empirical research is the best path to improving elections in America.

Two small-bore details jumped out at me when I read the letter.

First, the letters were apparently addressed to all the Secretaries of State, even though the chief election officer (CEO) is not always the Secretary.  (Here’s the link to the list of CEOs in each state.) Certainly support staff in SOS offices know how to forward e-mail, but small misfires such as this suggest a lack of care in the process of making the request for the voter files.

Second, the letters ask for the “publicly-available voter roll data,” including “dates of birth, political party …, last four digits of social security number if available…”  The terms “publicly-available” and “social security number” don’t belong together in the same sentence.  Furthermore, if the goal is to use these lists to do matching with other lists, there is no reason to specify political party.

Again, small details are telling.

But the request raises much bigger issues.  The letter reflects a naive understanding of how to go about voter list matching.  The letter isn’t a whole lot different from the requests I’ve seen or heard about over the years from graduate students and researchers just getting into the field.  The letter seems to suggest that each state’s data set is just sitting in a computer waiting to be dragged from a folder onto a thumb drive, or, in this case, uploaded to an FTP site.  Piece of cake.

Not so — and in so many ways.  Here are just a few

  1. Many states don’t allow the sharing of voter files with anyone other than candidates or in-state political parties. (Michael McDonald has a nice summary of some of these issues as of 2015 here.  Paul Gronke wrote about this in Pew’s Data for Democracy in 2008.)  I suspect that all sorts of groups are preparing their lawsuits right now seeking to enjoin states with such restrictions from sharing these files with the Commission.  If a state with such a law ends up providing the list anyway, the lawsuits will now come back to the states asking why other groups can’t get access to these lists, contrary to law.
  2. Some states charge lots of money for these lists.  In 2015, McDonald estimated it would cost over $120,000 to pay the fees to acquire these lists, if it were allowed.  Will the Commission pay?  If a state with high fees provides the list for free, how soon will the lawsuit be coming to demand that all requests for the voter files be granted gratis?
  3. In many cases, the voter files are not available as a single file in a single place. Who on the Commission’s staff is going to call each of the 351 city and town clerks in Massachusetts, asking them each for a copy of their municipality’s voter list?
  4. The voter files are not in standard formats.  Each of the 51 files, if they were all assembled, will need to be cleaned and prepared, and most of them will take hours, if not days, to prepare for analysis.
  5. Matching between the data sets — including matching with non-voter lists such as immigration lists — is hard.  It will be especially  hard to match with immigration lists because I suspect that few states will share actual dates of birth and none will share the last four digits of the social security number.  This will be on top of the difficulties that arise because of typos and inconsistent data entry standards.  Therefore, any matches that are done will be suspect from the start.  This is already the case when states — which are in full control of their voter lists — do their own cross-list matching.  You want to match on the actual non-public voter files, and they will not be made available to the Commission.
  6. Federalism and state control.  In my seventeen years of working in this field, I have heard one refrain more than any other, particularly from Secretaries of State:  No National Voter File. One of the early obstacles in creating the Electronic Registration Information Center (ERIC) was the worry that it would create a national file. ERIC has been designed to make that impossible.  How does the request that each state deposit its voter file on a military server relate to existing opposition on many fronts to creating a single national voter file?
  7. Privacy.  Researchers working in this area are well aware that the information contained in voter files is highly sensitive.  State laws and practices already reflect this sensitivity.  So does federal law.  There is no information in the letter about the privacy parameters associated with sharing the voter file.  Indeed, there is the troubling sentence that says, “Please be aware that any documents that are submitted to the full Commission will also be made available to the public.”  Does this apply to the voter files?  Does this apply to the results of matching procedures?

For each of the many  Voting Rights Act cases that have involved database matching, the cost to conduct those analyses has run well into the six figures.  And those were relatively simple, because the data were better and the number of databases being matched was much smaller. The protocols were also carefully designed, because they were developed under the watchful eye of a court.  If the Commission intends to conduct a comprehensive matching exercise, this will be a multi-million dollar, multi-month operation.  Because the Commission has the full support of the White House, I am sure the resources will be brought together to conduct whatever matching the Commission wants conducted, but is this the best use of these resources for this goal?

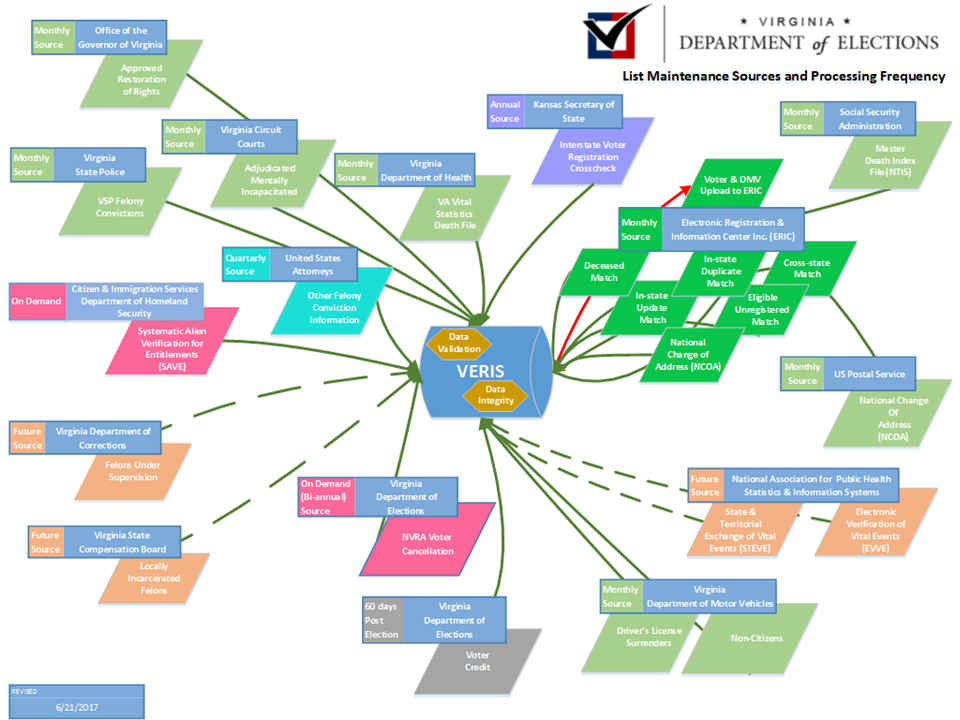
I have alternative thoughts about how the resources could be better spent, but the details will have to wait until another day.  To repeat what I said at the top of this post, I do think that voter list matching is important and valuable.  It should be conducted by the states on a regular basis, with the results being made public, warts and all.  As I wrote about last week, Virginia already provides a good example of a state doing intensive work, and I know they would like to do even more.  (And, here is a link to the type of report Virginia regularly releases.  Warning:  it’s 10,673 pages long.)

But, for states to do this, we need to bring together all the stakeholders to help create the protocols that allow for accurate matching.  My own grand plan is something like this:

  1. Every state should join ERIC, which has been shown to be very helpful in dealing with the most basic and common “list hygiene” problems.
  2. A group of state and local officials, academics, and federal government officials should get together and design agreed-upon protocols (which would combine automated and manual processes) for the auditing of state voter files by comparison with other state’s voter files, other state records, and federal government records.  Part of this agreement should include a plan to grant states direct matching access to federal data sets that are currently off limits to bulk matching.  This auditing standard should also account for other problems with voter files, such as typos.
  3. States themselves would then regularly conduct list audits using the protocols identified in the previous step and make the results of those audits public.

The existence of the Pence Commission is controversial already, and the day has now come that one of its most controversial activities has begun.  My intention here is to sidestep the political controversy and suggest two other things have been under-appreciated.  First, the Commission’s eyes may be bigger than its stomach.  Acquiring voter files from every state and matching them — among themselves and with other databases — will be a quagmire.  Second, public auditing of voter files based on database matching (and other procedures) is something that should be done more often and more publicly.  Because we have entrusted states to manage the voter files — for better or worse — a state-directed initiative would seem a better strategy than a controversial, high-visibility activity of a temporary federal commission.

Graphic of the week # 3

This weeks’ graphic was inspired by last week’s special elections for vacant U.S. House seats.  Most of the attention was paid to the Georgia 6th, so let’s look at the South Carolina 5th.

One of the things that always interests me is whether surprising results of elections are due to voters changing their behavior (compared to prior elections), or because the composition of the electorate changed.  This is, of course, a question that can only be answered definitively with individual-level data — and only if we know, for sure, how the same people voted in the past and in the present.  Absent the individual data, we only have aggregate data.

We start with the fact that there appeared to be a pretty uniform swing at the precinct level, from the November general election (measured by the Trump vote) to the special election amounting to 5 percentage points.

While we cannot know whether some Trump voters came over to support the Democrat, Archie Parnell, it does appear that Parnell was helped (and thus the Republican Ralph Norman was hurt) by a shift in turnout.  This is illustrated in the following graph, which plots the percentage change in turnout at the precinct level (comparing the special election to the general) against the two-party fraction of the vote received by Trump.  The dashed line is the best-fit line based on a weighted linear regression.  The solid horizontal line shows the average change in the turnout rate across the whole district. On the whole, there’s a pretty healthy negative relationship between Trump’s support at the precinct level and change in turnout.  In other words, turnout in the special election tended to slump the most the in precincts that gave Trump his biggest margins in the district.

By how much did this turnout differential affect the election outcome?  A simple back-of-the-envelope calculation can be done to answer this question.  If we take the percentage of the vote received by Norman in each precinct and re-weight each precinct’s contribution to the district vote total by November 2016 turnout, then Norman gets 54% of the two-party vote, rather than 52% — a small, but still significant difference.

One final detail about the graph.  There are obviously three outlier precincts in the graph — two precincts from Lancaster County (identified as Lake House and The Lodge in the election returns) and one from York County (Laurel Creek).  If anyone has information about why turnout in these three precincts held firm in comparison with last November, I would love to hear it.

Learning from Virginia about Voter List Maintenance

The Commonwealth of Virginia has been on my mind recently as I have been thinking about voter registration list maintenance. (I know, I have a troubled mind.) Virginia has a very thorough and well-documented “list hygiene” program — which results in an annual report that anyone interested in the topic should read. (Here’s a link to the past four reports.)

Edgargo Cortes, who is the Commissioner of the Virginia Department of Elections, graciously invited me to share the podium with him today, as he led a training session on list maintenance at the annual Virginia Elections Conference.  Edgardo’s remarks were centered around explaining the following chart, which illustrates the various data sets that come together on the regular basis — ranging from yearly to monthly — as his team tries to ensure that eligible voters, and only eligible voters, are on the Commonwealth’s voting rolls. (Click on the graphic for a slightly larger view.)

Here are some thoughts that initially occurred to me as I listened to Edgardo talk, and as I’ve spent the day talking with him and his staff:

  1. The amount of external data brought in to match against the voter file is stunning. To suggest that a state like Virginia isn’t putting a lot of effort into trying to keep the list current is just nuts.
  2. ERIC (the Election Registration Information Center) has been indispensable for improving the ability of Virginia to find voters who have moved away, and to make sure their voter registration is held in only one place.  Indeed there is evidence (some of which I presented in my remarks) that Virginia has been able to use ERIC to catch up from prior years when a lot of these (former) voters would have remained on the list as deadwood for years.
  3. Database matching is harder than you think.  When I got into this business, there was a common assumption that voter registration lists were the orphan child of government agency record keeping, and that larger agencies (especially DMVs) had crisp and clean lists.  Not true.  Turns out that most government agencies that interact with citizens really don’t need to know precisely where they live.  As a consequence, some data sources are less helpful than you’d think, and in almost all cases, data records don’t easily match-up.
  4. Citizenship matching is a quagmire.  The DHS SAVE (Systematic Alien Verification for Entitlements Program) database has been touted as the savior for keeping non-citizens off of voter rolls, but it turns out that if you have the information you need to search for someone on the SAVE service, you already know they are unlikely to be a citizen.  Furthermore, resident aliens transition so regularly into citizenship status that voters tagged as non-citizens almost always end up being citizens after all — a fact discovered only after painstaking auditing of citizenship information.  The quality of the data on citizenship seems ready-made for an endless stream of false-positive matches.

Virginia is a state that takes the accuracy of its voting rolls very seriously.  Check out their reports — or at least study the chart.

Graphic of the week # 2: Preparing for GA06

As I get ready to analyze the results of the upcoming runoff in GA06, I asked my research associate, Jacob Coblentz, to produce a graph to summarize how the precinct returns from the April primary compared to the November presidential returns.  Below is the result.


The y-axis is the percentage of the two-party vote received by all the Republican candidates in the primary and the x-axis is the percentage of the two-party vote received by Trump.  The solid line is the 45-degree line.

In the 2016 general election, 50.3% of the two-party vote in the district went to Trump.  In the primary, 50.9% of the two-party vote went to one of the Republican candidates.  To play Captain Obvious here, no wonder this is a nail-biter, and no wonder an Ossoff victory would be quite an accomplishment.  A deeper dive into the data shows that primary turnout sagged more in the precincts that showed the strongest support for Clinton in November, compared to the sag in precincts that supported Trump the most.  Thus, it’s also no surprise that this has become a contest of turnout.


Local Election Official Survey in the Field

With the help of Sentis Research, I have placed into the field a survey of local election officials to follow-up on a very similar survey that I helped produce in 2013, in order to help the Presidential Commission on Election Administration understand the challenges facing local jurisdictions.

You can review the testimony my colleagues and I provided to the PCEA about the 2013 survey at meetings on September 20, 2013 and  December 3, 2013.

The specific purpose of the current survey is to see how things have changed at the local level for two very important issues in the PCEA report: wait times at the polls and the purchase of voting technology.  Public opinion research of voters suggests that wait times diminished substantially in 2016, compared to 2012, and the local election official survey will help to provide context to why wait times dropped.  The PCEA report also identified the problem of aging voting technology as a “looming technology crisis.”  The LEO survey will help us to gauge how much it remains a looming problem.

With concerns over email phishing attacks, some local officials have contacted me to see if the invitation to participate in the survey is legitimate.  I don’t blame them.  If any election official is concerned about the authenticity of the e-mail they received about this survey, here are some things to look for in the message:

  • You will notice that my contact information is located on the e-mail solicitation.
  • The invitation will be sent to you from the following e-mail address:  MIT@sentis.ca.  It will include “Election Administration Survey” in the subject line.
  • The invitation will include a link that will take you to an online survey hosted at https://mit-survey.sentis.ca. (Each link is customized for every individual who was invited to participate, so don’t visit the simple link given in the previous sentence.)

One final thing:  answers to the survey will be held in confidence.  We will not be releasing or saving any information about individual respondents.   We will only be releasing an aggregate report about the responses.

I appreciate the responses we have received thus far.  This is an important opportunity for local officials to report on how things have gone in the four years since 2012, and to help us gauge the challenges and successes experienced by local election jurisdictions in 2016.

Graphic of the week # 1: Polarization in state voter confidence

Beginning today, I hope to post a weekly graphic that I have produced, or that has been produced by one of the team members of the MIT Election Data and Science Lab, that provides some new or interesting insight into how elections are run in the United States.

This week, the subject is voter confidence.  This is a big topic.  Lots of people make claims about voter confidence, particularly what causes it to go up or down, oftentimes tying these claims to support for some type of election reform.

In fact, the literature on voter confidence suggests that very little in the way of election reform can move voter confidence.  What does move it is the election results.  If your guy wins, you’re more confident than if your guy loses.

I came across a nice example of this as I was preparing for some talks at upcoming summer election conferences.  The underlying measure of voter confidence is the percentage of respondents to the Survey of the Performance of American Elections (SPAE) who stated they were “very confident” that votes were counted accurately in their state in 2016.  I separated those responses by the party of the respondent and then took the difference.  Positive amounts mean that Republicans were more confident that votes were counted accurately in their state, negative amounts mean that Democrats were more confident.

Below you see the results.  With only three exceptions (Maine, Michigan, and Pennsylvania), the more-confident partisans in a state match the party of the presidential candidate who won the state.


On average, there is a 34-point net jump associated simply with living in a state won by Trump compared to being a state won by Clinton.

There are some states with less polarization than we would expect (Wyoming, West Virginia, and Hawaii) and some with more (Alabama, Washington).  Understanding why this is will have to wait for another day.

Initial thoughts on the “Pence Commission”

President Trump has just issued the executive order announcing the creation of his “voting fraud” commission to be chaired by Vice President Pence.  Here are my own initial thoughts.

1. Title.  This will be the Presidential Advisory Commission on Election Integrity.  Election integrity is the principal dimension over which Democrats and Republicans differ when they think about the main problems of election policy, both at the mass and elite levels.  For instance, in my own module of the 2016 Cooperative Congressional Election Study, I asked respondents to place themselves on a five-point continuum, based on which of the following statements was closest to their own opinion:  (1) It is important to make voting as easy as possible, even if there are some security risks, vs. (2) It is important to make voting as secure as possible, even if voting is not easy.  Here is how partisans distributed themselves among these answers:

This pattern recurs on virtually all questions on this survey — and others like it — that touch on security vs. access.  Bottom line:  This is a commission focused on problems that Republicans will resonate with and Democrats won’t.  Unlike the last presidential commission on election issues, the Bauer-Ginsberg PCEA, the Pence Commission seems like a body that will primarily reinforce partisan lines and gridlock on hot-button election issues.

2. Voter confidence. The executive order starts by charging the commission with identifying “those laws, rules, policies, activities, strategies, and practices that enhance the American people’s confidence in the integrity of the voting process used in Federal elections.”  If the commission focuses on the scholarly research on this item, it will discover two overwhelming findings:  (1) voter confidence is driven most powerfully by who wins and loses and (2) election laws such as voter identification don’t affect the confidence that the mass public has in the electoral process.  In other words, when your party’s candidate wins the election, you become more confident of the process than when your party’s candidate loses.  In 2012, for instance, 52% of Republicans were very confident their votes were counted as cast, according to responses to the Survey of the Performance of American Elections (SPAE).  In 2016, that percentage rose to 71%.  On the flip side, the percentage of Democrats who were very confident fell from 76% to 72%.  There is no election reform that has been shown to produce such swings in voter confidence as this.

3.  Focusing on rare problems vs. common problems.  One of the greatest barriers to advancing the cause of evidence-based election reform is how the field regularly gets side-tracked by issues that are serious on their face, but for which there is little-to-no evidence that they are encountered by millions of voters.  I’m thinking here about the belief that George W. Bush won in 2004 only because thousands of votes were stolen for him by electronic machines in Ohio, or that Donald Trump would have won the popular vote in 2016 if only millions of fraudulent votes hadn’t been cast.  At the same time, state and local election officials struggle to get state legislatures and county commissioners to focus their attention on keeping voting machines up-to-date or modernizing voter registration systems.  These latter problems have had demonstrable effects in the past, and election administration continues to struggle with them today.

4. The lost opportunity.  Most people who work in the field of election administration, academics and practitioners, know that the voter registration system is less than perfect and needs help.  Democrats and Republicans alike have worked in recent years to address the vulnerabilities in this system.  In some cases, they have come together to embrace programs like ERIC (the Electronic Registration Information Center) , in order to improve list maintenance.  In other cases, they have supported online voter registration, which holds the promise of improving the accuracy of voter lists.  The existence of a commission with a partisan framing will create barriers for non-partisan and dispassionate work in this area to proceed — not because it will necessarily politicize those already doing the hard, tedious work in this area, but because they (we) will yet again have to swat back unfounded rumors, leaving less time for the work that actually needs to get done.