Charles Stewart III
The Healthy Elections Project has been running a series of surveys in a half dozen battleground states, asking how voters intend to cast their ballots. I have previously published thoughts on Arizona, Florida, North Carolina and Wisconsin, with a bonus posting about Georgia (where we are not surveying, ourselves.) This brief note focuses on Pennsylvania
First, as to the intentions themselves. The table below shows that there was very little movement in reported intentions across the four waves of the surveys. An ANOVA test fails to reject the null hypothesis that the four waves are drawn from separate samples, so I proceed using results from the pooled survey, discarding the “don’t knows.”
|
Vote mode intention among likely voters, including don’t knows |
|||||
|
Date |
Election Day |
Early |
|
Don’t know |
N |
|
Sept. 4 – Sept. 11 |
53.5% |
2.6% |
39.1% |
4.8% |
489 |
|
Sept. 16 – Sept. 25 |
56.2% |
2.2% |
39.3% |
2.2% |
484 |
|
Sept. 30 – Oct. 9 |
56.8% |
1.9% |
38.2% |
3.1% |
492 |
|
Oct. 14 – Oct. 21 |
51.9% |
3.5% |
41.7% |
3.0% |
491 |
|
Total |
54.6% |
2.6% |
39.6% |
3.3% |
1,957 |
|
Vote mode intention among likely voters, excluding don’t knows |
||||
|
Date |
Election Day |
Early |
|
N |
|
Sept. 4 – Sept. 11 |
56.2% |
2.8% |
41.0% |
465 |
|
Sept. 16 – Sept. 25 |
57.5% |
2.3% |
40.2% |
473 |
|
Sept. 30 – Oct. 9 |
58.6% |
2.0% |
39.4% |
477 |
|
Oct. 14 – Oct. 21 |
53.5% |
3.6% |
43.0% |
476 |
|
Total |
56.5% |
2.6% |
40.9% |
1,892 |
(By the way, the overall 95% confidence interval for all four waves combined is around +/- 2.2 points. For any one wave, it’s around 4.4 points.)
Second, to convert these expectations to raw numbers, we need an estimate of turnout. In most of the other memos, I used a couple of ad hoc methods. Since then, I have come across the state-level turnout estimates that are produced as a byproduct of the FiveThirtyEight presidential election forecasting model, and so I’ll use those instead. For Pennsylvania, the low and high estimates are 6.0 million and 7.7 million, respectively, which is what I’ll use here. However, turnout in 2016 was 6.2 million, and thus I’m certain that the low estimate is too low.
Third, here is what the combination of numbers above imply for the final distribution of votes in Pennsylvania, by mode:
|
|
Vote mode, combining four waves of survey |
||
|
Assumed turnout |
Election Day |
Early |
|
|
6.0 million |
3.390M |
156k |
2.454M |
|
7.7 million |
4.351M |
200k |
3.149M |
Fourth, a final calculation needs to be made, if we want to estimate the number of mail ballots that will be requested, since not all mail ballots are returned. For the states that make their absentee ballot files available, it appears that in 2016, around 85% of requested mail ballots were returned. If that return rate holds for Pennsylvania, then it should expect between 2.9 million and 3.7 million requested ballots.
There is one data issue that needs to be brought up here. Pennsylvania does not have a full-bore early voting program. Rather, it allows in-person mail voting, which some cities, notably Philadelphia, have promoted. The Pennsylvania voter file does not have a separate code for in-person absentee ballots, and the conventional way to figure out who was voting in person yielded an implausible number of early in-person voters. (The standard way is to select records in which the request for the ballot, its issuance, and return all share the same date.) Therefore, I am assuming that the absentee ballot file does not record in-person absentee voters, although I could be wrong about that.
As of yesterday, 3,058,367 ballots had been requested and 1,850,393 returned a mail ballot. Today was the deadline for requesting mail ballots, which means that the number of mail ballots requested will likely hit the low end of the estimates, at around 3.1 million. For the past week, Pennsylvania has been averaging 95,000 returned ballots each day. Leaving aside the ballots that will arrive after Election Day, if the state keeps receiving ballots at last week’s page, it will eventually have 2.5 million mail ballots, which is also on the low side of the estimates.
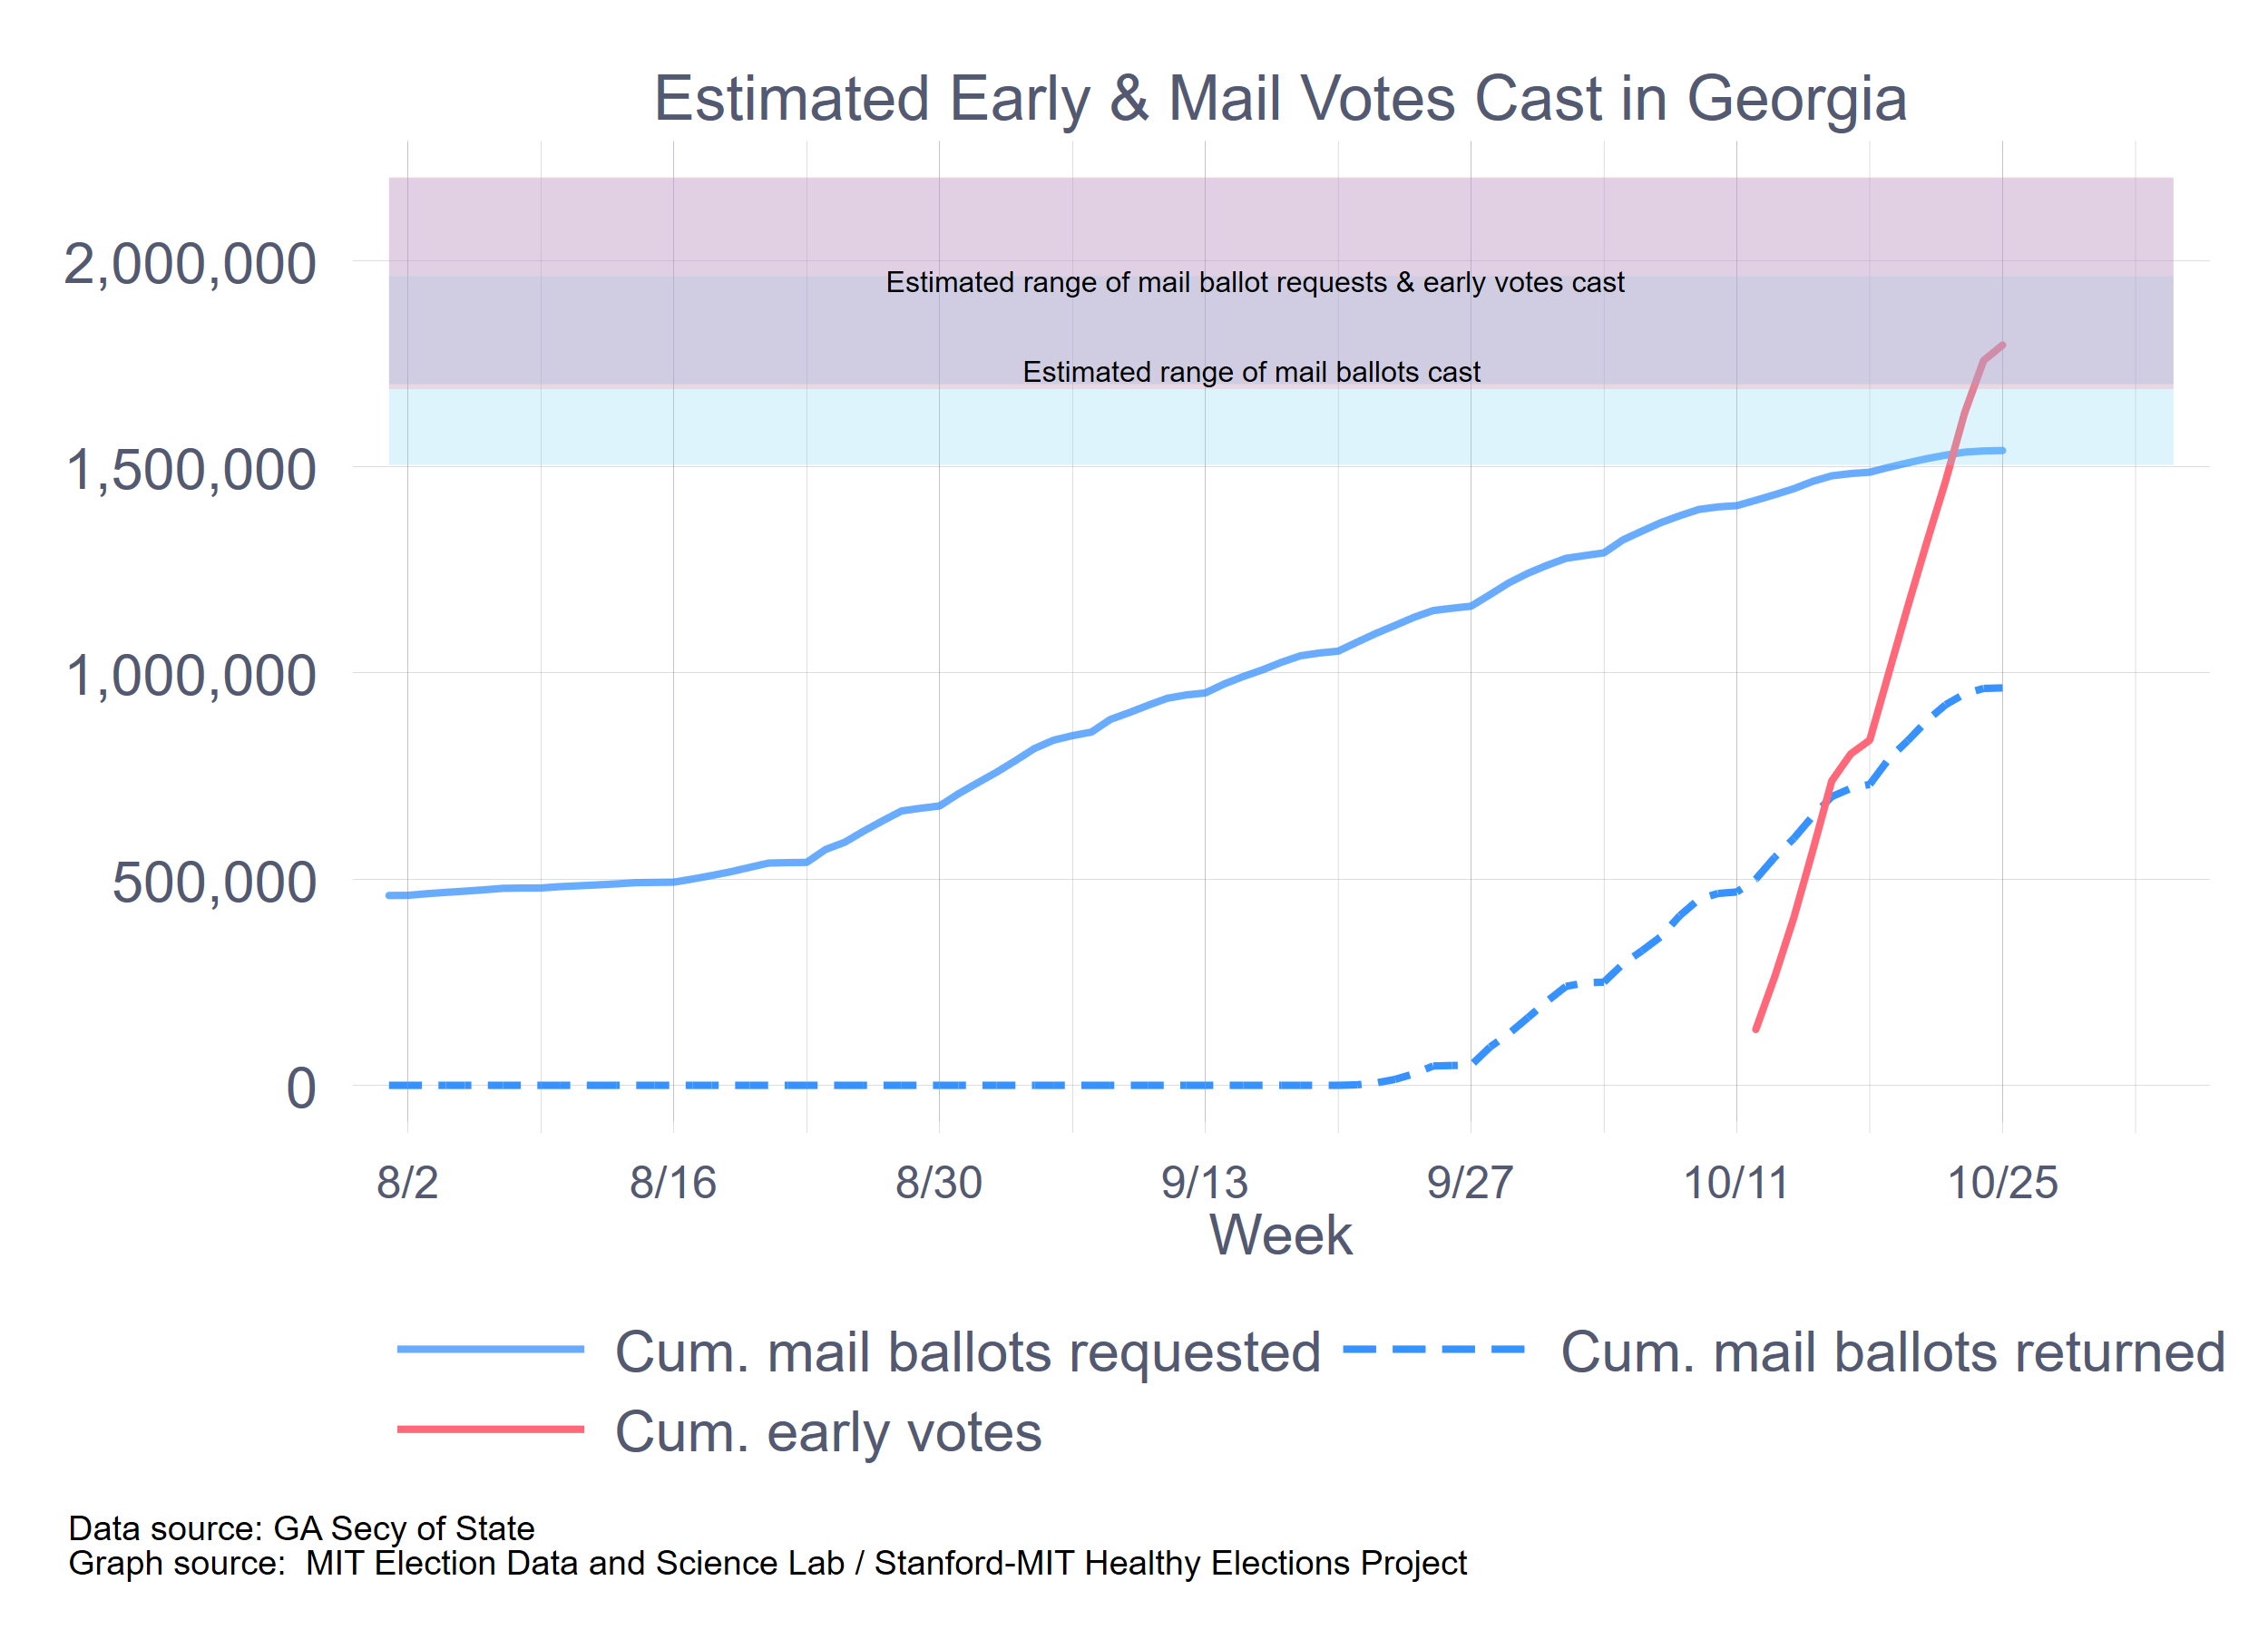
The following graph summarizes the important calculations.

As for Election Day, this is where the turnout estimate really matters. If we think that 2.5 million mail ballots (and a small number of early votes) will come in before Election Day, then if turnout is at the low end of 6.0 million, that leaves 3.5 million to vote on Election Day. If turnout is at the upper range of 7.7 million, then Election Day turnout would have to be 5.2 million. This is a considerable range. My own hunch is that turnout will hit the upper range, so Pennsylvania’s election officials would be well served by planning for this larger number. Whether this is necessary, or an over-reaction, will only be known on Election Day.