Resilient Elections

I’m excited to announce that I’ve started a video series with Paul Gronke, who runs the Early Voting Information Center (EVIC) up at Reed College. We just posted our first video, in which Paul and I give a brief introduction to the series. Please watch our intro, subscribe to our YouTube channel, and let us know your comments and questions.

As we discuss in the introductory video, we are going to focus on topics that we know are going to be important to researchers and election officials as we get closer to the November 2020 presidential elections in the U.S. Paul and I will are working on a number of different videos — some will be the two of us discussing important election science and administration topics. Some will be conversations with other academics who are working on important research questions like voting by mail, election forensics, election integrity, and voter confidence. And finally, we are going to have conversations with election officials, in particular those on the West Coast, who have extensive experience with early and remote voting.

If you are interested in suggesting certain topics, let us know in the YouTube channel comments.

Five Wisconsin Take-Aways

By Charles Stewart III, MIT

The following is a list of take-aways from the Wisconsin primary. I will be elaborating on these points in the following days, but I wanted to get these down before the day got too far out of hand.

  1. It is possible to rapidly expand vote-by-mail even when you’re not prepared for it, but don’t try this at home. The state was in about as bad a bind as one could imagine—a shifting, uncertain health crisis, conflicting court decisions, a deadlocked state election commission, a history of little vote-by-mail, and the most decentralized election administration system in the nation. And yet, 1.1 million mail ballots were received in time to be counted—a record for any election in the history of Wisconsin.
  2. In-person voting is still necessary. The collapse of in-person voting in Green Bay (Brown County) and Milwaukee City (Milwaukee County)—and perhaps in other municipalities, as well—had a measurable effect on turnout. A simple statistical model suggests that Milwaukee County came in 19,000 votes below expected, Green Bay at 10,000 votes below expectations.
  3. The first act of the primary is an amazingly good start, but it doesn’t mean we are out of the woods yet. We do not know yet how many absentee ballots were rejected because they arrived too late, or because of other infirmities.
  4. A surprisingly good primary does not guarantee a surprisingly good general election. The electorate in a general election is different from the primary election. It’s less experienced and has more difficulties at the polls. It will be less capable of jumping through the hoops to get ballots, and it will be more reliant on election-day registration to be able to vote in the first place. The primary is a good start, but it’s just a start.
  5. Wisconsin’s electoral landscape is shifting. First, even with the difficulties, turnout was well above what a statistical model would have predicted, given the lack of a challenger in one party and the un-competitiveness in the other. Second, the shift in votes that gave rise to the liberal’s victory in the supreme court race—a proxy for partisan politics more broadly—show a pull-back in support for conservative politicians in suburban Milwaukee counties, in counties of the Twin-City exurbs, and in the small “Obama-Trump” counties throughout the state.

What “Should” We Expect Turnout to Be in Wisconsin?

By Charles Stewart III, MIT

While we wait for the election results to be released later tonight, it would be useful to predict a priori what we would expect turnout to end up being. With an expectation established, based on past voting patterns in Wisconsin, it will be easier to assess how the unusual circumstances surrounding the primary may have affected turnout and the vote shares for candidates.

The exercise here is entirely empirical. There are too few data points—18 in all—to build an elaborate model. The main explanatory variable I will explore is the competitiveness of the presidential nomination fight.


A simple two-variable model of turnout

To start, I look at turnout in the presidential preference primary from 1948 to 2016, as a percentage of the voting-age population. Turnout is taken from the Wisconsin Elections Commission website, as is voting-age population, with the exception of 2012 and 2016, which I got from Michael McDonald’s United States Elections Project website.
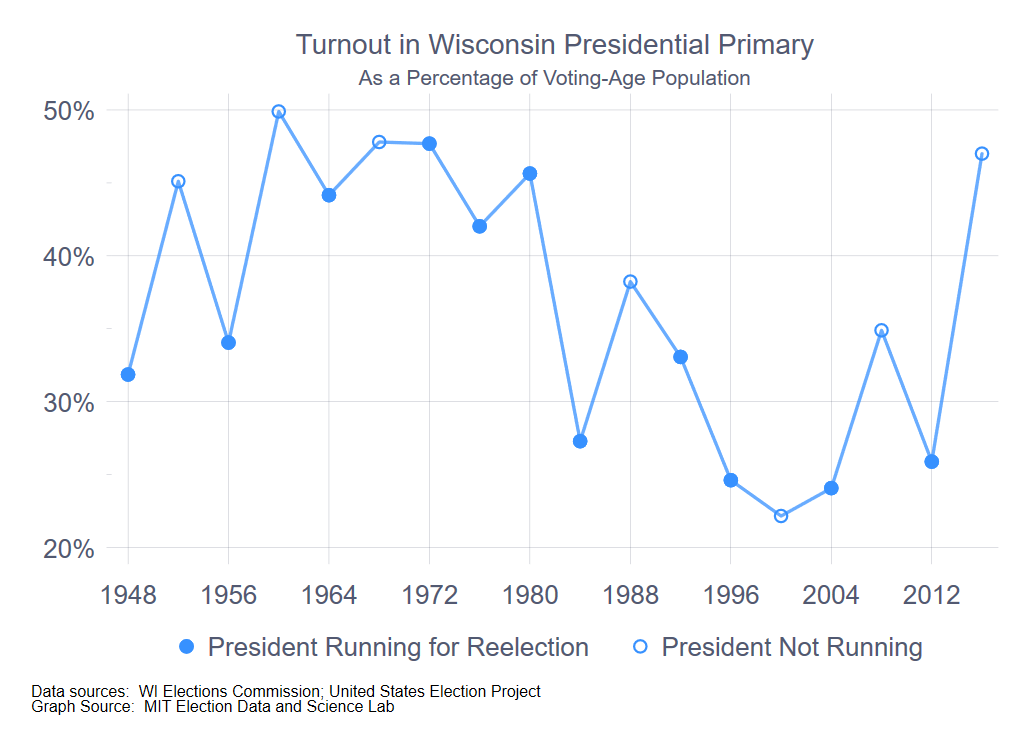
There are two notable patterns in the accompanying figure. (Click on any of the figures in this post to enbiggen.)  First, there is a steep drop in turnout between the 1980 and 1984 primary.  I’m not certain what caused this—it’s not due to the passage of the 26th Amendment to the U.S. Constitution, which gave 18-year-olds the right to vote, because that took effect with the 1972 election.

It has been suggested to me (thanks, Barry Burden) that prior to 1980, Wisconsin was typically early in the primary season, compared to other states, and thus a much more significant event in the hunt for the nomination. In any event, it is clear that 1984 and onward constituted a different turnout regime than the pre-1984 period. Whether the years prior to 1960 properly belongs to an even different period is an interesting question, but isn’t obviously relevant to the exercise of creating an expectation for turnout in 2020.

The exception to this simple periodization is 2016, where the turnout level of 47% was nearly twenty points higher than the average of the 1984 – 2012 period (29%). I will return to this point below.

The second pattern in the time series is the increase in turnout in years when the incumbent was not running for president, in other words, was precluded by the constitution from running for a third term. (Open-seat years are indicated with the open circles in the graph.) With the exception of 2000, the existence of a presidential open seat is associated with an increase in turnout in the primary, compared to the prior presidential election year. (And, one could possible even argue that Al Gore’s candidacy as Bill Clinton’s heir in 2000 meant that Gore was considered to be the de facto incumbent in the Democratic primary that year.)

The mechanism here is clear. With an incumbent president running for reelection, the in-party’s primary battle is typically subdued compared to the out-party’s. Absent another reason to come to the polls, the in-party’s partisans are likely to stay away to come degree. Conversely, in years where the incumbent cannot run for reelection, both parties tend to have hard-fought contests, drawing voters from both parties to the polls.

For starters, then, this suggests a simple regression model, where the dependent variable is turnout as a percentage of VAP and the independent variables are two dummy variables indicating (1) whether the year is 1984 or after and (2) whether the incumbent president is term-limited from running again. The results are in the accompanying table.

This allows for a simple prediction for 2020. With Trump not term-limited out, we would expect turnout in 2020 to be 40.6 – 13.2 = 27.4 percent of voting-age population. With VAP at 4,573,223, this works out to 1,253,063.

Adding competition

There is something unsatisfactory with models that rely solely on dummy variables, especially dummy variables demarking time periods, because they essentially say that nothing changes during the period in question, beyond random noise. Further examination of the graph above suggests there may be another dynamic at work, beyond whether the president is term-limited out, and that is the actual competitiveness of the races at hand.

For instance, in the post-war period, there were three elections in which both parties had hot nomination contests when the primary rolled around to Wisconsin—1980, which featured Kennedy and Carter duking it out on the Democratic side and Reagan and Bush locked in a tight race on the Republican side; 2008, with Clinton v. Obama and McCain v. Hckabee; and 2016, with Clinton v. Sanders and Cruz v. Trump and Kasich.

We can extend the previous regression model by adding the “effective number of candidates” measure to the mix. (See the end of this post to see a discussion of the effective number of candidates measure.  In this case, I add the effective number of candidates in the two parties to create a unified variable. I do this to preserve degrees of freedom.)

Doing so reveals the results in the accompanying table.

With the 2020 Republican primary uncontested and the Democratic primary down to two candidates, one of whom was already the presumptive nominee by primary day, the effective number of candidates for the 2020 primary was already among the lowest in the time series. In the best of cases, if Biden and Sanders tie, the effective number of candidates across the two parties would be precisely three—one for the Republicans plus two for the Democrats. As the following graph shows, the 2020 primary will likely be the least competitive Wisconsin presidential primary, considering the two parties together, since 1964.
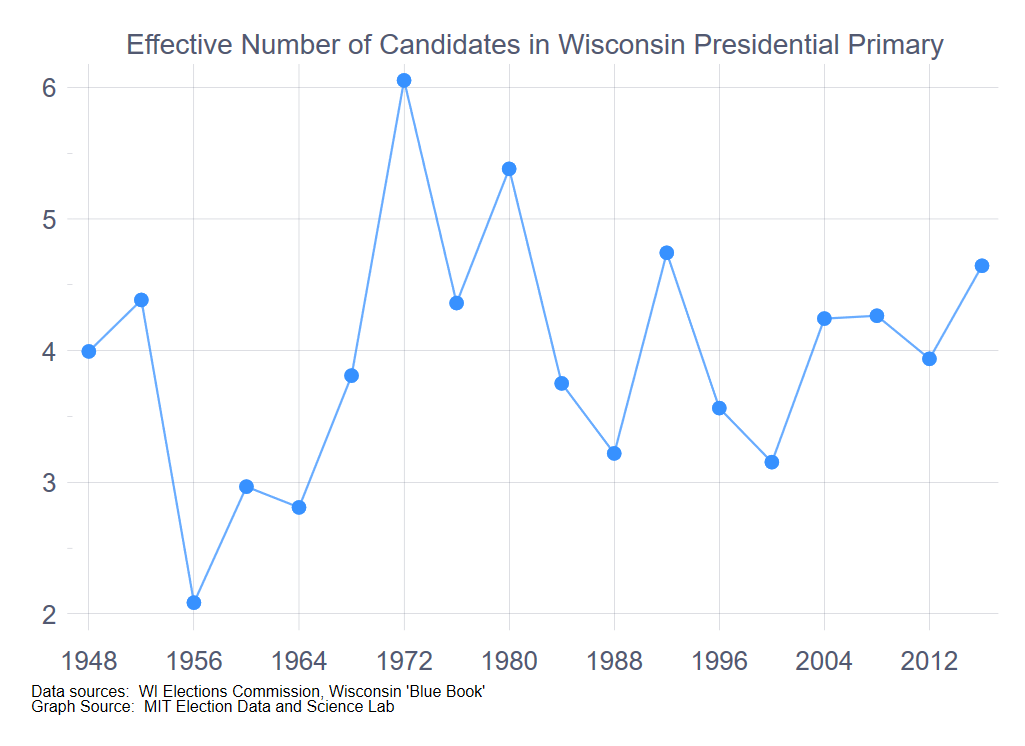
 

To make a prediction from the regression model model, we have to estimate the results of the Democratic primary, while simplifying things by setting the effective number of Republican candidates to 1, ignoring scattering votes on the Republican side. The following table shows the range of estimates, varying the percentage of the vote for Biden from 30% to 70%, ignoring the vote for the other candidates.


The high-end estimate, with a Biden-Sanders tie, is 23.9% of VAP, four points below what we predict without taking the non-competitive nature of the primary into account.

What about the 2016 outlier?

The one thing that makes me uneasy about these predictions is the 2016 primary turnout of 47%, the highest since 1980. Several commentators have suggested that 2016 had an especially high turnout because of the fiercely fought race for Wisconsin Supreme Court, between the liberal JoAnne Kloppenburg and the conservative Rebecca Bradley. (Wisconsin’s supreme court elections are non-partisan.) With the recent escalation of partisan rancor in the state, much of which has focused on Supreme Court decisions, the explanation for the turnout surge in 2016 could rest on the Supreme Court race, not the presidential primary.

The fact that 2016 is truly an outlier is reinforced when we generate predicted values from the two regressions conducted above. The accompanying graph shows the actual time series, along with the two sets of predicted values from the regressions above. The 2016 values are 12 points greater than either regression would have predicted. This is similar in magnitude to the other outlier, 2000, where turnout was 13 points below what the model predicted.

On the issue of state supreme court races providing a turbo-boost to turnout in Wisconsin in general: if it did in 2016, it was the first time ever, at least in the post-war era. When I add variables intended to gauge the presence of contested supreme court races to the regression models above, nothing comes close to statistical significance. For instance, not all years have a supreme court race on the ballot. Adding a variable to account for supreme court races on the ballot along with the presidential primary adds nothing to the explanatory power of the two regression models, nor does adding a variable measuring how closely contested the supreme court race was.

The question, then, is whether 2016 was a true outlier, as was 2000, or whether 2016 ushered in a new partisan era. If it did, then we would expect turnout in 2020 to be about 15 points above what was predicted in the two regressions above. That is, we would expect turnout to be in the range of 1.8 and 1.9 million voters, depending on which regression model above is preferred. My political scientist training makes me skeptical about declaring new eras based on a single election, and so I would not expect turnout in 2020 to be nearly this high. Of course, with the confusion surrounding the primary, we may not know what the “new normal” is until 2024.

A conclusion (of sorts)

As of this writing, 1.1 million absentee ballots have been returned for counting. This guarantees that turnout based on absentee ballots alone with be in the ballpark of the predictions from the two regression models reviewed here. We still don’t know what total turnout is, because municipal clerks have hewed closely to the U.S. District Court order not to release any election results until Monday evening.

The Milwaukee City clerk has reported that about 20,000 voters cast ballots in person, anticipating that around 80,000 absentee ballots would eventually be returned. If these percentages hold for the whole state, then we’d anticipate for turnout to be around 1.4 million. Of course, Milwaukee’s in-person voting on Election Day was seriously hampered by the closing of over 90% of its Election Day precincts. I would expect that Wisconsin overall will see something less than 80% of its ballots cast by mail. If so, then turnout will be well above 1.4 million.

Either way, it seems reasonable to expect at this point that turnout will exceed what we should have expected, given the recent history of primaries in the state. Some may say that we should have expected much greater turnout, given the nature of the supreme court race also on the ballot, but one (or two) data points is a thin reed to hang such expectations on.

In any event, the fact that Wisconsin will likely see a much larger turnout for an uncompetitive presidential primary in the midst of a frightening pandemic says a lot about the persistence of the state’s voters and election workers, as it also says a lot about the likely level of turnout in November, when the obstacles to getting to the polls will (one hopes) not be so great.

Epilogue:  The “Effective Number of Candidates” Measure

The “effective number of candidates” measure is analogous to the “effective number of parties” measure used in electoral studies to study the number of political parties in a system.  Essentially, the effective number of candidates measure gauges how many candidates were on the ballot, weighting each candidate by the number of votes each received.  If two candidates receive equal votes, the effective number of candidates is 2.0.  If one candidate receives 90% and the other 10%, the effective number of candidates is 1.2.  For the Democrats, the effective number of candidates was 1.5 when the incumbent Democrat was running for reelection, 1.8 when the seat was open, and 2.9 when a Republican was running for reelection.  For the Republicans, the effective number of candidates was 1.3 when the incumbent Republican was running for reelection, 2.0 when the seat was open, and 2.5 when the Democrat was running for reelection.

Seo-young Silvia Kim: The Benefits of In-Person Election Observation

Guest Blog by Seo-young Silvia Kim

Silvia Kim is a PhD candidate at Caltech, currently finishing her dissertation research on American Politics and Political Methodology. Silvia has been a key collaborator on the Monitoring the Election project. She’ll be starting her new position as an Assistant Professor in the Department of Government at American University in August 2020.

On Super Tuesday, I drove more than 170 miles alone in my tattered old car, zigzagging through both Los Angeles and Orange County for election observations, visiting nine vote centers from noon to 10pm. Usually our team policy is to go out in pairs, but this year I was determined to roam the new vote centers far and wide all day, so I volunteered to go alone.

I am a quantitative data analyst—that is to say, I revel in gathering and analyzing numbers. Qualitative research, which focuses on unquantifiable, non-numerical data, is usually not my turf and out of my interest. Yet ever since I jumped into the world of elections and election administration, I have been observing elections every primary and general Election Day. And I would never underestimate the importance of in-person observations in research.

The benefit of in-person observations are numerous. One gets to observe the election take place out in the open, the street-level bureaucrats and voters at their natural “habitat.” Once I arrive, I observe the exterior of the location, ask permission from the center lead to observe, stand still in a corner so that I do not get in the way of voter, and then observe for 10 to 30 minutes. When there is not much traffic at the center and there are no notable troubles, ten minutes could be enough. When there are long lines and apparent trouble at the location, sometimes even 30 minutes is not enough.

If time and place allow, I may also be able to chat with various vote center staff. This did not happen as much as in 2016 or 2018, as there was high turnout and the staff were busy. But during the early voting period, or in locations with less voters, or when a staff is biting into cold pizza slices, I get to ask questions about what is going on at the voting location. Are all check-in devices working properly? Did they receive all necessary equipment on time? Were communications with the Registrar smooth and readily available? Were there any particular spikes in provisional voting or voter information edits, and if so, why? In most cases, they are happy to provide answers, as I consolidate these into recommendations for the Registrar, as in the Los Angeles Vote Center Observation Report.

While these anecdotes may not necessarily be generalizable, they provide important intuition as to what to look for when numerical data actually arrives. For instance, I personally observed thousands of students milling in a line to vote, a vote center in Los Angeles County. Did the same happen in Orange County, where I did not get to see any college locations? When I analyzed the wait time data, as reported in our Orange County Vote Center Observation and Wait Time Report, I did indeed see long wait time at UCI, CSUF, and Chapman University’s data. Based on the intuition built from my observations, I can look for common patterns in the data more quickly. In other words, the qualitative analysis that I undertake provides direction and guidance.


With COVID-19, the administrators all around the United States are scrambling to prepare for the voting experience in the midst of a pandemic. It may not be possible to “observe” the election as I usually have. It will still be beneficial if alternatives can be implemented—for example, researchers talking directly to staff that have worked on the in-person voting locations via the phone. If not, we still hope that the intuition that we have gathered for Los Angeles and Orange County improve the voting experience of Southern California’s electorate in future elections.

The Blue Shift in California Elections

Guest Blog by Michelle Hyun

Michelle is an undergraduate student at Caltech. In the summer of 2019, she was a Summer Undergraduate Research Fellow (SURF) at Caltech. Her research was conducted in collaboration with Yimeng Li and R. Michael Alvarz. We have recently released a working paper, it’s now available online, “Why Do Election Results Change After Election Day? The Blue Shift in California Elections.”

With the presidential primaries ongoing, and the November 2020 general election looming, it is critical to explain the trends of voters and the integrity of the election. In many past elections, the occurrence of the electoral “Blue Shift,” in which vote margins are observed to shift towards favoring Democratic candidates, has provided a surge of votes in the later parts of the vote count that has caused changes in leads more often than expected. This shift can cause people to call into question the integrity of the election system, which is dangerous for the legitimacy of democratic elections and the participation of voters in their government.

The blue shift has been observed in several past elections: one such example was the 39th District’s 2018 election for the U.S. House of Representatives, Young Kim believed she had won the race, but after a few weeks, it was revealed that her opponent, Gil Cisneros, had actually won. Elections in Orange County, California in 2012, 2014, 2016, and 2018 for House of Representative seats, gubernatorial seats, and presidential seats were analyzed to seek the cause of the drift. Shifts occurred across almost all of these elections, and while they may not have been enough to change the results of all the elections, the drift was certainly enough to raise questions.

Technological advances have made ballot counting and transmission of election results faster than ever. In many states including California, soon after polls close, election officials release results from early-voting ballots and mail ballots that have been processed before Election Day, followed by regular ballots cast on Election Day as precincts report them. Major cable networks, radio stations, and other media organizations receive these results from The Associated Press correspondents stationed at local government offices and data feeds provided by local governments as soon as they become available and make projections on most races. As a result, for voters following Election Day coverage on TV, radio, the Internet, or through morning newspapers, it may appear that elections are mostly over except for a few close contests by the end of Election Night. This perception masks the reality that a significant fraction of ballots is counted after Election Day, especially in states like California where voting by mail and provisional ballots are common.

This paper shows that the demographics of the voters and the number of ballots that are counted later in the election process are directly related to the magnitude of the blue shift. Using data from the Orange County Registrar of Voters (OCROV), we were able to find a positive association between Democratic voters and blue shifts; additionally, using data from the Cooperative Congressional Election Survey (CCES) and the Survey of the Performance of American Elections (SPAE), we were able to find that young, non-white voters are more likely to cast ballots that are counted later in the vote count process. Our findings are significant in that they explain a phenomenon that may call into question the integrity of our voting system. As the presidential primaries continue and as the general election approaches, we seek to establish voter confidence to encourage voter participation and ensure a smooth transition of power.

Will Expanded Early Voting Help with Social Distancing? Maybe Not

By Charles Stewart III, MIT

The most promising solution to instill physical distancing in elections during the current COVID-19 crisis is increasing the availability of vote-by-mail options. Another suggested strategy has been increased early voting. The idea behind both is to “dedensify” polling places. While moving people to voting by mail will certainly do this, it’s unclear that more early voting will.

Whether early voting is part of the solution depends on whether early voting locations are less densely populated than Election Day polling places. From my initial look at the data, they may not be—although a lot more work needs to be done to know for sure.

For starters, I looked at the wonderful data available from the North Carolina State Board of Elections’ ftp site. From the data there, I could find out how many people voted in 2016 at every early voting site in the state, and the day when they voted. I was able to match that information with other data on the site that reported the hours when these early voting sites were open. From that, I could calculate the average number of early voters in each site on each day.

In addition, I was also able to use the voter history file to calculate the number of people who voted in-person on Election Day at each precinct.

The accompanying figure illustrates the results. (Click on this and the other graphs to enbiggen.)  Throughout the early voting period in 2016, the average number of voters in each polling place was in the 60-to-75 range. This contrasts with Election Day, when the average was 41.

Thus, simply shifting Election Day voters to early voting, at least in North Carolina, is not an obvious strategy. In fact, in a state like North Carolina, the move to early voting would seem to benefit early voters even more than Election Day voters.

I must quickly add some caveats before moving on. First, North Carolina may not be representative. In 2016, 61 percent of voters cast ballots early, through what they call “One-Stop Absentee Voting;” 35 percent of votes were cast on Election Day, with the remaining 4 percent being cast by mail. Thus, the early voting sites may already be congested, which is unlikely to be the case in most states. Still, in 2016, early voting was the dominant mode in seven or eight states, North Carolina included. The analysis here may be the most relevant to these.

Second, this analysis assumes nothing else changes, other than shifting people from Election Day to early voting. For instance, it assumes no more early voting sites are created. Obviously, if more early voting sites were created and voters used them, density in these sites could drop.

In addition, I haven’t compared the actual rooms and buildings that house early voting sites and precincts. This is clearly one example of how particular facts are important. If the alternative is between a cramped church basement on Election Day or a large community center multi-purpose room for early voting, the multi-purpose room can probably handle an equal volume of voters more safely than the basement. The list of early voting sites in North Carolina includes all sorts of locations, most of which seem pretty similar to locations that are used for Election Day voting, as well.

Finally, this analysis hasn’t taken a look at the variability of voter density during particular times of the day. This, of course, is critical, for implementing safe physical distancing practices. We know from the research I have helped the Bipartisan Policy Center conduct and the academic research I have been a part of that there’s a crunch of voters on Election Day when the polls open. Referring back to the North Carolina graph, it wouldn’t surprise me to find out that the average polling place in North Carolina handled 80 voters per hour in the first hour of Election Day voting, before falling to an average of 30-35 the rest of the day.

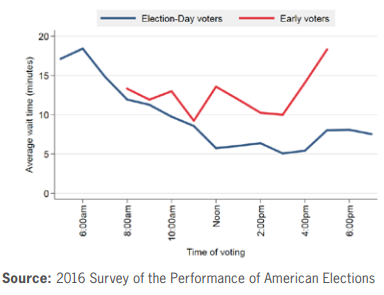
Less observational research has been done of early voting sites. The survey research I have done suggests that arrival rates at early voting sites are spread more evenly across the day than on Election Day. The accompanying graph, which is taken from the 2016 report on wait times published by the BPC, shows average wait times at various times of the day, taking the nation as a whole. The good news is that there is not a beginning-of-the-day rush with early voting, over all. The bad news is that if there is congestion, it lasts all day long.

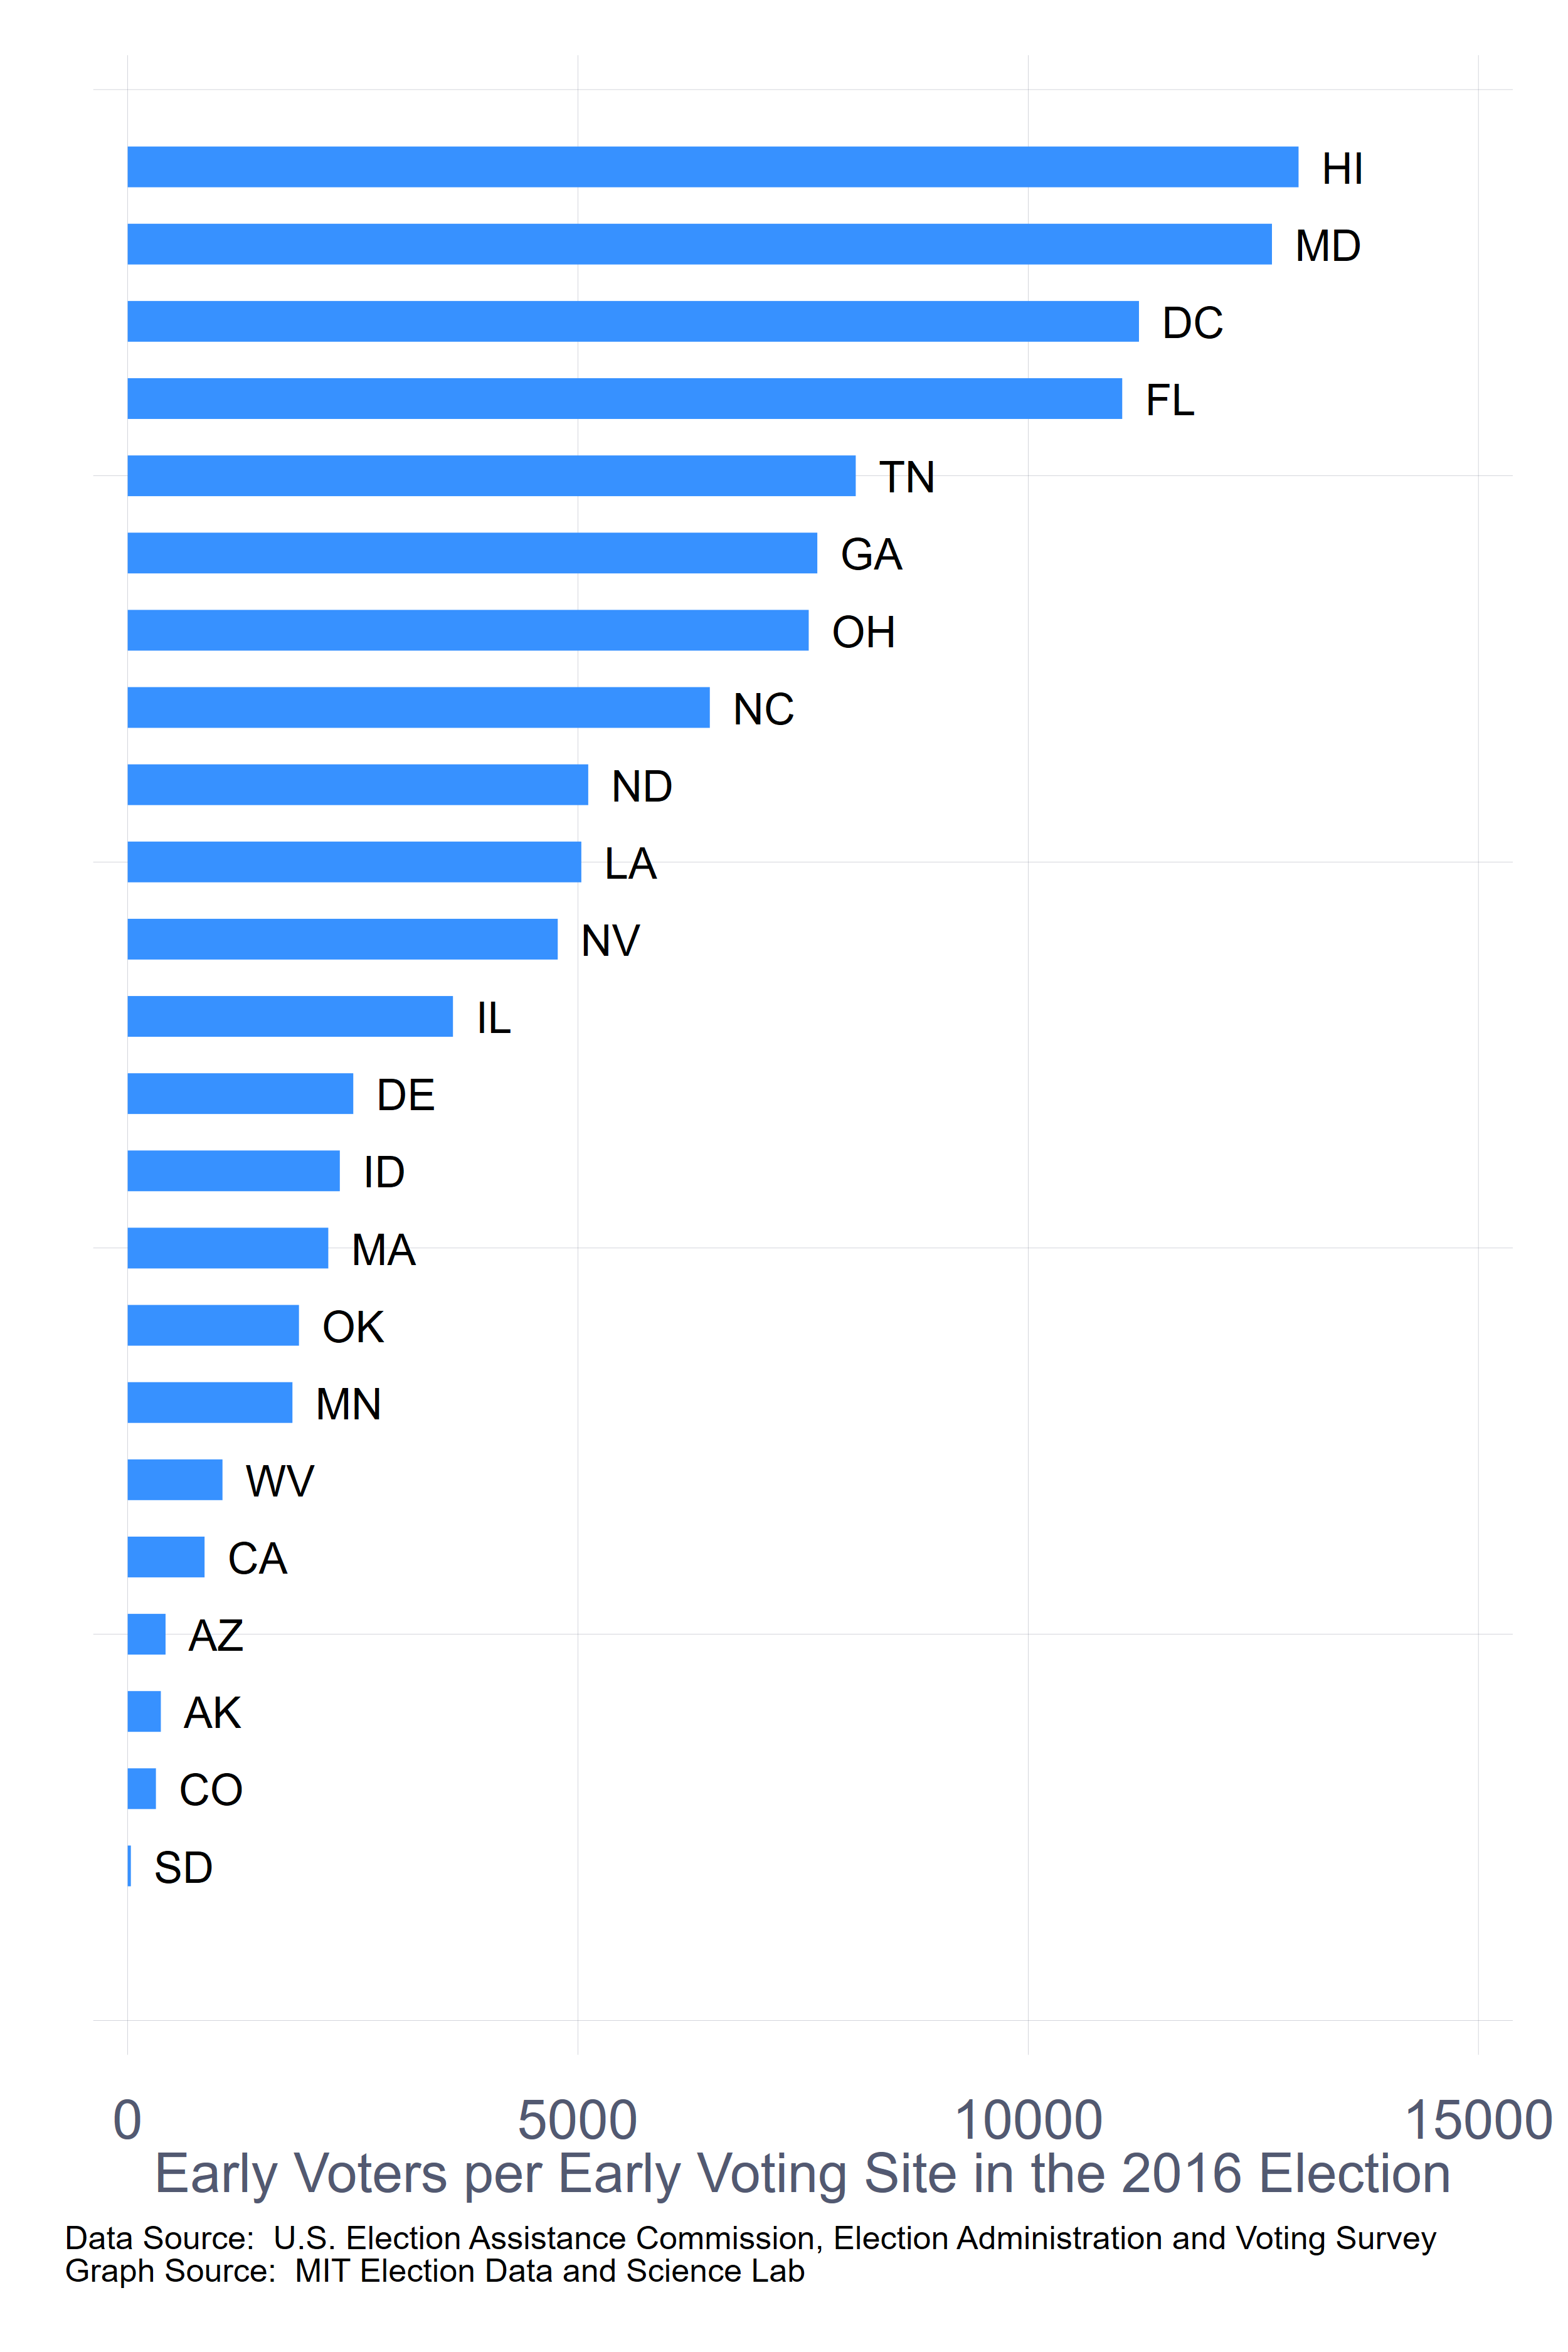
I end with one last figure, which shows the average number of voters who went through each early voting site among 23 states in 2016. The data are from the EAC’s Election Administration and Voting Survey. The states displayed are those that reported sufficient data to calculate meaningful statistics. (This means, for instance, that Texas, a state with a lot of early voting is excluded, because a lot of Texas counties did not report how many people voted early.)

As with the North Carolina analysis, this is a rough first cut at getting a sense about where the most congested early voting sites might be. It’s rough, most obviously, because it doesn’t take into account how many days of early voting there are in the states, nor how many hours the individual sites were open. And, of course, it does not consider the variability in early vote center locations.

Also, some of the states with a highest early-voter-to-early-voting-site ratios are those without a lot of early voting, measured by the percentage of voters who use it. This looks to be true, for instance of Hawaii , Maryland, and D.C.

Nonetheless, as a first cut, it shows that the strategy of shifting more people to early voting in Minnesota or Massachusetts may be potentially more promising than doing so in Maryland or Washington, DC.

Analysis like this is no substitute for the detailed analysis that states and localities will be undertaking in the coming weeks, as they consider whether expanding early voting is right for them—and if it is right, how to do it.

It should serve as a cautionary note for the public and policymakers, however, as they clamor for “obvious” solutions to the problem of voting in the age of COVID-19. Nothing is obvious in this business. It’s all about the details. That’s why coming up with solutions that protect the 2020 election while protecting our health will take so much effort.

Thoughts on the Natural Disaster and Emergency Ballot Act (NBEBA) and the ACCESS Act

By Charles Stewart III, MIT

Things are moving fast on Capitol Hill regarding emergency stimulus funding and its relationship to making the 2020 election safe in the midst of the coronavirus emergency.

Here are some thoughts about the two major pieces of legislation that have been proposed on this subject, the Natural Disaster and Emergency Ballot Act of 2020 (DEBA) in the Senate and the ACCESS Act in the House. (The ACCESS Act is part of Nancy’s Pelosi’s broader “Take Responsibility for Workers and Family Act.”) Both are similar—in some cases, identical.

To discipline things, I have organized my thoughts along the lines of the ten steps that Nate Persily and I proposed in the Lawfare Blog last week on the needed response of the nation in light of the medical crisis. These comments are mine alone, not Nate’s. Each heading is one of the ten steps. The text that follows is commentary.

  1. The United States must plan for a significant shift to mail balloting for the 2020 election. This legislation provides one model for nudging states toward a significant shift in offering mail balloting. The biggest shift would come for states that currently require an excuse to receive an absentee ballot, which numbers seventeen in all. In 2016, eight states saw fewer than 5% of ballots cast by mail. By mandating that states, at the very least, move to a “no-excuse” regime, there will undoubtedly be more mail balloting in 2020. How much more will depend on the receptiveness of voters and the urgency of the situation come next fall.
  2. The nation must commit to supporting the logistical effort necessary to conduct mail elections with integrity and efficiency. These bills won’t, by themselves, create the logistical infrastructure necessary to conduct mail elections with integrity and efficiency. As we specify in the Lawfare article, voting by mail is complex. In the states that have expanded it the most, they have done so over several election cycles, fine-tuning the process as time went along. Certainly, money will be necessary to finance any expansion of voting by mail. What is more critical is the expansion of management capacity to match.
  3. Any efforts to expand voting by mail in time for the November election must appreciate the partisan polarization surrounding changes in election rules. To state the obvious, no Republicans have signed onto these efforts, which doom them from the start, at least as written. This is not to say that they’re a waste of time. Certainly, they provide a starting point for bargaining and for signaling to allied groups that the Democratic Party is committed to these issues. (On this point, the absence of a highly visible congressional Republican plan to address the election emergency is telling.)  However, it must be recognized that all the energy around the House and Senate efforts has created a Republican backlash in Congress that is making it more difficult to support measures that Republicans might otherwise support, such as providing funds to states to pursue the strategies they feel the most comfortable with, without federal prescriptions. In that context, the recent op-ed piece by Michael Steele and Eli Lehrer in the Washington Times encouraging conservatives to get behind expanded vote-by-mail in November is heartening.
  4. States should approach this situation as an emergency, not as an opportunity to make long-term changes to election policy. This is another dimension on which the House and Senate efforts run contrary to the recommendations Nate and I made in the Lawfare post. Both the House and Senate efforts mandate that states make permanent changes to their election laws, and to make long-term investments in technologies. As we note in our post, Florida and New Jersey have previously interpreted state laws flexibly in the face of hurricanes bearing down on them as elections were being conducted, only to return to the status quo after the emergency had passed. Citizens understand extraordinary actions taken in extraordinary situations. To push a major permanent policy shift under the guise of an emergency will be viewed suspiciously by a large segment of the population, and certainly by the political class.
  5. States need to reconsider the division of labor between state and local authorities in the conduct of elections. It is not clear that these efforts address the state-local balance of responsibility directly, nor should they necessarily. However, assuming that most states will be spending the next few months planning how to ramp-up mail-ballot operations quickly, it makes sense to imagine that states will bear greater responsibility for certain new logistical burdens, even in states with strong traditions of local control of elections.
  6. Election officials need to be working with the Postal Service immediately to ensure a smooth transition to expanded mail balloting. These efforts do not address the Postal Service directly, other than provide a vehicle for diverting more business its way—which is a good thing. We all know the USPS has its struggles. Nonetheless, it views its role in conveying ballots with pride. The detail here is that local USPS operations and election officials in states that have had low vote-by-mail volume will now need to create working relationships that have taken years to establish in vote-by-mail states. As with all things related to voting by mail, it takes a while to develop these working relationships. We have to anticipate that there will be local bumps in the road.
  7. States need to communicate clearly to voters how mail ballots will be distributed, and develop plans such that ballots actually get to the voters intended. The House bill requires states to provide systems so that voters can request mail ballots online, and then track then electronically. This is good public policy. I doubt, however, that states without these capacities already will be able to develop them in time for November, unless they are already working to create this capacity. In the past, hastily developed electronic request systems have created security vulnerabilities. And, in general, ballot-tracking systems have taken years, not months, to develop. The harder we push everyone to vote by mail this November, the more we will have to plan for the fact that some voters will not get their ballots mailed to them.
  8. In-person voting won’t go away. This is where I believe the House and Senate efforts fall the shortest. Yes, we need to push more people to vote by mail, on an emergency basis, to protect public health and ensure that the November election will proceed on schedule. Still, there are a lot of reasons to believe that in-person voting will continue to be the dominant mode of voting in 2020, especially when we combine Election-Day and early voting. Other than a general requirement that states develop emergency plans for conducting elections during health emergencies, I don’t read anything in these efforts that particularly target in-person voting.
  9. Election officials need to communicate with the public to address the anxiety that is likely to attend the counting of votes. It is probably too much to ask any legislation considered by Congress to address this point.
  10. Adjustments to voting rules must respect behavioral regularities that voters have demonstrated over the years, and are unlikely to change, even in the midst of a public health crisis. This is tied to point # 8. We have to assume that tens of millions of people will choose to vote in person in November 2020. Legislation that focuses on moving voters to mail balloting doesn’t directly address this fact, other than to reduce the number of in-person voters, which can’t be dismissed. That’s not a trivial thing, but it is important to devote attention to organizing in-person voting to safely accommodate everyone who wishes to vote that way. Furthermore, we have to assume that most voters will not pay attention to COVID-19-avoidance measures for the election until sometime late in October. Again, it is probably too much to ask a single bill to focus on all aspects of the public health emergency, but it is telling that the House and Senate efforts sidestep the significant challenges to public education that face election officials in 2020.

Overall, the House and Senate efforts have received a lot of press attention, but must be understood as a Democratic plan for the 2020 elections, not as a blueprint for a bipartisan solution for the emergency at hand. Even though I agree with the aims of much of the legislation, I suspect that the effort to push a policy agenda so closely allied with Democratic orthodoxy talking point creates a bump in the road toward negotiating the final bailout package. Leaving my reservations aside, the presence of a Republican majority in the Senate and a potential presidential veto make these legislative efforts dead letters, at least in this Congress.

This doesn’t mean they are dead letters in the long term, though. We should remember that an early version of the National Voter Registration Act (NVRA) was passed by a Democratic Congress in 1991, only to be vetoed by President George H.W. Bush. Despite losing the battle, Democrats tried again in 1993, following the election of Bill Clinton, who signed the NVRA into law.

In the world we live in now, I hope the position-taking among congressional Democrats, to stake out a long-term position about election reform, does not undermine the immediate, pressing issue, which is to give election officials the support they need now, to get done what needs to be done to assure the November 2020 election goes off as planned.

Some Demographics on Voting by Mail

By Charles Stewart III, MIT

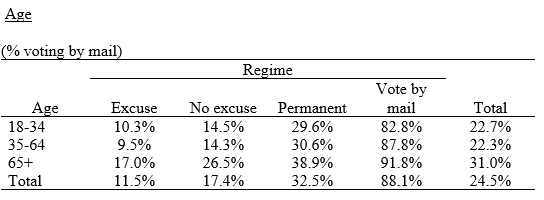
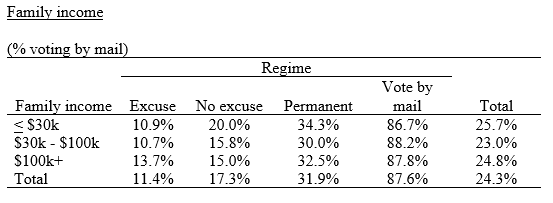
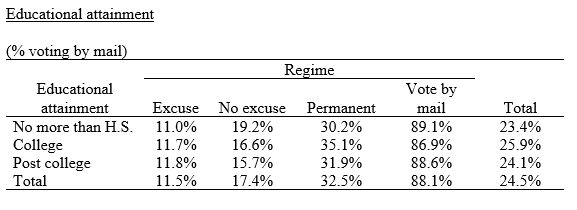
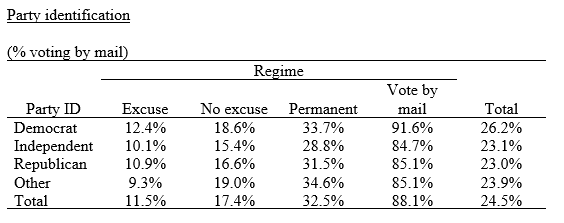
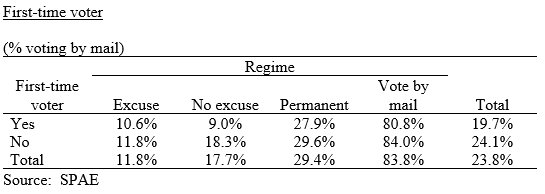
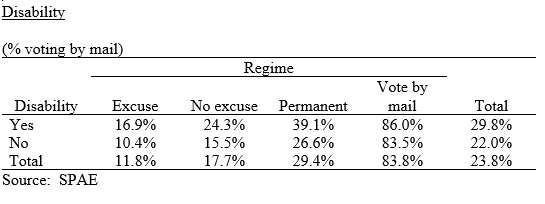
With the sudden surge of interest in mail balloting because of the COVID-19 emergency, there’s also been some interest in questions about who tends to use mail ballots now and who would like to use mail ballots. Here is provide some basic demographics related to the question. Because there’s so much going on right now, I won’t provide much commentary, allowing the numbers to “speak for themselves,” which is rarely a good idea.

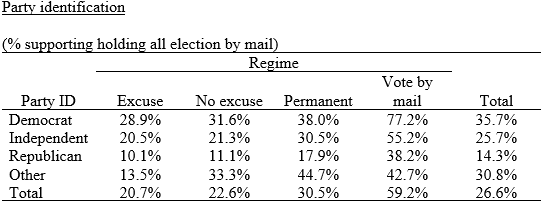
The tables here address the following questions:

  1.  Who voted by mail in the 2016 presidential election, by salient demographics (i.e., age, race, education, income, partisanship)?
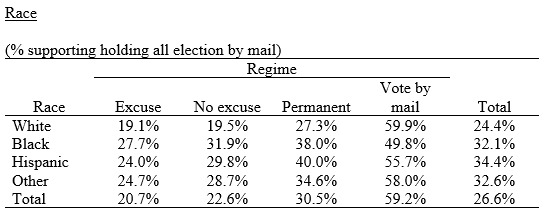
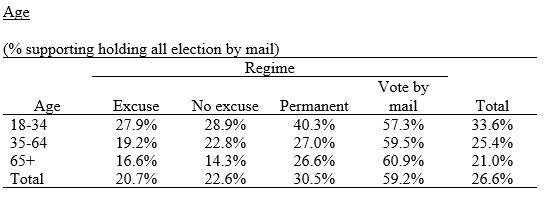
  2. Who supports expanded voting by mail?
  3. How do people return mail ballots?

The data about the usage of mail ballots and demographics mostly comes from the 2016 Cooperative Congressional Election Study (CCES). Information about support for running elections entirely by mail and the return of mail ballots comes from the 2016 Survey of the Performance of American Elections (SPAE); I also used the SPAE for information related to the use of mail ballots by people with disabilities.

Patterns of mail-ballot usage and support for mail balloting need to be mindful of the fact that states organize mail balloting differently. Relying on the coding first suggested by the National Conference on State Legislatures, I divide states into four regimes: (1) excuse required for an absentee ballot, (2) no excuse required for an absentee ballot, (3) permanent mail ballot list, and (4) complete vote by mail (or “vote at home”). The following tables maintain this distinction.

Here are the take-aways:

  1. There is very little demographic difference in the use of mail ballots.
  2. The one exception is related to age, where voters older than 65 are more likely to use them than younger voters. (Note that some states, even those that generally require an excuse to vote absentee, allow older voters to vote by mail without an excuse.)
  3. The lack of a major difference between demographic groups is contrary to some claims I have been hearing (and some I believed myself before running the numbers).
  4. Contrary to the claims of some, African Americans appear to be slightly more supportive of vote-by-mail reforms than whites.
  5. Despite being the demographic most likely to take advantage of voting by mail, the age group most in opposition to expanded voting by mail are those 65 and older.  The relationship is strongest in non-vote-by-mail states.
  6. Voters in vote-by-mail states who return their mail ballots in person are more confident their votes were counted than those who mailed them back.
  7. Mail voters in vote-by-mail states are more confident their vote was counted as cast than mail voters in other states.
  8. There is still a substantial fraction of voters in vote-by-mail states that believe that all elections should not be held by mail.

Demographics and the use of mail ballots in 2016.

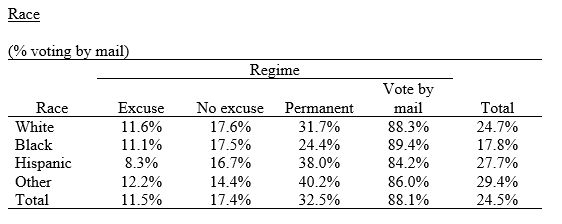
The following tables report the percentage of voters who report that they voted by mail in 2016. Responses are limited to those whose participation in the election was verified by matching to voter lists. Data source: CCES, unless otherwise noted.


Support for holding all elections by mail

The following tables report the percentage of respondents who stated that they supported “holding all elections by mail.” (Source:  SPAE)


Return of mail ballots

The following tables report the method of return of mail ballots, along with the relationship between the method of return and confidence that one’s ballot was counted as cast. (Source: SPAE)

Seven Thoughts on Voting in Age of Covid-19

The following is a series of thoughts about the response of the election community in light of the unfolding health emergency. These thoughts are current as of the moment they are written—Monday morning, March 16, 2020—and will no doubt change as the situation evolves.

1. The election must go on. If we want a government headed by elected officials, we have to elect them. There may be opportunities for delaying primary elections, but the date of the November general election is hard-wired, through statute and the constitution. That’s a hard constraint around which we must design a response.

2. Responses to the crisis must be based on the best scientific evidence we have. Evidence about the public health crisis is grounded in medical science, obviously, and we all will be learning from medical and other scientific experts about how to protect ourselves. There is evidence from the social sciences (including management science) that can also be used to inform best practices that are consistent with best medical practice.

3. Confidence in the election must be maintained as accommodations are made. The research suggests that three major factors affect voter confidence: (1) whether your favored candidate won the election, (2) whether you had a good experience when you voted, and (3) whether a major election practice is new. Election administrators can’t (shouldn’t!) influence who wins, but it should be recognized that any change to election practices—even if bolstered by impartial scientific evidence made with the best of nonpartisan intentions—will be interpreted through a partisan lens. If states make changes to election laws without bipartisan buy-in, a “legitimacy tax” will be paid in November. In addition, radical changes to election administration are rarely made in presidential years, and for good reason. Big changes to policy generally require big changes to processes, training, equipment, real estate, etc. Without attention to managing these changes, the voter experience risks taking a hit. Finally, voters in different parts of the country regard certain types of voting as more or less legitimate. To be quite precise about this, voters living in states where everyone, from elected officials to rank-and-file voters, has believed all their lives that mail voting as an invitation to election fraud, are unlikely to spin on a dime in their attitudes.

4. There may be a lot of latitude in current laws already to adapt to the Covid-19 emergency. Incremental changes may get us the rest of the way. Over the past 30 years, there’s been an organic shift in most states toward more convenient ways of voting. Taking the next step in that evolution may be the right avenue for most states. If you already have a huge permanent absentee list, the next step—mailing a ballot to everyone—may not be such a big lift. If you require an excuse to vote absentee, making it clear that the need to enforce social distancing falls under the medical excuse may work. Bottom line: states and localities can ask what sort of flexibility they have within established laws before they take on the task of major reform under current circumstances.

5. We are about to learn a lot about balancing the need to socially distance with the need to socially congregate. Election officials will benefit from that learning. Yes, we need to self-isolate. At the same time, it is likely that feeding stations will need to be set up in urban and suburban areas, kids of parents who fill critical jobs will be send to attend day care in large numbers, and we all will need to go to grocery stores to shop for food. These realities will demand that we learn how to queue up, transact business, and move about in an enclosed environment while minimizing health risks. What we learn from these everyday transactions will inform how election officials will want to approach November.

6. Capacity planning will be as critical as changing voting laws and regulations. All approaches to dealing with the Covid-19 emergency will challenge the capacity of the election process. Even if mail balloting increases by a meager 10% in 2020 (compared to 2016), that will burden election officials significantly. (The “flatten the curve” point being made about spreading out the timeline of Covid-19 infection has it application to election administration, as well.)

7. The campaigns will have an important role to play in helping “spread the vote.” In recent years, the expansion of mail and in-person early voting has been partially driven by the efforts of the political campaigns to encourage people to vote before the Election Day. Of course, they do this because they believe it is politically advantageous. I have no doubt in my mind that efforts by the campaigns in 2020 to encourage supporters to vote early, either by mail or in person, will fall on more receptive ears than in the past.

Guest Blog by Andrew Sinclair: California’s Top-Two Primary

California’s Top-Two Primary, by Andrew Sinclair

After 2020’s “Super Tuesday,” many of the news headlines in California (and the rest of the nation) will focus on the outcome of the Democratic Party’s presidential nomination contests. Yet, there are other elections taking place in California at the same time, continuing California’s experiment with the “top-two primary.”

There are actually three types of elections taking place in California. The presidential contest is a traditional partisan primary. Unaffiliated (“no party preference”) voters can participate in the Democratic Party primary if they request a Democratic ballot. Still, the election is partisan in nature: it helps determine which candidate will be the party’s nominee for the November general election. The other two kinds of elections are both variants of nonpartisan elections.

California uses the nonpartisan top-two election procedure for “voter-nominated offices.” This year, these are the State Assembly, State Senate, and U.S. House elections (there are no statewide office or U.S. Senate elections this year). For these elections, every voter can choose between all of the candidates. The two candidates with the most votes advance to the general election in November, even if they come from the same party. Candidates for these offices list their party preference on the ballot. For a short explainer on how this works, Christian Grose (USC) has a great 4-minute description in an interview with NPR: here.

California also holds elections for “nonpartisan offices.” This can be a bit confusing, since the top-two for the voter-nominated offices also is a kind of nonpartisan election – but for these elections (county supervisor, etc.), the candidates also do not list their own party preference on the ballot and, if one candidate gets more than 50% in the primary, that person is simply elected. Otherwise, these are pretty similar to the voter-nominated top-two elections.

California adopted the nonpartisan top-two procedure for voter-nominated offices by passing Proposition 14 in 2010. Michael Alvarez and I wrote a book – Nonpartisan Primary Election Reform: Mitigating Mischief (Cambridge University Press, 2015) – about the first use of the top-two in California in 2012. I have been following along since then as we have learned more in each cycle about how this rule operates.

The top-two procedure is different than what we see in most states, both in the primary and general election (Ian O’Grady and I make this argument in the Routledge Handbook of Primary Elections – which is a nice resource; the other chapters are great). For political scientists, the institutional variation the top-two represents provides an interesting window into primary elections, voter behavior more generally, and the operation of political parties. This post highlights a few things to look for in the 2020 cycle here in California.

Why 2020 is unique.

This will be the fifth cycle with the rules in California, although each election year has taken place in a unique context in terms of top-of-the-ticket races and the state of national politics. The 2020 election will be the first of this era to take place in March, with the Democratic Party’s nomination far from over. With all of the previous primaries in June, California had a more limited role in the 2012 and 2016 presidential primaries. It is also the first of the top-two elections to have no statewide elections (either statewide offices as in 2014 and 2018 or a U.S. Senate election as in 2012, 2016, and 2018).

It may be the case that Republicans, without a meaningful presidential contest or statewide election, will turn out at much lower rates than Democrats. Registered Republican voters make up only 24% of the state’s electorate (as of the Feb. 18 report from the Sec. of State). Since all candidates – Republicans and Democrats alike – are in the same primary for the voter-nominated offices, low turnout for one party can potentially make it hard for that party’s candidates to make it to the November ballot.

What to look for.

How many same-party general elections will there be? In past election cycles, it has still been the case that most primaries sent one Republican and one Democrat to the general election. If the Republican vote does collapse, it is possible that we may see more Democrat-on-Democrat general elections.

Where are the same-party elections? Following up on an observation in the Alvarez-Sinclair book, I (and coauthors Ian O’Grady, Brock McIntosh, and Carrie Nordlund) examined over a couple of cycles where these same-party elections tended to take place. The punchline: the more politically lopsided the district, the more likely it is to see two candidates of the same party advance to the general election. These can make the election a lot more competitive than they likely would be otherwise, too. Does that finding continue to hold?

How well do party-endorsed candidates do? One of the prevailing theories of primary elections is that parties generally do a pretty good job of organizing to back their preferred candidates (for a neat recent book on this, see Hans Hassell’s The Party’s Primary, among others).

What happens to races with crowded fields? In not every contest do the parties manage to keep the number of candidates of their own party down. While somewhat odd results do not happen very often, they can: nearly everyone cites the 2012 Miller-Dutton CD 31 race when they want an example in part because it illustrates a potential issue and in part because there are not many other examples. The idea is that the vote can split across candidates in such a way that the majority party could, if the cards fall exactly right, end up shut out of the general election.

How do moderate candidates do? This was, of course, one of the original claims about the top-two primary (for a nice summary from Eric McGhee at PPIC: here). As Nolan McCarty wrote in his recent book on polarization, results of studies on the impact of the primary reform on polarization are “decidedly mixed.” This is part of the fun of political science – as multiple scholars use different approaches to work towards an understanding of a problem. See work from Christian Grose (here) and Eric McGhee and Boris Shor (here).

Do any incumbents look to face stiff challenges in November? Beyond the question of ideological moderation, it may also be the case that voters can use the top-two to eject candidates from office who have performed poorly (potentially democratically meaningful, even if the replacement is ideologically similar).

What happens with third party/independent candidates? These candidacies have not generally been very successful under the top-two at reaching the general election (although, under the old partisan system, they were also not very successful at winning offices).

Are voters happy with their choices? In the surveys for our book, Michael Alvarez and I found that voters were fairly uncertain about what they expected from the top-two. As they experience it: do they learn about it, and get used to it? Or discover that they don’t like it?

Particular Races to Watch.

Congressional District 8. This used to be Paul Cook’s (R) district; in announcing his retirement, he set off one of the more interesting contests in this cycle. Republican Assemblyman Jay Obernolte won the Republican Party endorsement but there are five Republicans on the ballot in total, including a former candidate for Governor, Tim Donnelly. Yet there are also three Democrats and one NPP candidate on the ballot.

Congressional District 25. This is the Katie Hill seat – and it drew six Democrats, six Republicans, and one NPP candidate. The state Republican Party did not endorse a candidate and there are several potential contenders. The Democratic Party has not issued an endorsement in this race either. To further compound the story, there is a simultaneous special election to fill the remainder of the term.

There are others that will be pretty interesting, but those two are certainly worth checking in on as the returns come in. Of course, it may be quite some time before we really know what the results are for some tightly contested races.

What’s hard to see this week.

The top-two election procedure impacts both the primary and the general election. Some of the research on the top-two points towards finding the most interesting results in the general election. In the surveys Michael Alvarez and I conducted in 2012, we found that mostly voters tried to choose ideologically proximate candidates in the primary. (See also a nice study: Ahler, Citrin, and Lenz: here). But what happens once two candidates of the same party advance to the general election?

There is interesting work now (see Badas and Stauffer 2019) on gender and nonpartisan elections as well as race and ethnicity in same-party general elections under the top-two (see Sadhwani and Mendez 2018). If party is not a cue, voters have to decide somehow; Betsy Sinclair and Michael Wray (2105) found that same-party elections corresponded with increased Google searching just before the election.

One of the more commonly mentioned consequences of same-party elections in November, also, is the possibility that “orphaned” voters will not participate (see Nagler 2015, Masket, via Vox, 2016, Fisk 2019 – Fisk with the on-point title of “No Republican, No Vote”). Yet, many still do participate, and we will have to see over the next several months how candidates in these same-party races try to appeal to these voters. It is possible to get something like what reformers intended (something like the 2012 AD5 race) if a centrist candidate holds on to a sizable enough – if short of a majority – of the voters of their own party, and pulls in just enough of the orphaned voters as well. That’s a delicate balancing act, though, because going too far towards recruiting support from the other party can cost a candidate support within their own.

In the larger picture, I would also say that it can take a long time to assess how political institutions function. Politics is a complicated business, and many of the institutions interact. Some of the scholars referenced here have noted that California passed the top-two procedure and the citizen redistricting process around the same time, making it hard to sort out the impact of each. I also wrote, in a paper on the adoption of the simple majority requirement to pass the state budget (Proposition 25, also in 2010), that it directly impacted one of the main motivations for passing the top-two (to get more moderate legislators, to be able to pass a budget). The election rules also operate within a political context defined by the party and ideological divisions present at the time (I am particularly fond of Hans Noel’s book on the difference between these: link). With different ideological and social cleavages, the rules may also have different consequences.

About the author: Andrew Sinclair is an Assistant Professor of Government at Claremont McKenna College. He has studied and written about California’s top-two primary process, as well as the primary election procedures in other states.