Category Archives: 2020 Presidential Election

Voter Confidence and Perceptions of Election Fraud in the 2020 Presidential Election

Our Monitoring the Election project has released two briefs, reporting on preliminary results from a national survey of registered voters conducted immediately after the November 3, 2020 Presidential Election.

These two briefs provide a glimpse into how the heated rhetoric about election and voter fraud before and during the general election has been received by the American electorate.

One of these briefs focuses on the general question of voter confidence in the election.

We asked registered voters to answer four questions about their confidence regarding the 2020 presidential election: their confidence that their own ballot was counted as intended (asked to registered voters who cast a ballot), and their confidence that ballots were counted in their county, their state, and across the nation (the latter three asked to all registered voters). The topline results are shown in this graph from the report.

Voter Confidence

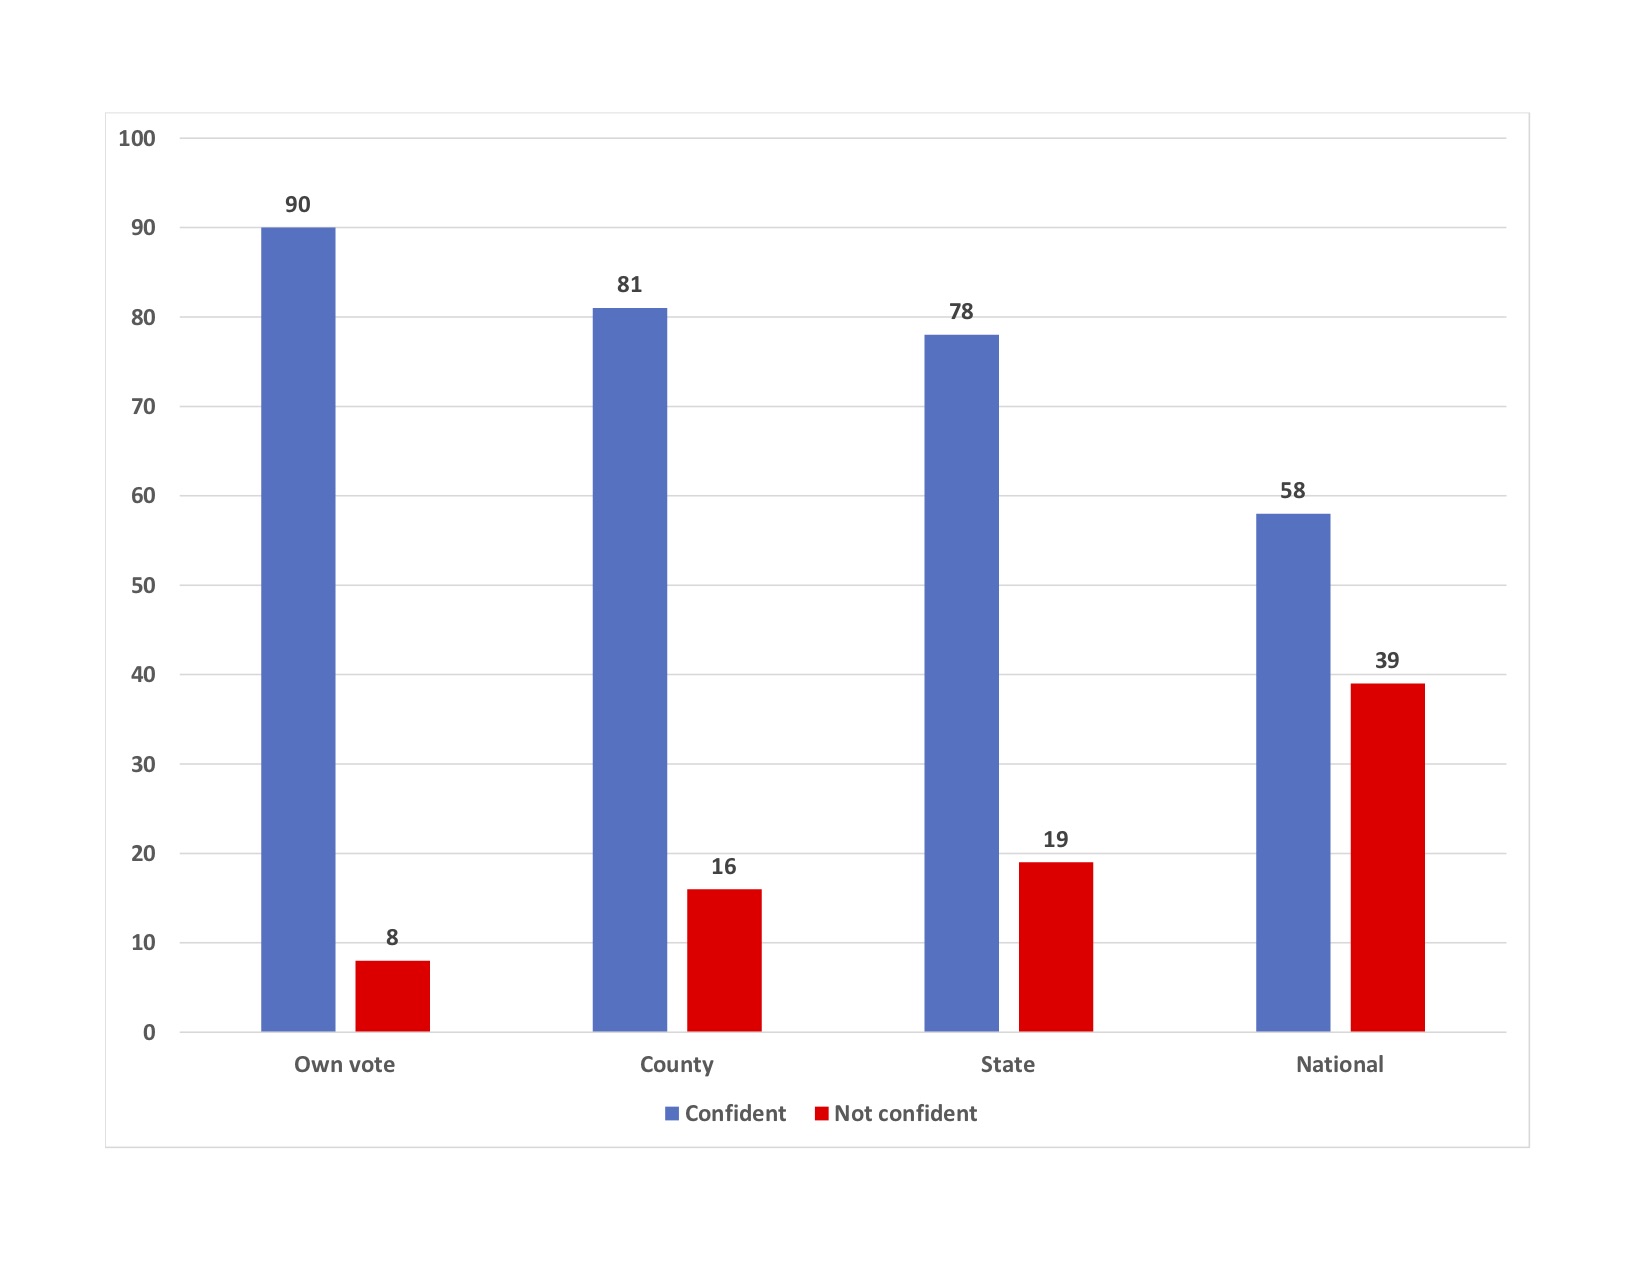
As you can see, 90% of voters were confident that their ballot was counted as they intended, which given the heated rhetoric about this election is a remarkable number. It’s also remarkable that about eight of ten registered voters have confidence that votes were counted as intended in their counties and their states. Those are also remarkable numbers, and in my opinion, a strong indication that American voters are overall quite confident that their local and state election administration was handled well in this contested election.

But when we get to the national level, we find that just over a majority of American registered voters (58%) were confident about the administration of this fall’s election, and that 39% lacked confidence (the remaining registered voters didn’t have an opinion). This lower level of confidence about the national administration of the election is concerning.

Digging one layer deeper into the data, we looked at perceptions of confidence by partisanship and presidential vote. We see high levels of confidences for both Republicans and Democrats, and for both those who voted for Trump or Biden. Nearly every Democratic voters (and nearly every Biden voter) in our sample was confidence that their own ballot was counted as intended: 86% of Democrats were confidence, and 97% of Biden voters were confident. Among Republicans confidence in their own vote was high, with 85% of Republicans and 84% of Trump voters confident in their own vote being counted.

But moving to the national level, the sharp degree of partisan polarization in the United States emerges: while many Democratic and Biden voters were confident about the administration of the election nationally (84% among Democrats, and 87% among Biden voters), most Republicans and Trump supporters lacked confidence in the national administration of the election, with 66% of Republican registered voters lacking confidence, and 70% of Trump voters lacking confidence in the national administration of the vote.

The other brief, authored by Yimeng Li, focuses on a number of questions in the survey asking registered voters about their perceptions that various types of election or voter fraud might occur, and also about hacking of the voting technology in the 2020 election. The survey included questions asking whether the respondent thought that various types of election or voter fraud were common or not:

  • Double voting.
  • Stealing or tampering with voted ballots.
  • Voter impersonation.
  • Non-citizen voting.
  • People voting absentee ballots of other voters.
  • Officials changing reported vote counts in a way that is not a true reflection of how the ballots were actually counted.

Yimeng found that there is a sizable proportion of the American electorate that believes that voter or election frauds like these occur or are common. To quote from the report:

There are many registered voters nationally who said that election or voter fraud
is very common (between 12% and 17% for different types of fraud) or occurs
occasionally (15-17%). Ballot stealing or tempering, fraudulent casting of absentee
ballots intended for another person, and non-citizen voting are perceived to be the
top three types of election or voter fraud. Only about half of the voters believe each
of the six types of fraud occurs infrequently or almost never.

Like we saw regarding voter confidence in the 2020 Presidential election, the perceptions of the American electorate are very polarized along partisan lines. Across the six different types of election or voter fraud we asked about in the survey (Table 2 of the brief), we generally see that majorities of Biden voters believe that these types of fraud are infrequent or that they never occur, while majorities of Trump voters believe that these types of fraud are very common or that they occur occasionally.

A good example of this regards non-citizen voting. Sixty-six percent of Biden voters said that non-citizen voting almost never occurs, while another 12% said it occurs infrequently. On the other hand, 35% of Trump voters said that non-citizen voting is very common, and another 25% said that it occurs occasionally. That’s a pretty stark partisan different in perceptions of the incidence of non-citizen votes.

So what does this all mean, in particular for future elections in the United States?

It seems clear from these topline estimates from this survey that the American electorate remains confident that their own votes were counted, and that they are quite confident that votes in their counties and states were counted as intended. Which is a good sign.

But we see much less confidence in the national administration of the election, where opinions are deeply divided on party lines. We also see that a reasonably large segment of the electorate believes that various types of election or voter fraud occur, and that perceptions about the incidence of election fraud are polarized by partisanship.

This indicates that voters are picking up on elite partisan rhetoric about election and voter fraud, which have been going on since 2016, and which of course has intensified in the past few weeks. But does this mean that despite high levels of voter participation in the 2020 presidential election, will those who lack confidence or are concerned with fraud might be less likely to vote in future federal elections (for example, the 2022 and 2024 elections)? Will the lower levels of confidence in the national administration of federal elections, and concerns about election fraud for some segments of the electorate, lead to further erosion of trust in American democratic institutions?

At this point it’s hard to know what might happen. But these survey results provide some cause for concern, and they show that we need to continue our work to inform the American electorate about the integrity of the 2020 presidential election.

We’ll be posting additional briefs from our survey in coming days and weeks on our website.

What’s Pennsylvania to Expect with Early Voting?

Charles Stewart III


The Healthy Elections Project has been running a series of surveys in a half dozen battleground states, asking how voters intend to cast their ballots.  I have previously published thoughts on Arizona, Florida, North Carolina and Wisconsin, with a bonus posting about Georgia (where we are not surveying, ourselves.)  This brief note focuses on Pennsylvania

First, as to the intentions themselves.  The table below shows that there was very little movement in reported intentions across the four waves of the surveys.  An ANOVA test fails to reject the null hypothesis that the four waves are drawn from separate samples, so I proceed using results from the pooled survey, discarding the “don’t knows.”

Vote mode intention among likely voters, including don’t knows

Date

Election Day

Early

Mail

Don’t know

N

Sept. 4 – Sept. 11

53.5%

2.6%

39.1%

4.8%

489

Sept. 16 – Sept. 25

56.2%

2.2%

39.3%

2.2%

484

Sept. 30 – Oct. 9

56.8%

1.9%

38.2%

3.1%

492

Oct. 14 – Oct. 21

51.9%

3.5%

41.7%

3.0%

491

Total

54.6%

2.6%

39.6%

3.3%

1,957


Vote mode intention among likely voters, excluding don’t knows

Date

Election Day

Early

Mail

N

Sept. 4 – Sept. 11

56.2%

2.8%

41.0%

465

Sept. 16 – Sept. 25

57.5%

2.3%

40.2%

473

Sept. 30 – Oct. 9

58.6%

2.0%

39.4%

477

Oct. 14 – Oct. 21

53.5%

3.6%

43.0%

476

Total

56.5%

2.6%

40.9%

1,892

(By the way, the overall 95% confidence interval for all four waves combined is around +/- 2.2 points.  For any one wave, it’s around 4.4 points.)

Second, to convert these expectations to raw numbers, we need an estimate of turnout. In most of the other memos, I used a couple of ad hoc methods.  Since then, I have come across the state-level turnout estimates that are produced as a byproduct of the FiveThirtyEight presidential election forecasting model, and so I’ll use those instead.  For Pennsylvania, the low and high estimates are 6.0 million and 7.7 million, respectively, which is what I’ll use here.  However, turnout in 2016 was 6.2 million, and thus I’m certain that the low estimate is too low.

Third, here is what the combination of numbers above imply for the final distribution of votes in Pennsylvania, by mode:


Vote mode, combining four waves of survey

Assumed turnout

Election Day

Early

Mail

6.0 million

3.390M

156k

2.454M

7.7 million

4.351M

200k

3.149M

Fourth, a final calculation needs to be made, if we want to estimate the number of mail ballots that will be requested, since not all mail ballots are returned.  For the states that make their absentee ballot files available, it appears that in 2016, around 85% of requested mail ballots were returned.  If that return rate holds for Pennsylvania, then it should expect between 2.9 million and 3.7 million requested ballots.

There is one data issue that needs to be brought up here.  Pennsylvania does not have a full-bore early voting program.  Rather, it allows in-person mail voting, which some cities, notably Philadelphia, have promoted.  The Pennsylvania voter file does not have a separate code for in-person absentee ballots, and the conventional way to figure out who was voting in person yielded an implausible number of early in-person voters.  (The standard way is to select records in which the request for the ballot, its issuance, and return all share the same date.)  Therefore, I am assuming that the absentee ballot file does not record in-person absentee voters, although I could be wrong about that.

As of yesterday, 3,058,367 ballots had been requested and 1,850,393 returned a mail ballot.  Today was the deadline for requesting mail ballots, which means that the number of mail ballots requested will likely hit the low end of the estimates, at around 3.1 million.  For the past week, Pennsylvania has been averaging 95,000 returned ballots each day.  Leaving aside the ballots that will arrive after Election Day, if the state keeps receiving ballots at last week’s page, it will eventually have 2.5 million mail ballots, which is also on the low side of the estimates.

The following graph summarizes the important calculations.

As for Election Day, this is where the turnout estimate really matters.  If we think that 2.5 million mail ballots (and a small number of early votes) will come in before Election Day, then if turnout is at the low end of 6.0 million, that leaves 3.5 million to vote on Election Day.  If turnout is at the upper range of 7.7 million, then Election Day turnout would have to be 5.2 million.  This is a considerable range.  My own hunch is that turnout will hit the upper range, so Pennsylvania’s election officials would be well served by planning for this larger number. Whether this is necessary, or an over-reaction, will only be known on Election Day.

Resilient Elections

I’m excited to announce that I’ve started a video series with Paul Gronke, who runs the Early Voting Information Center (EVIC) up at Reed College. We just posted our first video, in which Paul and I give a brief introduction to the series. Please watch our intro, subscribe to our YouTube channel, and let us know your comments and questions.

As we discuss in the introductory video, we are going to focus on topics that we know are going to be important to researchers and election officials as we get closer to the November 2020 presidential elections in the U.S. Paul and I will are working on a number of different videos — some will be the two of us discussing important election science and administration topics. Some will be conversations with other academics who are working on important research questions like voting by mail, election forensics, election integrity, and voter confidence. And finally, we are going to have conversations with election officials, in particular those on the West Coast, who have extensive experience with early and remote voting.

If you are interested in suggesting certain topics, let us know in the YouTube channel comments.

Guest Blog by Andrew Sinclair: California’s Top-Two Primary

California’s Top-Two Primary, by Andrew Sinclair

After 2020’s “Super Tuesday,” many of the news headlines in California (and the rest of the nation) will focus on the outcome of the Democratic Party’s presidential nomination contests. Yet, there are other elections taking place in California at the same time, continuing California’s experiment with the “top-two primary.”

There are actually three types of elections taking place in California. The presidential contest is a traditional partisan primary. Unaffiliated (“no party preference”) voters can participate in the Democratic Party primary if they request a Democratic ballot. Still, the election is partisan in nature: it helps determine which candidate will be the party’s nominee for the November general election. The other two kinds of elections are both variants of nonpartisan elections.

California uses the nonpartisan top-two election procedure for “voter-nominated offices.” This year, these are the State Assembly, State Senate, and U.S. House elections (there are no statewide office or U.S. Senate elections this year). For these elections, every voter can choose between all of the candidates. The two candidates with the most votes advance to the general election in November, even if they come from the same party. Candidates for these offices list their party preference on the ballot. For a short explainer on how this works, Christian Grose (USC) has a great 4-minute description in an interview with NPR: here.

California also holds elections for “nonpartisan offices.” This can be a bit confusing, since the top-two for the voter-nominated offices also is a kind of nonpartisan election – but for these elections (county supervisor, etc.), the candidates also do not list their own party preference on the ballot and, if one candidate gets more than 50% in the primary, that person is simply elected. Otherwise, these are pretty similar to the voter-nominated top-two elections.

California adopted the nonpartisan top-two procedure for voter-nominated offices by passing Proposition 14 in 2010. Michael Alvarez and I wrote a book – Nonpartisan Primary Election Reform: Mitigating Mischief (Cambridge University Press, 2015) – about the first use of the top-two in California in 2012. I have been following along since then as we have learned more in each cycle about how this rule operates.

The top-two procedure is different than what we see in most states, both in the primary and general election (Ian O’Grady and I make this argument in the Routledge Handbook of Primary Elections – which is a nice resource; the other chapters are great). For political scientists, the institutional variation the top-two represents provides an interesting window into primary elections, voter behavior more generally, and the operation of political parties. This post highlights a few things to look for in the 2020 cycle here in California.

Why 2020 is unique.

This will be the fifth cycle with the rules in California, although each election year has taken place in a unique context in terms of top-of-the-ticket races and the state of national politics. The 2020 election will be the first of this era to take place in March, with the Democratic Party’s nomination far from over. With all of the previous primaries in June, California had a more limited role in the 2012 and 2016 presidential primaries. It is also the first of the top-two elections to have no statewide elections (either statewide offices as in 2014 and 2018 or a U.S. Senate election as in 2012, 2016, and 2018).

It may be the case that Republicans, without a meaningful presidential contest or statewide election, will turn out at much lower rates than Democrats. Registered Republican voters make up only 24% of the state’s electorate (as of the Feb. 18 report from the Sec. of State). Since all candidates – Republicans and Democrats alike – are in the same primary for the voter-nominated offices, low turnout for one party can potentially make it hard for that party’s candidates to make it to the November ballot.

What to look for.

How many same-party general elections will there be? In past election cycles, it has still been the case that most primaries sent one Republican and one Democrat to the general election. If the Republican vote does collapse, it is possible that we may see more Democrat-on-Democrat general elections.

Where are the same-party elections? Following up on an observation in the Alvarez-Sinclair book, I (and coauthors Ian O’Grady, Brock McIntosh, and Carrie Nordlund) examined over a couple of cycles where these same-party elections tended to take place. The punchline: the more politically lopsided the district, the more likely it is to see two candidates of the same party advance to the general election. These can make the election a lot more competitive than they likely would be otherwise, too. Does that finding continue to hold?

How well do party-endorsed candidates do? One of the prevailing theories of primary elections is that parties generally do a pretty good job of organizing to back their preferred candidates (for a neat recent book on this, see Hans Hassell’s The Party’s Primary, among others).

What happens to races with crowded fields? In not every contest do the parties manage to keep the number of candidates of their own party down. While somewhat odd results do not happen very often, they can: nearly everyone cites the 2012 Miller-Dutton CD 31 race when they want an example in part because it illustrates a potential issue and in part because there are not many other examples. The idea is that the vote can split across candidates in such a way that the majority party could, if the cards fall exactly right, end up shut out of the general election.

How do moderate candidates do? This was, of course, one of the original claims about the top-two primary (for a nice summary from Eric McGhee at PPIC: here). As Nolan McCarty wrote in his recent book on polarization, results of studies on the impact of the primary reform on polarization are “decidedly mixed.” This is part of the fun of political science – as multiple scholars use different approaches to work towards an understanding of a problem. See work from Christian Grose (here) and Eric McGhee and Boris Shor (here).

Do any incumbents look to face stiff challenges in November? Beyond the question of ideological moderation, it may also be the case that voters can use the top-two to eject candidates from office who have performed poorly (potentially democratically meaningful, even if the replacement is ideologically similar).

What happens with third party/independent candidates? These candidacies have not generally been very successful under the top-two at reaching the general election (although, under the old partisan system, they were also not very successful at winning offices).

Are voters happy with their choices? In the surveys for our book, Michael Alvarez and I found that voters were fairly uncertain about what they expected from the top-two. As they experience it: do they learn about it, and get used to it? Or discover that they don’t like it?

Particular Races to Watch.

Congressional District 8. This used to be Paul Cook’s (R) district; in announcing his retirement, he set off one of the more interesting contests in this cycle. Republican Assemblyman Jay Obernolte won the Republican Party endorsement but there are five Republicans on the ballot in total, including a former candidate for Governor, Tim Donnelly. Yet there are also three Democrats and one NPP candidate on the ballot.

Congressional District 25. This is the Katie Hill seat – and it drew six Democrats, six Republicans, and one NPP candidate. The state Republican Party did not endorse a candidate and there are several potential contenders. The Democratic Party has not issued an endorsement in this race either. To further compound the story, there is a simultaneous special election to fill the remainder of the term.

There are others that will be pretty interesting, but those two are certainly worth checking in on as the returns come in. Of course, it may be quite some time before we really know what the results are for some tightly contested races.

What’s hard to see this week.

The top-two election procedure impacts both the primary and the general election. Some of the research on the top-two points towards finding the most interesting results in the general election. In the surveys Michael Alvarez and I conducted in 2012, we found that mostly voters tried to choose ideologically proximate candidates in the primary. (See also a nice study: Ahler, Citrin, and Lenz: here). But what happens once two candidates of the same party advance to the general election?

There is interesting work now (see Badas and Stauffer 2019) on gender and nonpartisan elections as well as race and ethnicity in same-party general elections under the top-two (see Sadhwani and Mendez 2018). If party is not a cue, voters have to decide somehow; Betsy Sinclair and Michael Wray (2105) found that same-party elections corresponded with increased Google searching just before the election.

One of the more commonly mentioned consequences of same-party elections in November, also, is the possibility that “orphaned” voters will not participate (see Nagler 2015, Masket, via Vox, 2016, Fisk 2019 – Fisk with the on-point title of “No Republican, No Vote”). Yet, many still do participate, and we will have to see over the next several months how candidates in these same-party races try to appeal to these voters. It is possible to get something like what reformers intended (something like the 2012 AD5 race) if a centrist candidate holds on to a sizable enough – if short of a majority – of the voters of their own party, and pulls in just enough of the orphaned voters as well. That’s a delicate balancing act, though, because going too far towards recruiting support from the other party can cost a candidate support within their own.

In the larger picture, I would also say that it can take a long time to assess how political institutions function. Politics is a complicated business, and many of the institutions interact. Some of the scholars referenced here have noted that California passed the top-two procedure and the citizen redistricting process around the same time, making it hard to sort out the impact of each. I also wrote, in a paper on the adoption of the simple majority requirement to pass the state budget (Proposition 25, also in 2010), that it directly impacted one of the main motivations for passing the top-two (to get more moderate legislators, to be able to pass a budget). The election rules also operate within a political context defined by the party and ideological divisions present at the time (I am particularly fond of Hans Noel’s book on the difference between these: link). With different ideological and social cleavages, the rules may also have different consequences.

About the author: Andrew Sinclair is an Assistant Professor of Government at Claremont McKenna College. He has studied and written about California’s top-two primary process, as well as the primary election procedures in other states.

California’s Super, Super Tuesday: What to Expect

On March 3, California will be one of fourteen states holding primary elections (American Samoa will have caucuses that day). California’s 454 delegates to the Democratic National Convention will be at stake on March 3, meaning that California is a very large prize for candidates still seeking the Democratic presidential nomination.

But there’s a very good chance that we will not know the winner of California’s Democratic presidential nomination primary the evening of March 3. In fact, we may not know how California’s delegates will be allocated until much later in March. This will be especially true if there’s no clear front-runner in the Democratic presidential nomination contest by March 3.

So why are we anticipating that we may not know the winner of the Democratic presidential primary in California after polls close on March 3?

California is in the midst of sweeping changes in election administration procedures and voting technologies. While some of these changes started in 2018 in some counties, they are now hitting the larger counties in the state, in particular Orange and Los Angeles Counties. Election officials throughout the state have been working in recent years to make the process of registration, getting a ballot, and returning that marked ballot, much easier and more convenient. And it’s these changes that are likely to introduce significant delays in the tabulation of ballots after the polls close on March 3, and which could well delay the determination of a winner in California’s Democratic primary for days or weeks, if the contest is close statewide.

California election officials have sent out an unprecedented number of ballots by mail. For example, in Orange County the Registrar of Voters has mailed just over 1.6 million absentee ballots to registered voters. Many of those ballots (269,690 as of February 27 in Orange County) have been returned — but the vast majority of them are still in the hands of voters. We estimate that many voters will be dropping their voted absentee ballots in the mail in coming days, or they will drop them off in voting centers between now and Election Day. And if a vote-by-mail ballot is received and validated on or before Election Day, but is received by the election official no later than 3 days after March 3, it will be included in the tabulation. This means that there are likely to be a large number of these by-mail ballots that will be received on Election Day, and in the 3 days following Election Day, that will all need to be processed, validated, and included in the tabulation (mostly after March 3).

Californians who for some reason haven’t registered yet to vote, but who want to register now and participate in the March primary, can do so using what is called “Conditional Voter Registration” (CVR), in which they can register and vote at many locations in their county (usually the county election headquarters, a vote center, or a polling place). It’s unknown how many potentially eligible Californians may take advantage of the the CVR opportunity, but it’s possible that we might see large numbers of conditional registration voters between now and March 3, and of course many of these voters will not have their materials processed, and if they are eligible to vote, to have their ballots included in the tabulation, until after the primary on March 3. If there is a swell of interest in the primary election among currently unregistered but eligible voters, this could significantly slow down the reporting for final results after March 3.

Finally, there is also a good chance that there will be strong turnout on March 3, potentially resulting in crowded voting locations statewide, and producing a very large number of ballots, CVRs applications and provisional ballots, and by-mail ballots dropped off on Election Day. If turnout is strong in in the March primary, the large amount of election material that will need to be reconciled and examined after Election Day could also slow the tabulation process, and could introduce significant delays in the reporting of results.

Now that’s just on the administrative side. It also turns out that the rules governing the allocation of California’s 494 Democratic National Convention (DNC) delegates are exceptionally complex, so complex that they will require another blog post. The important issues are that most of the state’s DNC delegates are allocated proportionally to the statewide primary winners, and to the primary winners of the primary in each of the state’s Congressional Districts — but only those candidate receiving more than 15% of the votes cast in either case get delegates. So in order to know the delegate count from California’s Super Tuesday primary, we’ll need accurate counts of the votes cast in each Congressional District, and that could take days or even weeks.

There’s a good chance that we may not know the final delegate count until for a few weeks after the primary. So patience — the process will take time, and let’s give our election officials the opportunity to do their jobs and to produce an accurate tabulation of the results of California’s Super Tuesday March primary.

Twitter Monitoring for the 2020 Super Tuesday Primaries

We’ve launched our Twitter election monitors for the 2020 Super Tuesday primaries, the visualizations are now being posted at Monitoring the Election, or you can see them on GitHub. These data are being collected using a similar process to the one we tested and deployed in 2018. And if you are interested in seeing the code from 2018, here’s a link for that GitHub repo.

The major improvement since 2018 is that we’ve rebuild the code base, and this now runs in the cloud. That should make our collection stream more reliable, and will allow us to scale the collection process to cover additional keywords and hashtags when necessary. These improvements are the subject of a technical paper that is now under development, and we hope to release soon.

We also continue to work on the geo-classifaction of the data we are collecting, and have a few improvements in our process that we’ll roll out soon. These improvements should allow us to monitor social media discussion about the Super Tuesday primaries in Southern California.

The team working on this project includes Nicholas Adams-Cohen (now a post-doc at Stanford University) and Jian Cao (a post-doc here at Caltech).

The Iowa Caucus: A Frustrating Start to Election 2020

Like most observers of elections, I got my bowl of popcorn and turned on the TV last night, expecting to learn more about who “won” the Democratic caucuses in Iowa. I enjoyed the popcorn, but got a bit bored watching the pundits speculating endlessly about why they didn’t have immediate results from the caucuses last night.

While like everyone else, I’d like to learn more about who “won” the Democratic caucuses in Iowa, I’d also like to make sure that when the officials there announce the results, they provide the most accurate results they can — and they provide a detailed explanation for why there has been such a delay in reporting the results.

As my colleagues on the Caltech/MIT Voting Technology Project and I have said for nearly two decades now, democracy can be a messy business. Elections (including primaries and caucuses) are complex to administer, they inevitably involve new and old technology, and with hundreds of thousands of people participating they take time to get right. I suggest that we all take a deep breath, let the Iowa Democratic Party figure it all out, and be patient. It’s much better for American democracy, and for the confidence of voters and stakeholders, if we get accurate results and an explanation for the delay, rather than hurried and incorrect results.

And for the rest of this election cycle, I suggest continued patience. As we move further into the primary season, and then into the fall general election, issues like what we are now witnessing in Iowa will continue to arise. It’s likely that on Super Tuesday we might not know who “won” California immediately after the polls close that evening, for example. But we should let election officials have the time and space to get the results right, and to be transparent and open with the public about why delays or issues arise in the administration and tabulation of elections.