Charles Stewart III
The Healthy Elections Project has been running a series of surveys in a half dozen battleground states, asking how voters intend to cast their ballots. I have previously published thoughts on Arizona, Florida, North Carolina, Pennsylvania, and Wisconsin, with a bonus posting about Georgia (where we are not surveying, ourselves.) This brief note focuses on Michigan.
First, about the intentions themselves. The table below shows that there was very little movement in reported intentions across the four waves of the surveys. An ANOVA test fails to reject the null hypothesis that the four waves are drawn from independent samples, so I proceed using results from the pooled survey, discarding the “don’t knows.”
| Vote mode intention among likely voters, including don’t knows | |||||
| Date |
Election Day |
Early | Don’t know |
N |
|
| Sept. 4 – Sept. 11 |
44.0% |
7.2% | 45.1% | 3.8% |
484 |
| Sept. 16 – Sept. 25 |
40.5% |
4.3% | 49.4% | 5.9% |
490 |
| Sept. 30 – Oct. 9 |
37.2% |
4.7% | 55.6% | 2.5% |
484 |
| Oct. 14 – Oct. 21 |
39.8% |
10.5% | 48.6% | 1.0% |
491 |
| Total |
40.4% |
6.7% | 49.7% | 3.3% |
1,949 |
| Vote mode intention among likely voters, excluding don’t knows | ||||
| Date |
Election Day |
Early |
N |
|
| Sept. 4 – Sept. 11 |
45.7% |
7.5% | 46.8% |
465 |
| Sept. 16 – Sept. 25 |
43.0% |
4.5% | 52.5% |
462 |
| Sept. 30 – Oct. 9 |
38.2% |
4.8% | 57.0% |
472 |
| Oct. 14 – Oct. 21 |
40.2% |
10.7% | 49.1% |
486 |
| Total |
41.8% |
6.9% |
51.4% |
1,885 |
(By the way, the overall 95% confidence interval for all four waves combined is around +/- 2.2 points. For any one wave, it’s around 4.4 points.)
Second, to convert these expectations to raw numbers, we need an estimate of turnout. In most of the other memos, I used a couple of ad hoc methods. Since then, I have come across the state-level turnout estimates that are produced as a byproduct of the FiveThirtyEight presidential election forecasting model, and so I’ll use those instead. For Michigan, the low and high estimates are 4.8 million and 6.2 million, respectively, which is what I’ll use here. However, turnout in 2016 was 4.9 million, and thus I’m certain that the low estimate is too low.
Third, here is what the combination of numbers above imply for the final distribution of votes in Michigan, by mode:
| Vote mode, combining four waves of survey | |||
| Assumed turnout |
Election Day |
Early |
|
| 4.8 million |
2.712M |
125k |
1.963M |
| 6.2 million |
3.503M |
161k |
2.536M |
Fourth, a final calculation needs to be made, if we want to estimate the number of mail ballots that will be requested, since not all mail ballots are returned. For the states that make their absentee ballot files available, it appears that in 2016, around 85% of requested mail ballots were returned. If that return rate holds for Michigan, then it should expect between 2.3 million and 3.0 million requests.
There is one data issue that needs to be brought up here. Michigan does not have a full-bore early voting program. Rather, it allows in-person absentee voting, but it does not keep track of this separately. For that reason, and because so few survey respondents indicated they planned to vote in-person before Election Day, I will proceed by considering only mail balloting.
The other data issue is that Michigan, unlike most of the other battleground states, does not provide an easily accessible absentee file to the public, nor even a daily report about these statistics. For that reason, I’m relying here on Michael McDonald’s irreplaceable reports on his U.S. Elections Project website for these statistics.
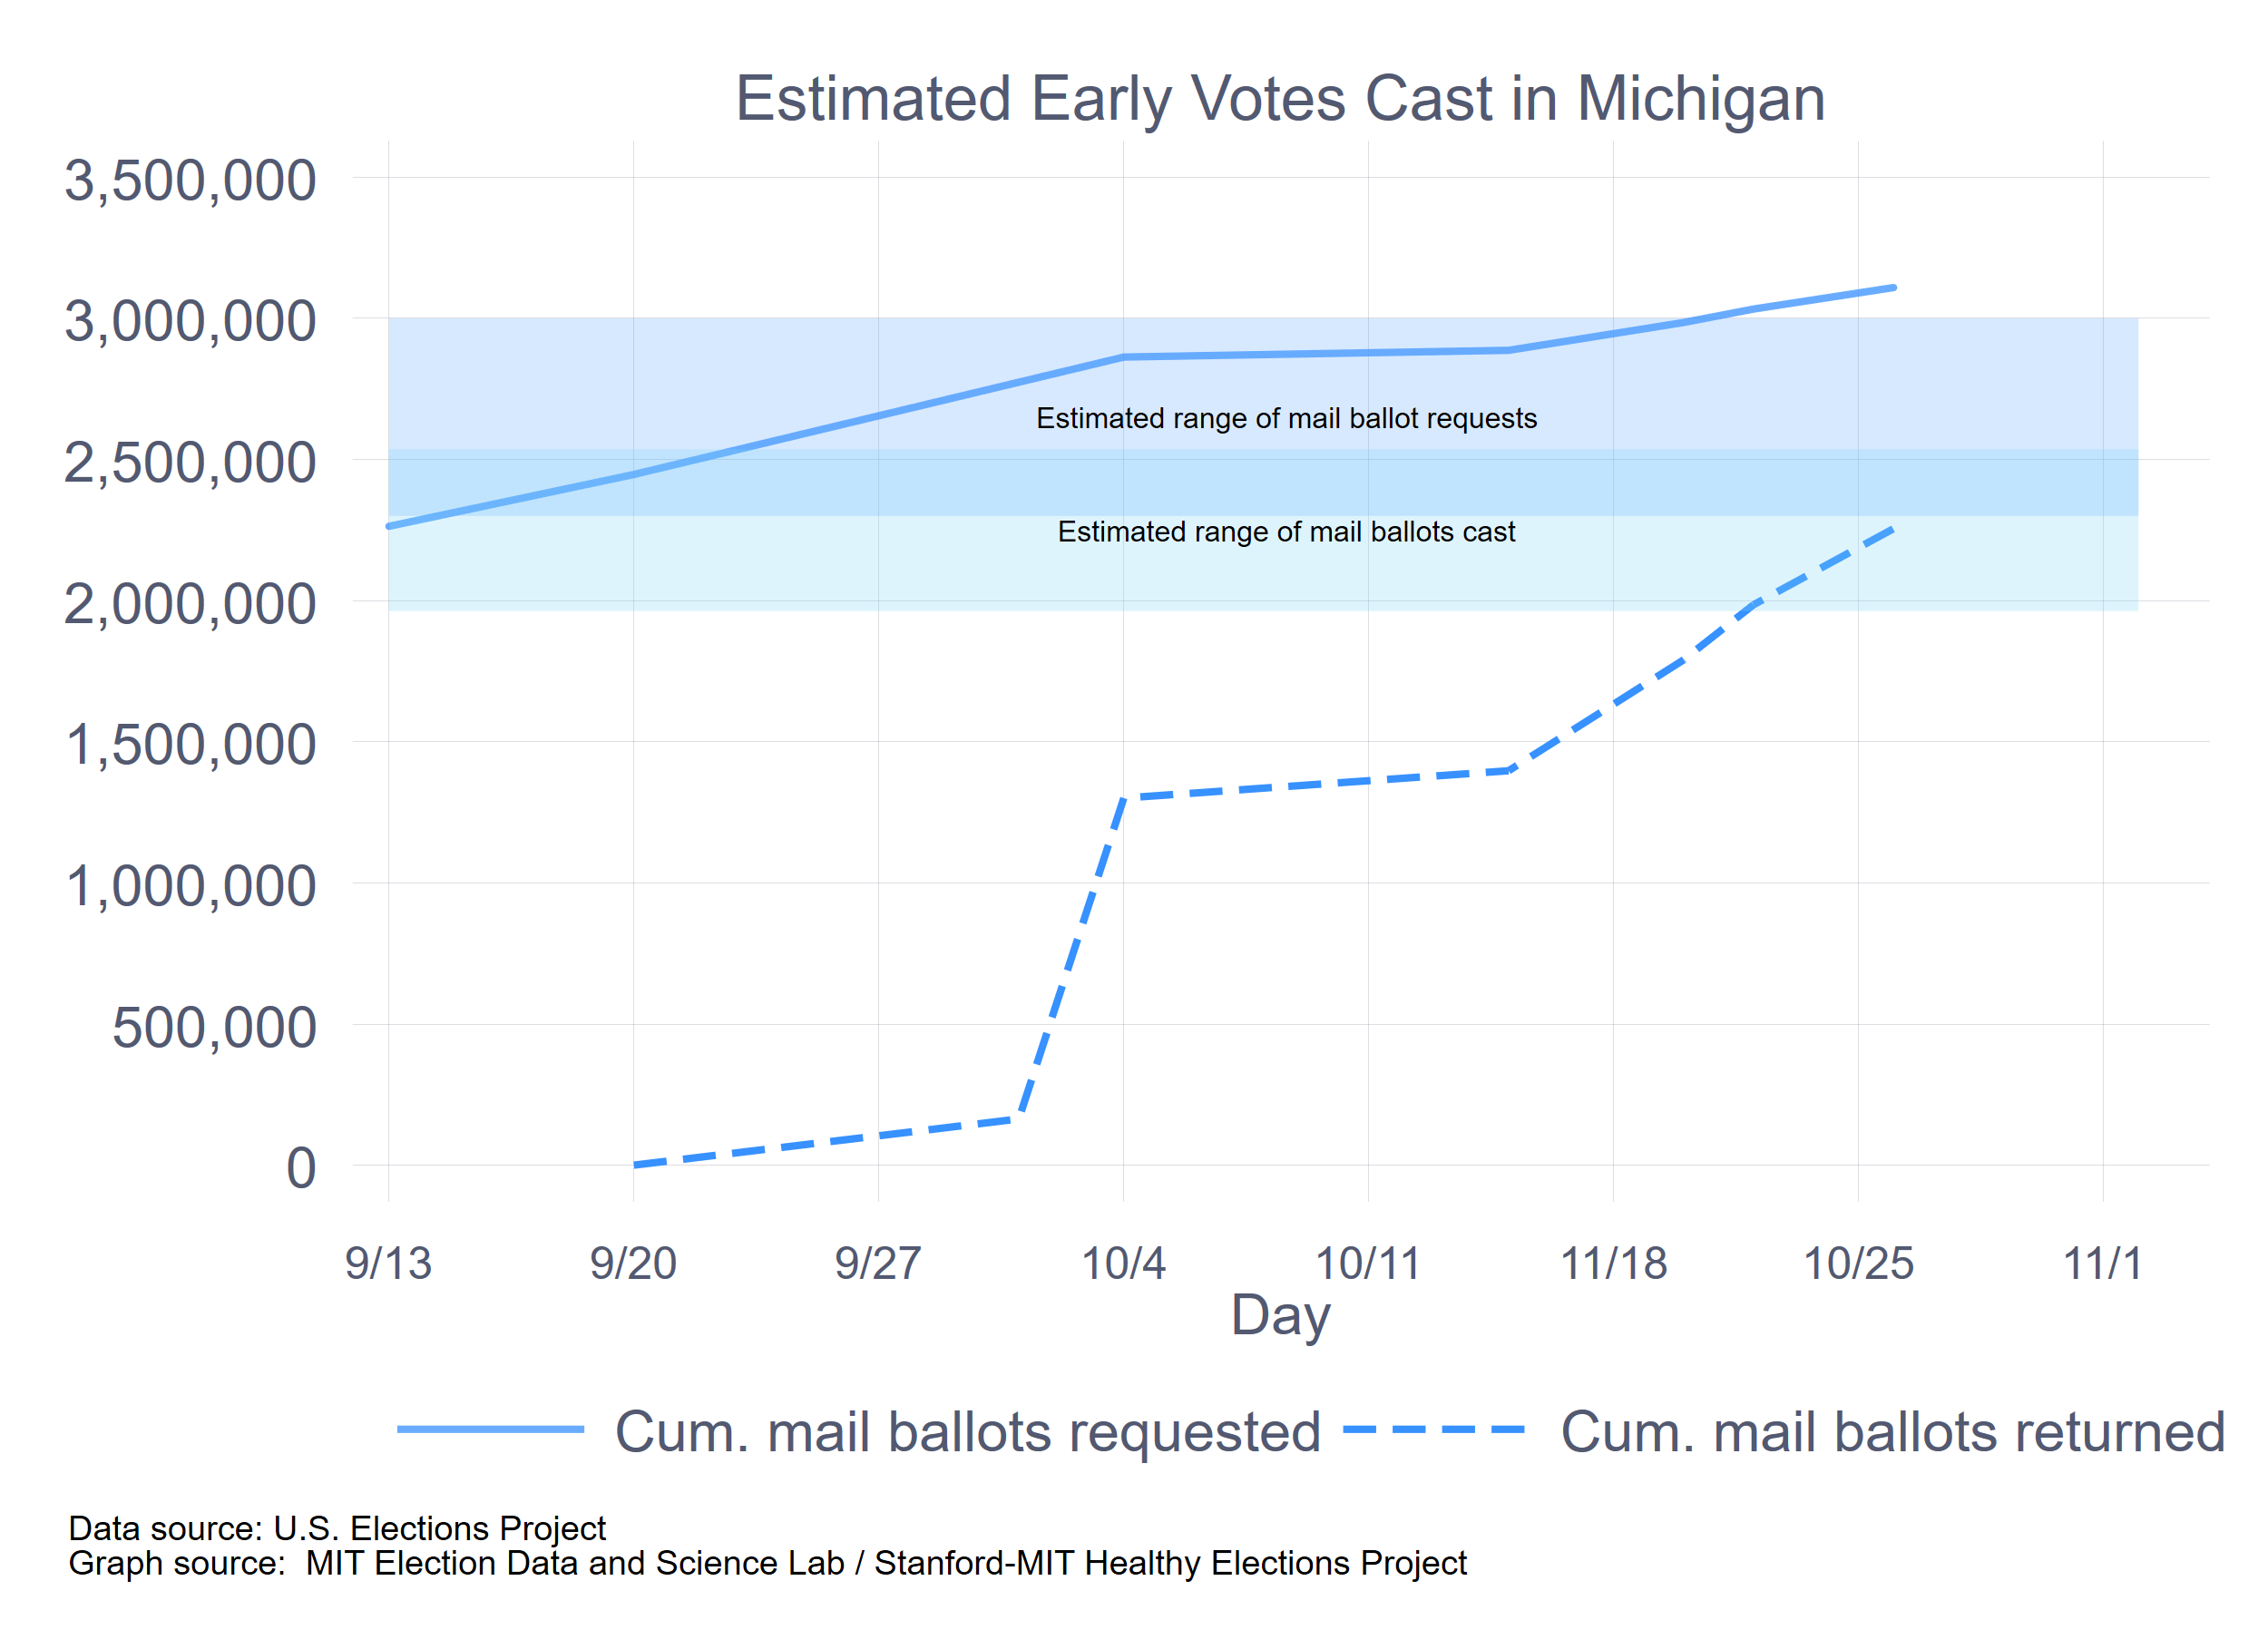
As of yesterday, the U.S. Elections Project reports that 3,109,105 ballots had been requested and 2,255,280 mail ballots had been returned. The deadline for requesting mail ballots is this Friday, although the state (really, the world) has been encouraging voters to request their mail ballots as soon as possible. Therefore, it seems highly unlikely that anything more than 3.2 million ballots will be requested.
On the returns side, the past week has seen about 66,000 ballots returned per day. This should pick up in the final days leading up to Election Day. Nonetheless, at this pace, and with the deadline for receipt on Election Day. That would yield another 462,000 ballots, or 2.7 million, total.
The following graph summarizes the important calculations.
As for Election Day, this is where the turnout estimate really matters. If we believe the low-end turnout projections of 4.8 million and that 2.7 million mail ballots returned, that leaves 2.1 million to vote on Election Day. If the high-end projection of 6.2 is correct, then Michigan would be at 3.5 million on Election Day. If I had to choose, I’d go with the higher estimate.