Author Archives: cstewart

Five Wisconsin Take-Aways

By Charles Stewart III, MIT

The following is a list of take-aways from the Wisconsin primary. I will be elaborating on these points in the following days, but I wanted to get these down before the day got too far out of hand.

  1. It is possible to rapidly expand vote-by-mail even when you’re not prepared for it, but don’t try this at home. The state was in about as bad a bind as one could imagine—a shifting, uncertain health crisis, conflicting court decisions, a deadlocked state election commission, a history of little vote-by-mail, and the most decentralized election administration system in the nation. And yet, 1.1 million mail ballots were received in time to be counted—a record for any election in the history of Wisconsin.
  2. In-person voting is still necessary. The collapse of in-person voting in Green Bay (Brown County) and Milwaukee City (Milwaukee County)—and perhaps in other municipalities, as well—had a measurable effect on turnout. A simple statistical model suggests that Milwaukee County came in 19,000 votes below expected, Green Bay at 10,000 votes below expectations.
  3. The first act of the primary is an amazingly good start, but it doesn’t mean we are out of the woods yet. We do not know yet how many absentee ballots were rejected because they arrived too late, or because of other infirmities.
  4. A surprisingly good primary does not guarantee a surprisingly good general election. The electorate in a general election is different from the primary election. It’s less experienced and has more difficulties at the polls. It will be less capable of jumping through the hoops to get ballots, and it will be more reliant on election-day registration to be able to vote in the first place. The primary is a good start, but it’s just a start.
  5. Wisconsin’s electoral landscape is shifting. First, even with the difficulties, turnout was well above what a statistical model would have predicted, given the lack of a challenger in one party and the un-competitiveness in the other. Second, the shift in votes that gave rise to the liberal’s victory in the supreme court race—a proxy for partisan politics more broadly—show a pull-back in support for conservative politicians in suburban Milwaukee counties, in counties of the Twin-City exurbs, and in the small “Obama-Trump” counties throughout the state.

What “Should” We Expect Turnout to Be in Wisconsin?

By Charles Stewart III, MIT

While we wait for the election results to be released later tonight, it would be useful to predict a priori what we would expect turnout to end up being. With an expectation established, based on past voting patterns in Wisconsin, it will be easier to assess how the unusual circumstances surrounding the primary may have affected turnout and the vote shares for candidates.

The exercise here is entirely empirical. There are too few data points—18 in all—to build an elaborate model. The main explanatory variable I will explore is the competitiveness of the presidential nomination fight.


A simple two-variable model of turnout

To start, I look at turnout in the presidential preference primary from 1948 to 2016, as a percentage of the voting-age population. Turnout is taken from the Wisconsin Elections Commission website, as is voting-age population, with the exception of 2012 and 2016, which I got from Michael McDonald’s United States Elections Project website.

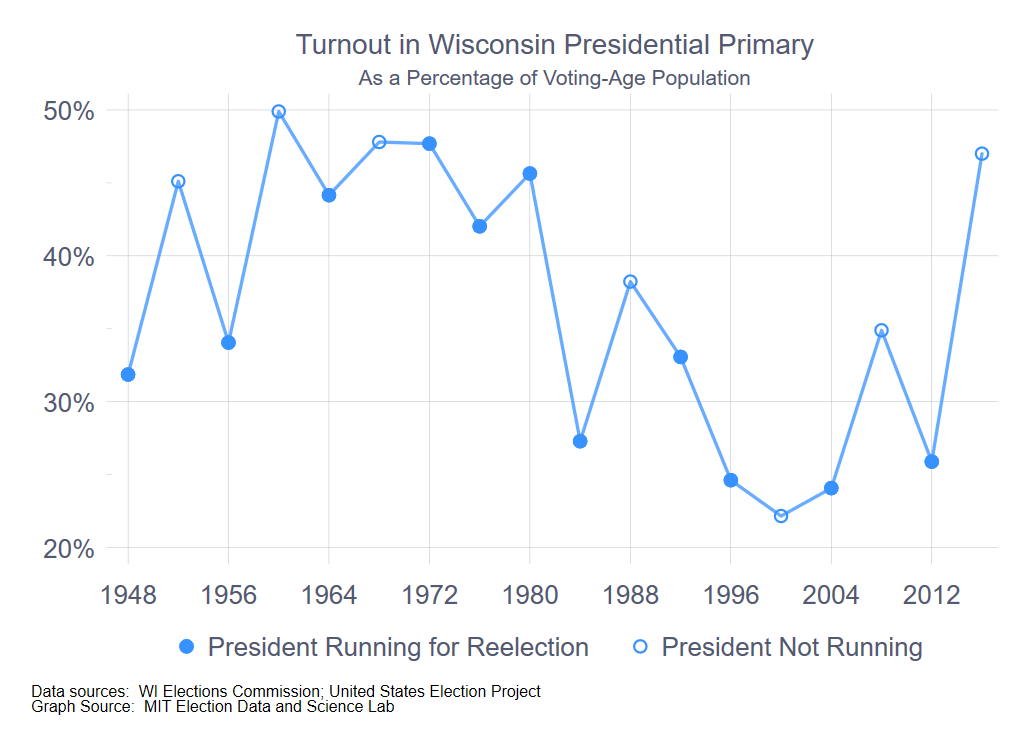
There are two notable patterns in the accompanying figure. (Click on any of the figures in this post to enbiggen.)  First, there is a steep drop in turnout between the 1980 and 1984 primary.  I’m not certain what caused this—it’s not due to the passage of the 26th Amendment to the U.S. Constitution, which gave 18-year-olds the right to vote, because that took effect with the 1972 election.

It has been suggested to me (thanks, Barry Burden) that prior to 1980, Wisconsin was typically early in the primary season, compared to other states, and thus a much more significant event in the hunt for the nomination. In any event, it is clear that 1984 and onward constituted a different turnout regime than the pre-1984 period. Whether the years prior to 1960 properly belongs to an even different period is an interesting question, but isn’t obviously relevant to the exercise of creating an expectation for turnout in 2020.

The exception to this simple periodization is 2016, where the turnout level of 47% was nearly twenty points higher than the average of the 1984 – 2012 period (29%). I will return to this point below.

The second pattern in the time series is the increase in turnout in years when the incumbent was not running for president, in other words, was precluded by the constitution from running for a third term. (Open-seat years are indicated with the open circles in the graph.) With the exception of 2000, the existence of a presidential open seat is associated with an increase in turnout in the primary, compared to the prior presidential election year. (And, one could possible even argue that Al Gore’s candidacy as Bill Clinton’s heir in 2000 meant that Gore was considered to be the de facto incumbent in the Democratic primary that year.)

The mechanism here is clear. With an incumbent president running for reelection, the in-party’s primary battle is typically subdued compared to the out-party’s. Absent another reason to come to the polls, the in-party’s partisans are likely to stay away to come degree. Conversely, in years where the incumbent cannot run for reelection, both parties tend to have hard-fought contests, drawing voters from both parties to the polls.

For starters, then, this suggests a simple regression model, where the dependent variable is turnout as a percentage of VAP and the independent variables are two dummy variables indicating (1) whether the year is 1984 or after and (2) whether the incumbent president is term-limited from running again. The results are in the accompanying table.

This allows for a simple prediction for 2020. With Trump not term-limited out, we would expect turnout in 2020 to be 40.6 – 13.2 = 27.4 percent of voting-age population. With VAP at 4,573,223, this works out to 1,253,063.

Adding competition

There is something unsatisfactory with models that rely solely on dummy variables, especially dummy variables demarking time periods, because they essentially say that nothing changes during the period in question, beyond random noise. Further examination of the graph above suggests there may be another dynamic at work, beyond whether the president is term-limited out, and that is the actual competitiveness of the races at hand.

For instance, in the post-war period, there were three elections in which both parties had hot nomination contests when the primary rolled around to Wisconsin—1980, which featured Kennedy and Carter duking it out on the Democratic side and Reagan and Bush locked in a tight race on the Republican side; 2008, with Clinton v. Obama and McCain v. Hckabee; and 2016, with Clinton v. Sanders and Cruz v. Trump and Kasich.

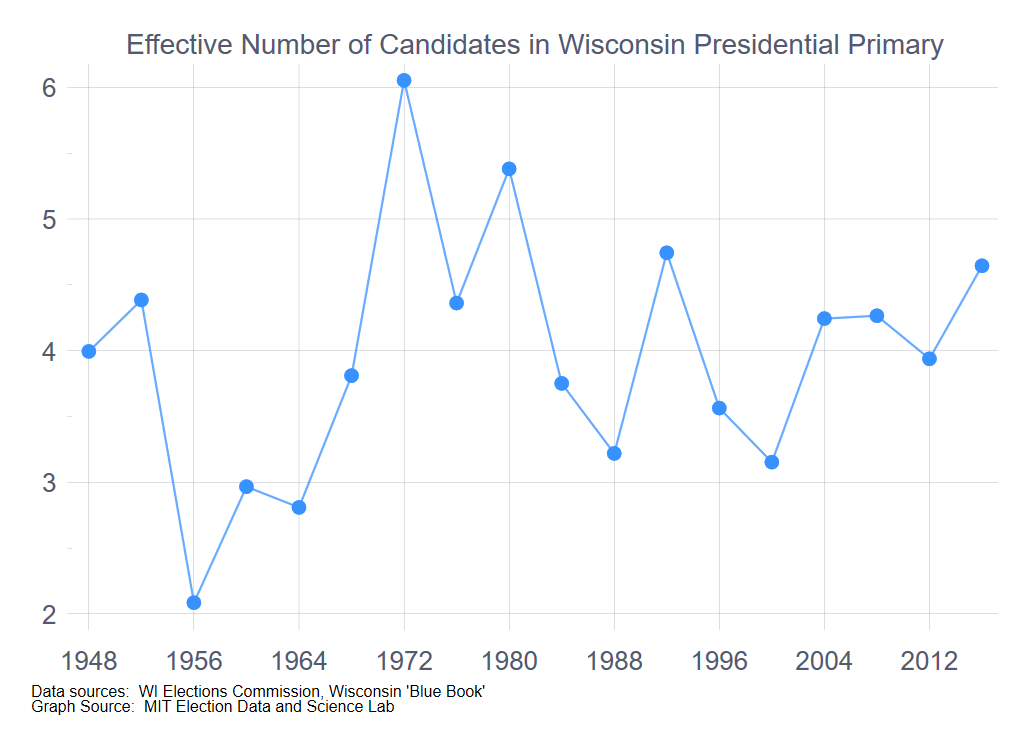
We can extend the previous regression model by adding the “effective number of candidates” measure to the mix. (See the end of this post to see a discussion of the effective number of candidates measure.  In this case, I add the effective number of candidates in the two parties to create a unified variable. I do this to preserve degrees of freedom.)

Doing so reveals the results in the accompanying table.

With the 2020 Republican primary uncontested and the Democratic primary down to two candidates, one of whom was already the presumptive nominee by primary day, the effective number of candidates for the 2020 primary was already among the lowest in the time series. In the best of cases, if Biden and Sanders tie, the effective number of candidates across the two parties would be precisely three—one for the Republicans plus two for the Democrats. As the following graph shows, the 2020 primary will likely be the least competitive Wisconsin presidential primary, considering the two parties together, since 1964.


To make a prediction from the regression model model, we have to estimate the results of the Democratic primary, while simplifying things by setting the effective number of Republican candidates to 1, ignoring scattering votes on the Republican side. The following table shows the range of estimates, varying the percentage of the vote for Biden from 30% to 70%, ignoring the vote for the other candidates.


The high-end estimate, with a Biden-Sanders tie, is 23.9% of VAP, four points below what we predict without taking the non-competitive nature of the primary into account.

What about the 2016 outlier?

The one thing that makes me uneasy about these predictions is the 2016 primary turnout of 47%, the highest since 1980. Several commentators have suggested that 2016 had an especially high turnout because of the fiercely fought race for Wisconsin Supreme Court, between the liberal JoAnne Kloppenburg and the conservative Rebecca Bradley. (Wisconsin’s supreme court elections are non-partisan.) With the recent escalation of partisan rancor in the state, much of which has focused on Supreme Court decisions, the explanation for the turnout surge in 2016 could rest on the Supreme Court race, not the presidential primary.

The fact that 2016 is truly an outlier is reinforced when we generate predicted values from the two regressions conducted above. The accompanying graph shows the actual time series, along with the two sets of predicted values from the regressions above. The 2016 values are 12 points greater than either regression would have predicted. This is similar in magnitude to the other outlier, 2000, where turnout was 13 points below what the model predicted.

On the issue of state supreme court races providing a turbo-boost to turnout in Wisconsin in general: if it did in 2016, it was the first time ever, at least in the post-war era. When I add variables intended to gauge the presence of contested supreme court races to the regression models above, nothing comes close to statistical significance. For instance, not all years have a supreme court race on the ballot. Adding a variable to account for supreme court races on the ballot along with the presidential primary adds nothing to the explanatory power of the two regression models, nor does adding a variable measuring how closely contested the supreme court race was.

The question, then, is whether 2016 was a true outlier, as was 2000, or whether 2016 ushered in a new partisan era. If it did, then we would expect turnout in 2020 to be about 15 points above what was predicted in the two regressions above. That is, we would expect turnout to be in the range of 1.8 and 1.9 million voters, depending on which regression model above is preferred. My political scientist training makes me skeptical about declaring new eras based on a single election, and so I would not expect turnout in 2020 to be nearly this high. Of course, with the confusion surrounding the primary, we may not know what the “new normal” is until 2024.

A conclusion (of sorts)

As of this writing, 1.1 million absentee ballots have been returned for counting. This guarantees that turnout based on absentee ballots alone with be in the ballpark of the predictions from the two regression models reviewed here. We still don’t know what total turnout is, because municipal clerks have hewed closely to the U.S. District Court order not to release any election results until Monday evening.

The Milwaukee City clerk has reported that about 20,000 voters cast ballots in person, anticipating that around 80,000 absentee ballots would eventually be returned. If these percentages hold for the whole state, then we’d anticipate for turnout to be around 1.4 million. Of course, Milwaukee’s in-person voting on Election Day was seriously hampered by the closing of over 90% of its Election Day precincts. I would expect that Wisconsin overall will see something less than 80% of its ballots cast by mail. If so, then turnout will be well above 1.4 million.

Either way, it seems reasonable to expect at this point that turnout will exceed what we should have expected, given the recent history of primaries in the state. Some may say that we should have expected much greater turnout, given the nature of the supreme court race also on the ballot, but one (or two) data points is a thin reed to hang such expectations on.

In any event, the fact that Wisconsin will likely see a much larger turnout for an uncompetitive presidential primary in the midst of a frightening pandemic says a lot about the persistence of the state’s voters and election workers, as it also says a lot about the likely level of turnout in November, when the obstacles to getting to the polls will (one hopes) not be so great.

Epilogue:  The “Effective Number of Candidates” Measure

The “effective number of candidates” measure is analogous to the “effective number of parties” measure used in electoral studies to study the number of political parties in a system.  Essentially, the effective number of candidates measure gauges how many candidates were on the ballot, weighting each candidate by the number of votes each received.  If two candidates receive equal votes, the effective number of candidates is 2.0.  If one candidate receives 90% and the other 10%, the effective number of candidates is 1.2.  For the Democrats, the effective number of candidates was 1.5 when the incumbent Democrat was running for reelection, 1.8 when the seat was open, and 2.9 when a Republican was running for reelection.  For the Republicans, the effective number of candidates was 1.3 when the incumbent Republican was running for reelection, 2.0 when the seat was open, and 2.5 when the Democrat was running for reelection.

Will Expanded Early Voting Help with Social Distancing? Maybe Not

By Charles Stewart III, MIT

The most promising solution to instill physical distancing in elections during the current COVID-19 crisis is increasing the availability of vote-by-mail options. Another suggested strategy has been increased early voting. The idea behind both is to “dedensify” polling places. While moving people to voting by mail will certainly do this, it’s unclear that more early voting will.

Whether early voting is part of the solution depends on whether early voting locations are less densely populated than Election Day polling places. From my initial look at the data, they may not be—although a lot more work needs to be done to know for sure.

For starters, I looked at the wonderful data available from the North Carolina State Board of Elections’ ftp site. From the data there, I could find out how many people voted in 2016 at every early voting site in the state, and the day when they voted. I was able to match that information with other data on the site that reported the hours when these early voting sites were open. From that, I could calculate the average number of early voters in each site on each day.

In addition, I was also able to use the voter history file to calculate the number of people who voted in-person on Election Day at each precinct.

The accompanying figure illustrates the results. (Click on this and the other graphs to enbiggen.)  Throughout the early voting period in 2016, the average number of voters in each polling place was in the 60-to-75 range. This contrasts with Election Day, when the average was 41.

Thus, simply shifting Election Day voters to early voting, at least in North Carolina, is not an obvious strategy. In fact, in a state like North Carolina, the move to early voting would seem to benefit early voters even more than Election Day voters.

I must quickly add some caveats before moving on. First, North Carolina may not be representative. In 2016, 61 percent of voters cast ballots early, through what they call “One-Stop Absentee Voting;” 35 percent of votes were cast on Election Day, with the remaining 4 percent being cast by mail. Thus, the early voting sites may already be congested, which is unlikely to be the case in most states. Still, in 2016, early voting was the dominant mode in seven or eight states, North Carolina included. The analysis here may be the most relevant to these.

Second, this analysis assumes nothing else changes, other than shifting people from Election Day to early voting. For instance, it assumes no more early voting sites are created. Obviously, if more early voting sites were created and voters used them, density in these sites could drop.

In addition, I haven’t compared the actual rooms and buildings that house early voting sites and precincts. This is clearly one example of how particular facts are important. If the alternative is between a cramped church basement on Election Day or a large community center multi-purpose room for early voting, the multi-purpose room can probably handle an equal volume of voters more safely than the basement. The list of early voting sites in North Carolina includes all sorts of locations, most of which seem pretty similar to locations that are used for Election Day voting, as well.

Finally, this analysis hasn’t taken a look at the variability of voter density during particular times of the day. This, of course, is critical, for implementing safe physical distancing practices. We know from the research I have helped the Bipartisan Policy Center conduct and the academic research I have been a part of that there’s a crunch of voters on Election Day when the polls open. Referring back to the North Carolina graph, it wouldn’t surprise me to find out that the average polling place in North Carolina handled 80 voters per hour in the first hour of Election Day voting, before falling to an average of 30-35 the rest of the day.

Less observational research has been done of early voting sites. The survey research I have done suggests that arrival rates at early voting sites are spread more evenly across the day than on Election Day. The accompanying graph, which is taken from the 2016 report on wait times published by the BPC, shows average wait times at various times of the day, taking the nation as a whole. The good news is that there is not a beginning-of-the-day rush with early voting, over all. The bad news is that if there is congestion, it lasts all day long.

I end with one last figure, which shows the average number of voters who went through each early voting site among 23 states in 2016. The data are from the EAC’s Election Administration and Voting Survey. The states displayed are those that reported sufficient data to calculate meaningful statistics. (This means, for instance, that Texas, a state with a lot of early voting is excluded, because a lot of Texas counties did not report how many people voted early.)

As with the North Carolina analysis, this is a rough first cut at getting a sense about where the most congested early voting sites might be. It’s rough, most obviously, because it doesn’t take into account how many days of early voting there are in the states, nor how many hours the individual sites were open. And, of course, it does not consider the variability in early vote center locations.

Also, some of the states with a highest early-voter-to-early-voting-site ratios are those without a lot of early voting, measured by the percentage of voters who use it. This looks to be true, for instance of Hawaii , Maryland, and D.C.

Nonetheless, as a first cut, it shows that the strategy of shifting more people to early voting in Minnesota or Massachusetts may be potentially more promising than doing so in Maryland or Washington, DC.

Analysis like this is no substitute for the detailed analysis that states and localities will be undertaking in the coming weeks, as they consider whether expanding early voting is right for them—and if it is right, how to do it.

It should serve as a cautionary note for the public and policymakers, however, as they clamor for “obvious” solutions to the problem of voting in the age of COVID-19. Nothing is obvious in this business. It’s all about the details. That’s why coming up with solutions that protect the 2020 election while protecting our health will take so much effort.

Thoughts on the Natural Disaster and Emergency Ballot Act (NBEBA) and the ACCESS Act

By Charles Stewart III, MIT

Things are moving fast on Capitol Hill regarding emergency stimulus funding and its relationship to making the 2020 election safe in the midst of the coronavirus emergency.

Here are some thoughts about the two major pieces of legislation that have been proposed on this subject, the Natural Disaster and Emergency Ballot Act of 2020 (DEBA) in the Senate and the ACCESS Act in the House. (The ACCESS Act is part of Nancy’s Pelosi’s broader “Take Responsibility for Workers and Family Act.”) Both are similar—in some cases, identical.

To discipline things, I have organized my thoughts along the lines of the ten steps that Nate Persily and I proposed in the Lawfare Blog last week on the needed response of the nation in light of the medical crisis. These comments are mine alone, not Nate’s. Each heading is one of the ten steps. The text that follows is commentary.

  1. The United States must plan for a significant shift to mail balloting for the 2020 election. This legislation provides one model for nudging states toward a significant shift in offering mail balloting. The biggest shift would come for states that currently require an excuse to receive an absentee ballot, which numbers seventeen in all. In 2016, eight states saw fewer than 5% of ballots cast by mail. By mandating that states, at the very least, move to a “no-excuse” regime, there will undoubtedly be more mail balloting in 2020. How much more will depend on the receptiveness of voters and the urgency of the situation come next fall.
  2. The nation must commit to supporting the logistical effort necessary to conduct mail elections with integrity and efficiency. These bills won’t, by themselves, create the logistical infrastructure necessary to conduct mail elections with integrity and efficiency. As we specify in the Lawfare article, voting by mail is complex. In the states that have expanded it the most, they have done so over several election cycles, fine-tuning the process as time went along. Certainly, money will be necessary to finance any expansion of voting by mail. What is more critical is the expansion of management capacity to match.
  3. Any efforts to expand voting by mail in time for the November election must appreciate the partisan polarization surrounding changes in election rules. To state the obvious, no Republicans have signed onto these efforts, which doom them from the start, at least as written. This is not to say that they’re a waste of time. Certainly, they provide a starting point for bargaining and for signaling to allied groups that the Democratic Party is committed to these issues. (On this point, the absence of a highly visible congressional Republican plan to address the election emergency is telling.)  However, it must be recognized that all the energy around the House and Senate efforts has created a Republican backlash in Congress that is making it more difficult to support measures that Republicans might otherwise support, such as providing funds to states to pursue the strategies they feel the most comfortable with, without federal prescriptions. In that context, the recent op-ed piece by Michael Steele and Eli Lehrer in the Washington Times encouraging conservatives to get behind expanded vote-by-mail in November is heartening.
  4. States should approach this situation as an emergency, not as an opportunity to make long-term changes to election policy. This is another dimension on which the House and Senate efforts run contrary to the recommendations Nate and I made in the Lawfare post. Both the House and Senate efforts mandate that states make permanent changes to their election laws, and to make long-term investments in technologies. As we note in our post, Florida and New Jersey have previously interpreted state laws flexibly in the face of hurricanes bearing down on them as elections were being conducted, only to return to the status quo after the emergency had passed. Citizens understand extraordinary actions taken in extraordinary situations. To push a major permanent policy shift under the guise of an emergency will be viewed suspiciously by a large segment of the population, and certainly by the political class.
  5. States need to reconsider the division of labor between state and local authorities in the conduct of elections. It is not clear that these efforts address the state-local balance of responsibility directly, nor should they necessarily. However, assuming that most states will be spending the next few months planning how to ramp-up mail-ballot operations quickly, it makes sense to imagine that states will bear greater responsibility for certain new logistical burdens, even in states with strong traditions of local control of elections.
  6. Election officials need to be working with the Postal Service immediately to ensure a smooth transition to expanded mail balloting. These efforts do not address the Postal Service directly, other than provide a vehicle for diverting more business its way—which is a good thing. We all know the USPS has its struggles. Nonetheless, it views its role in conveying ballots with pride. The detail here is that local USPS operations and election officials in states that have had low vote-by-mail volume will now need to create working relationships that have taken years to establish in vote-by-mail states. As with all things related to voting by mail, it takes a while to develop these working relationships. We have to anticipate that there will be local bumps in the road.
  7. States need to communicate clearly to voters how mail ballots will be distributed, and develop plans such that ballots actually get to the voters intended. The House bill requires states to provide systems so that voters can request mail ballots online, and then track then electronically. This is good public policy. I doubt, however, that states without these capacities already will be able to develop them in time for November, unless they are already working to create this capacity. In the past, hastily developed electronic request systems have created security vulnerabilities. And, in general, ballot-tracking systems have taken years, not months, to develop. The harder we push everyone to vote by mail this November, the more we will have to plan for the fact that some voters will not get their ballots mailed to them.
  8. In-person voting won’t go away. This is where I believe the House and Senate efforts fall the shortest. Yes, we need to push more people to vote by mail, on an emergency basis, to protect public health and ensure that the November election will proceed on schedule. Still, there are a lot of reasons to believe that in-person voting will continue to be the dominant mode of voting in 2020, especially when we combine Election-Day and early voting. Other than a general requirement that states develop emergency plans for conducting elections during health emergencies, I don’t read anything in these efforts that particularly target in-person voting.
  9. Election officials need to communicate with the public to address the anxiety that is likely to attend the counting of votes. It is probably too much to ask any legislation considered by Congress to address this point.
  10. Adjustments to voting rules must respect behavioral regularities that voters have demonstrated over the years, and are unlikely to change, even in the midst of a public health crisis. This is tied to point # 8. We have to assume that tens of millions of people will choose to vote in person in November 2020. Legislation that focuses on moving voters to mail balloting doesn’t directly address this fact, other than to reduce the number of in-person voters, which can’t be dismissed. That’s not a trivial thing, but it is important to devote attention to organizing in-person voting to safely accommodate everyone who wishes to vote that way. Furthermore, we have to assume that most voters will not pay attention to COVID-19-avoidance measures for the election until sometime late in October. Again, it is probably too much to ask a single bill to focus on all aspects of the public health emergency, but it is telling that the House and Senate efforts sidestep the significant challenges to public education that face election officials in 2020.

Overall, the House and Senate efforts have received a lot of press attention, but must be understood as a Democratic plan for the 2020 elections, not as a blueprint for a bipartisan solution for the emergency at hand. Even though I agree with the aims of much of the legislation, I suspect that the effort to push a policy agenda so closely allied with Democratic orthodoxy talking point creates a bump in the road toward negotiating the final bailout package. Leaving my reservations aside, the presence of a Republican majority in the Senate and a potential presidential veto make these legislative efforts dead letters, at least in this Congress.

This doesn’t mean they are dead letters in the long term, though. We should remember that an early version of the National Voter Registration Act (NVRA) was passed by a Democratic Congress in 1991, only to be vetoed by President George H.W. Bush. Despite losing the battle, Democrats tried again in 1993, following the election of Bill Clinton, who signed the NVRA into law.

In the world we live in now, I hope the position-taking among congressional Democrats, to stake out a long-term position about election reform, does not undermine the immediate, pressing issue, which is to give election officials the support they need now, to get done what needs to be done to assure the November 2020 election goes off as planned.

Some Demographics on Voting by Mail

By Charles Stewart III, MIT

With the sudden surge of interest in mail balloting because of the COVID-19 emergency, there’s also been some interest in questions about who tends to use mail ballots now and who would like to use mail ballots. Here is provide some basic demographics related to the question. Because there’s so much going on right now, I won’t provide much commentary, allowing the numbers to “speak for themselves,” which is rarely a good idea.

The tables here address the following questions:

  1.  Who voted by mail in the 2016 presidential election, by salient demographics (i.e., age, race, education, income, partisanship)?
  2. Who supports expanded voting by mail?
  3. How do people return mail ballots?

The data about the usage of mail ballots and demographics mostly comes from the 2016 Cooperative Congressional Election Study (CCES). Information about support for running elections entirely by mail and the return of mail ballots comes from the 2016 Survey of the Performance of American Elections (SPAE); I also used the SPAE for information related to the use of mail ballots by people with disabilities.

Patterns of mail-ballot usage and support for mail balloting need to be mindful of the fact that states organize mail balloting differently. Relying on the coding first suggested by the National Conference on State Legislatures, I divide states into four regimes: (1) excuse required for an absentee ballot, (2) no excuse required for an absentee ballot, (3) permanent mail ballot list, and (4) complete vote by mail (or “vote at home”). The following tables maintain this distinction.

Here are the take-aways:

  1. There is very little demographic difference in the use of mail ballots.
  2. The one exception is related to age, where voters older than 65 are more likely to use them than younger voters. (Note that some states, even those that generally require an excuse to vote absentee, allow older voters to vote by mail without an excuse.)
  3. The lack of a major difference between demographic groups is contrary to some claims I have been hearing (and some I believed myself before running the numbers).
  4. Contrary to the claims of some, African Americans appear to be slightly more supportive of vote-by-mail reforms than whites.
  5. Despite being the demographic most likely to take advantage of voting by mail, the age group most in opposition to expanded voting by mail are those 65 and older.  The relationship is strongest in non-vote-by-mail states.
  6. Voters in vote-by-mail states who return their mail ballots in person are more confident their votes were counted than those who mailed them back.
  7. Mail voters in vote-by-mail states are more confident their vote was counted as cast than mail voters in other states.
  8. There is still a substantial fraction of voters in vote-by-mail states that believe that all elections should not be held by mail.

Demographics and the use of mail ballots in 2016.

The following tables report the percentage of voters who report that they voted by mail in 2016. Responses are limited to those whose participation in the election was verified by matching to voter lists. Data source: CCES, unless otherwise noted.


Support for holding all elections by mail

The following tables report the percentage of respondents who stated that they supported “holding all elections by mail.” (Source:  SPAE)


Return of mail ballots

The following tables report the method of return of mail ballots, along with the relationship between the method of return and confidence that one’s ballot was counted as cast. (Source: SPAE)

Seven Thoughts on Voting in Age of Covid-19

The following is a series of thoughts about the response of the election community in light of the unfolding health emergency. These thoughts are current as of the moment they are written—Monday morning, March 16, 2020—and will no doubt change as the situation evolves.

1. The election must go on. If we want a government headed by elected officials, we have to elect them. There may be opportunities for delaying primary elections, but the date of the November general election is hard-wired, through statute and the constitution. That’s a hard constraint around which we must design a response.

2. Responses to the crisis must be based on the best scientific evidence we have. Evidence about the public health crisis is grounded in medical science, obviously, and we all will be learning from medical and other scientific experts about how to protect ourselves. There is evidence from the social sciences (including management science) that can also be used to inform best practices that are consistent with best medical practice.

3. Confidence in the election must be maintained as accommodations are made. The research suggests that three major factors affect voter confidence: (1) whether your favored candidate won the election, (2) whether you had a good experience when you voted, and (3) whether a major election practice is new. Election administrators can’t (shouldn’t!) influence who wins, but it should be recognized that any change to election practices—even if bolstered by impartial scientific evidence made with the best of nonpartisan intentions—will be interpreted through a partisan lens. If states make changes to election laws without bipartisan buy-in, a “legitimacy tax” will be paid in November. In addition, radical changes to election administration are rarely made in presidential years, and for good reason. Big changes to policy generally require big changes to processes, training, equipment, real estate, etc. Without attention to managing these changes, the voter experience risks taking a hit. Finally, voters in different parts of the country regard certain types of voting as more or less legitimate. To be quite precise about this, voters living in states where everyone, from elected officials to rank-and-file voters, has believed all their lives that mail voting as an invitation to election fraud, are unlikely to spin on a dime in their attitudes.

4. There may be a lot of latitude in current laws already to adapt to the Covid-19 emergency. Incremental changes may get us the rest of the way. Over the past 30 years, there’s been an organic shift in most states toward more convenient ways of voting. Taking the next step in that evolution may be the right avenue for most states. If you already have a huge permanent absentee list, the next step—mailing a ballot to everyone—may not be such a big lift. If you require an excuse to vote absentee, making it clear that the need to enforce social distancing falls under the medical excuse may work. Bottom line: states and localities can ask what sort of flexibility they have within established laws before they take on the task of major reform under current circumstances.

5. We are about to learn a lot about balancing the need to socially distance with the need to socially congregate. Election officials will benefit from that learning. Yes, we need to self-isolate. At the same time, it is likely that feeding stations will need to be set up in urban and suburban areas, kids of parents who fill critical jobs will be send to attend day care in large numbers, and we all will need to go to grocery stores to shop for food. These realities will demand that we learn how to queue up, transact business, and move about in an enclosed environment while minimizing health risks. What we learn from these everyday transactions will inform how election officials will want to approach November.

6. Capacity planning will be as critical as changing voting laws and regulations. All approaches to dealing with the Covid-19 emergency will challenge the capacity of the election process. Even if mail balloting increases by a meager 10% in 2020 (compared to 2016), that will burden election officials significantly. (The “flatten the curve” point being made about spreading out the timeline of Covid-19 infection has it application to election administration, as well.)

7. The campaigns will have an important role to play in helping “spread the vote.” In recent years, the expansion of mail and in-person early voting has been partially driven by the efforts of the political campaigns to encourage people to vote before the Election Day. Of course, they do this because they believe it is politically advantageous. I have no doubt in my mind that efforts by the campaigns in 2020 to encourage supporters to vote early, either by mail or in person, will fall on more receptive ears than in the past.

Seven Initial Thoughts on the Iowa Caucus Fiasco

It’s Tuesday morning and we still don’t know the outcome of the Iowa caucus. Acknowledging that all the facts haven’t come in yet, here are some of my initial thoughts:

  1. Who runs “elections?” A caucus isn’t an election, of course, it’s an event run entirely by a party. Despite concerns about election administration in the U.S., one thing the fiasco illustrates is what happens when true amateurs run elections (or “elections.”)
  2. The role of technology. Computer technology can help facilitate the tedious calculations that go into figuring who won. But, technology needs to be rigorously tested before being put into use. Don’t use the election/caucus as an opportunity to beta test, much less alpha test.
  3. Learning from technology snafus.  I worry that the wrong lessons will be learned from the failure of the vote-reporting app.  Initial reports suggest the problems are due to failure of the app to perform under load, usability, and lack of capacity in phone back-up, not security.  Security is vitally important, but it is not the only thing.
  4. The inadequacy of back-up plans as the main system. Often, we point to back-up systems, such as paper ballots and paper poll books, as fail-safes in case election computers fail. This is fine if there are one-off problems. They’re not fine when they become the primary system.
  5. The freak-out over not knowing. So much to say here. Democrats and much of the media want an anointed nominee/savior right now to take on Trump. What should be bumps in the road are becoming existential crises. Take a deep breath, people.
  6. The value of starting in a small state. I’ve never been worried about the first nominating events being in small states. Candidates and the parties need to ramp up somewhat gradually. Better a screw-up in Iowa (or New Hampshire) than in a big state.
  7. RCV is not our savior.  Some people I admire argue this is an example of why we need rank-choice voting.  I like RCV.  But, it’s also complicated and prone to complaints when first-round leaders lose out in vote distribution.  This event has little to add to the RCV debate.

Announcing a User Group and Listserv for Data Analysts Working for Federal, State, and Local Election Agencies

Today I’m announcing that the MIT Election Data and Science Lab is creating a user group and related listserv intended for data analysts who work for federal, state, and local election agencies.  I hope that anyone who is interested will read on.

Anyone interested may add themselves to the listserv by going to this link, or by e-mailing me .

The details

The idea behind this user group and listserv is based on the observation that election agencies are increasingly hiring employees to provide data analysis in support of election administration.  In some cases, these are separate, full-time positions.  In others, these are positions for which data analysis is one of several duties.  Some of these employees come from data science or policy analysis backgrounds.  Others have fallen into the position, as the agency they work for found it necessary to respond to requests for increasingly sophisticated data analysis and data requests.

As the number of people providing data analysis to election agencies grows, so does the value of creating a professional community of election administration data analysts.  Some of the benefits include learning from peers, working out puzzles, contributing to the development of this field, and sharing the joys and frustrations of the job.

One can imagine at least two ways that this community could evolve over time.  First, it could exist as an online community organized around the listserv.  The model here is something like the election law listserv that Rick Hasen coordinates out of UC-Irvine.  That’s the minimalist path. The second path is a little more involved, and have a more face-to-face component.  The model I have in mind for this is the annual State Certification Testing of Voting Systems Conference that has been held for nearly a decade.  Others will certainly have other ideas.

My own hope is that we could evolve this into something like the State Certification conference (which I always call the “Merlefest,” after one of its founders and its soul, Merle King), which has done a great job of building a community among those who are responsible for the voting technology side of the house. Not only has it been a great place to share information, but it has provided a safe place for members of the community to develop a professional identity and accumulate knowledge.

For now, we’re starting with a listserv.  Our hope is that the listserv would allow election agency employees who work in data analysis to get to know each other and learn from each other.

Anyone interested may add themselves to the listserv by going to this link, or by e-mailing me .

Feel free to distribute this message to others who might be interested.  For now, we will restrict membership to people who work for federal, state, and local election agencies.  Once a community is established, it can decide whether to add people who do similar work, but for non-election agencies.

One last point:  Some will notice that although we are suggesting that this be a community confined (at the moment) to employees of election agencies, MEDSL is not such an agency.  We recognize the irony.  Our goal is to help jump-start this effort.  Once it gets going, we can step away, if that’s the will of the group.  For now, the important thing is to start.

Six Thoughts on Election Audits: Reflections on the December 2018 Audit Summit at MIT

The Caltech/MIT Voting Technology Project hosted an Election Audit Summit last month that was interesting, fun, and a success (if I say so myself).  With the holidays now over, it thought I would post my initial reactions to the issues raised at the event.

If you want to experience what happened, the conference’s website hosts an archive of the webcast of all the presentations.  The presentation slides are posted there, as well.

While much of the day-and-a-half event focused on risk-limiting audits (RLAs), the conference covered many other topics as well, such as auditing voter lists, ballots, and the assignment of voters to legislative districts.  Attendees covered a wide variety of perspectives — academics, state and local election officials, interested citizens, and committed voter verification activists. In other words, there were people in the room who don’t talk to each other much, and even have been known to talk past each other.

My initial reaction to the event are summarized in these five thoughts.

  1. RLAs have come a long way.
  2. RLAs have a long way to go.
  3. Comprehensive auditing is key.
  4. Auditing isn’t the only way to ensure election integrity.
  5. We need more dialogue like this.

Let me expand on these points a bit.

RLAs have come a long way. 

RLAs have come a long way in the decade-plus period they have been part of the election reform landscape.  RLAs have come a long way along many dimension — theoretical and mathematical justification, practical application, and widespread acceptance.

One of the reasons for this progress is that the intellectual pioneers of RLAs, such as Philip Stark and Ron Rivest, have invested precious time and energy to meet with officials, help run pilots, and develop publicly accessible software tools.

Progress has been made because states, like Colorado, have invested in passing laws, buying equipment, and rearranging how they run elections, so that RLAs are integrated into everyday election administration.  Other states, like Rhode Island and Virginia, have passed laws setting them on a path to eventually following Colorado.

In addition, intrepid state and local officials in places like California, Indiana, Michigan, and New Jersey have sanctioned small-scale pilots.  Finally, there’s a scientific/policy consensus that RLAs are a goal to aim for over the next decade, reflected in the recent report by the National Academies of Science, Engineering, and Medicine on making voting more secure.  (Fair warning: Rivest and I were co-authors of that report.)

RLAs have a long way to go

Despite the great strides over the past decade to build consensus around the value of RLAs, and to make them practical to implement, there’s a lot more work to be done.  At the audit summit, we heard statements and questions such as these:

  • RLA still needs its elevator speech. It remains too complicated an idea to explain to a typical state legislator, who will give you five minutes to make your case.
  • The role of the human element still needs to be established and managed. Tons of details need to be managed in implementing RLAs and humans are bad at keeping track of lots of tedious details.  What is the role of software in managing the process, and how do we know to trust it?
  • Which contests should be audited? Eventually, all elections should be subjected to a risk-limiting audit, but as the technique is being developed, should we focus on top-of-the-ballot offices or down-ballot offices?
  • How much trust needs to be put into the math, and by whom? Although techniques can be put into place that reduce the process of conducting an RLA to a matter of arithmetic, that arithmetic is based on statistical theory. Who vets the theory?  Who sets the standards?
  • Bayesianism vs. frequentism. The canonical RLA models derive from a traditional frequentist approach to statistics.  New approaches rely on Bayesian  Who choses between approaches?  How do RLA laws get written, in a context that the science is still developing?
  • How will RLAs interface with other election-challenge processes? Will the expectation that RLAs be conducted as a part of the canvass process conflict with the goal in close elections to keep ballots undisturbed until the recount? As a general matter, RLA laws may interact with election contest in unanticipated and complex ways.

Comprehensive auditing is key

Risk-limiting audits aren’t the only game in town.  In fact, in my own view — which is not shared by others — RLAs may end up being a bit player in the drive to increase the degree of quality assurance in elections.  At the very least, post-election audits of the vote tally touch on just one aspect of elections where the details matter, mistakes can be easily made, and malicious actors can penetrate.

As I noted in my remarks that kicked off the conference, developments since the 2016 election have illustrated that American elections are operating at increasingly close tolerances; mistakes can have material effects on the outcomes of elections.  Just consider the evidence provided by the breach of the Illinois voter-registration system, the omission of 118,000 voters from the rolls in Los Angeles County during the 2018 primary, the mis-assignment of voters in the 2017 Virginia state election that may have affected the partisan composition of the House of Delegates, and the ballot-design fiasco in Broward County this year that affected the U.S. Senate race in Florida.

Many of the speakers at the conference touched on work they are doing to ensure that voter registration systems, ballots, and the assignment of voters to districts are handled properly.  This was the focus of the first Saturday morning panel, which can be seen by going to this link and choosing the Day 2 AM session # 1.  My favorite line from this very good panel was when Whitney Quesenbery remarked that “post-election auditing is only as good as the paper trail is it based on.”

This idea, that we need more than just RLAs, is related to an argument made by one of the fathers of RLAs, Philip Stark, who, along with David Wagner, has made the case for “evidence-based elections.”  Still, the evidence-based election idea has tended to focus on issues related to tabulation and record-keeping about the tabulation, and I think the horizons need to be expanded even further.

While on the issue of expanding horizons, I also should add that two panelists, Emily Beaulieu and Walter Mebane, reminded us that we can learn a lot about election integrity by considering elections in other countries.  The tools they discussed are particularly relevant when access to the ballots is precluded.  Walter, of course, is well known for developing tools, such as the Election Forensics Toolkit and Guide, that help to conduct forensic analysis of election results, by tagging data anomalies.  Emily wrapped up her presentation by noting that in the polarized societies she studies, sometimes social peace is bought by not being as transparent as Americans would like their elections to be.

We need more dialogue like this

As an observer of election administration trends, it is clear that the world is gravitating toward greater accountability in election administration.  One indicator of this trend is the movement toward requiring more sophisticated audits of election.  The challenge, as I’ve suggested in this piece, is that more sophisticated vote tabulation audits are still in their infancy, both theoretically and practically, and that other forms of quality control are even further behind.

The area of election auditing will only advance with the close collaboration of election officials and technically inclined outsiders, both inside and outside academia.

Absent that collaboration, election administration risks making the outcome of elections prey to errors and malicious attacks; the technically inclined also risk looking like arrogant scolds.

The most heartening aspect of the audit summit is that people with a diversity of opinions, backgrounds, and capabilities could spend two days listening to and learning from each other.  I’m hoping the audit summit can become a regular event.  We have a lot of work still to do.

Fraud, Suppression, and Hacking: Worries about the 2018 Election, and How They Changed

Commentary about the 2018 election often focused on two categories of worries that politicians, voters, and the punditocracy had about its administration — hacking and fraud.  The outcome of the election did a little bit to ease concerns about these worries, especially on the hacking front.  Partisan divisions continued when it came to attitudes about fraud; attitudes were less structured along party lines, and were more likely to change after the election, when it came to hacking.

This is the last in a series of essays I have posted that have contrasted attitudes about the conduct of the 2018 election, comparing the pre- and post-election periods.  A few days ago, I looked at the broad question of voter confidence. and the (possible) demise of the “winners effect.”  Before that, I took at look at the narrower question of confidence in preparations to counter cyber threats in the election.

The data in this post were taken from two surveys I conducted, one before the election (during June 7-11) and one after (during November 7–9).  In each case, the surveys interviewed 1,000 adults as a part of the YouGov Omnibus survey.  The research was supported by a grant from NEO Philanthropy, which bears no responsibility for the results or analysis.

Fraud, Suppression, and Hacking

Elections are complicated stories.  During the conduct of an election, claims are regularly made in an effort to set the public’s expectations about whether the outcome will be, or was, fair.  In recent years, these claims have gotten more insistent and sharper, but they  have been part and parcel of election contests for centuries.

At the risk of over-simplifying, in 2018, three topics showed up in the news on a regular basis that bore on the conduct of the election and its fairness.  The first was fraud, or the idea that the wrong people — immigrants, double-voters, and the like — were illegally voting.  The second was suppression, or the idea that efforts were being made by officials to discourage voting by people because of their race or party.  The final was hacking, or the idea that computer equipment used to administer the election was being tampered with.

We can further divide this last topic in two, by distinguishing between tampering with the computer systems running the election, such as voter registration systems, and the voting machines used to cast and count ballots.

To gauge worries about these topics, in June and in November (after the election), I asked the following battery of questions:

Many people worry that elections might be tampered with, because of the illegal or unethical actions of others.  The following is a list of four ways that bad actors might try to tamper with elections.  [June question] How much of a problem do you consider these to be in a typical election in the United States? [November question]  How much of a problem do you consider these to have been in the recent midterm election nationwide?

  • Tampering with the computers used by election administrators to run elections [Computer tampering]
  • Tampering with the voting equipment used to cast or count ballots [Voting machine tampering]
  • People trying to vote even though they are too young, don’t actually live in the precinct, or are non-citizens [Voter fraud]
  • Officials trying to keep people from voting because of their party membership or race [Voter suppression]

The response categories were “major problem,” “minor problem,” “not a problem,” and “don’t know.”

In June, the biggest perceived problems were tampering with the computers used to run elections (40% “major problem” ) and suppression (41%), followed by tampering with voting machines (36%) and voter fraud (30%). (Click on the accompanying graph to emlargify it.)

With the November election, attitudes moved in two directions.  On the one hand, more people responded that they didn’t know the answer to the question.  Whether this reflects an actual change in attitude, or is an artifact of the survey method and the slight change in questions between the two administrations, remains to be explored.

On the other hand, respondents generally eased their concerns over whether hacking, fraud, or suppression were problems.  These are not huge shifts, but they are consistent, for instance, with my previous finding that respondents became more confident in cyber-preparedness over time.

The role of party

Party is the big independent variable these days, so it’s natural to explore partisan differences in these answers.  Democrats have run on an anti-suppression platform in recent years, while Republicans have been vocal in suggesting that fraud is the election problem to be worried about.

Thus, it’s not surprising that these partisan differences showed up in answers to these survey questions, especially the questions pertaining to fraud and suppression.

In the November survey, for instance, 58% of Democrats stated that voter fraud had not been a problem in the 2018 election, compared to only 16% of Republicans.  In contrast, 48% of Republicans said that suppression was not a problem, compared to only 9% of Democrats.

There were also partisan difference on the two hacking questions, although they weren’t as stark.  For instance, Republicans were more likely to state that tampering with computers used to administer elections was not a problem, by a 29%-16% margin, and that tampering with the voting machines was not a problem (29%-17%).   This partisan difference shouldn’t surprise anyone who has followed these issues, but it also bears emphasizing that there is much greater variability in attitudes about hacking within the parties than there is about fraud and suppression.

So much for November attitudes.  How did attitudes change from the summer?

Here, it really matters what the question is.  Both Democrats and Republicans became less likely to state that hacking of either sort was a problem, after the election had been conducted, although the change was greater in reference to administrative computers compared to voting machines.

On the question of fraud, the outcome of the election did little to change attitudes among members of both parties.

However, on the issue of suppression, we see some interesting variation and distinction between the parties.  Republicans became much less likely to regard suppression as a problem, either a major or minor one, when the question was asked in November, compared to June.

Among Democrats, the fraction saying that suppression was a minor problem fell between June and November, with a slight increase coming among those who said it was a major problem, plus, of course, the increase in the number of people who stated they didn’t know the answer to the question.

Some final thoughts

The purpose of these surveys was to take the pulse of voters, and not to probe these issues deeply.  Therefore, unfortunately, it’s not possible to probe deeply the nature of partisan changes since the summer.

One observations seems obvious to probe in the future, as better and deeper data come available.  Among the four topics explored in these surveys, the issue of voter fraud is probably the most long-standing.  Party divisions were big in June, and they didn’t budge much because of the election.

The other three issues are more emergent.  In the case of suppression, Democrats have certainly been pressing the issue for many years.  In contrast, it’s possible that Republicans just haven’t been paying much attention.  Thus, it is possible that news from states like Georgia and Florida in the days immediately before and after November 6 primed a partisan response, especially among Republicans.  (Democrats were already there.)

The issue of election hacking has emerged in a context of difficult-to-parse claims that evoke attitudes of patriotism, partisanship, and acceptance of technology.  Because the 2018 election ended up being relatively quiet when it came to news of verified cyber attacks on the system, it’s to be expected that Election Day brought relief among voters of all types.

Had there been a major verified cyber attack, the attitudinal patterns would probably have been considerably different.  Consider, for instance, what would have happened if the Broward County election-night reporting system had been hacked into.  Of course, the important thing for the conduct of the election is that it wasn’t hacked into.  But, the important thing for understanding public opinion about election hacking is that 2018 did not test the system like 2016 did, or like 2020 might.

In the coming months, much more comprehensive public opinion data will become available from the 2018 election that will allow more in-depth exploration of the issues I have written about in Election Updates, here and in past weeks.  (The recent release of a great report by the Pew Research Center on some of these issues has left me champing at the bit to gain access to the raw data, once it comes available.)  Until then the equivalent of the election geek hot-stove league will have to chew over the evidence we do have, as we look forward to the spring and even better public opinion data on these issues — not to mention the promise of baseball.