Author Archives: cstewart

Graphic of the week # 1: Polarization in state voter confidence

Beginning today, I hope to post a weekly graphic that I have produced, or that has been produced by one of the team members of the MIT Election Data and Science Lab, that provides some new or interesting insight into how elections are run in the United States.

This week, the subject is voter confidence.  This is a big topic.  Lots of people make claims about voter confidence, particularly what causes it to go up or down, oftentimes tying these claims to support for some type of election reform.

In fact, the literature on voter confidence suggests that very little in the way of election reform can move voter confidence.  What does move it is the election results.  If your guy wins, you’re more confident than if your guy loses.

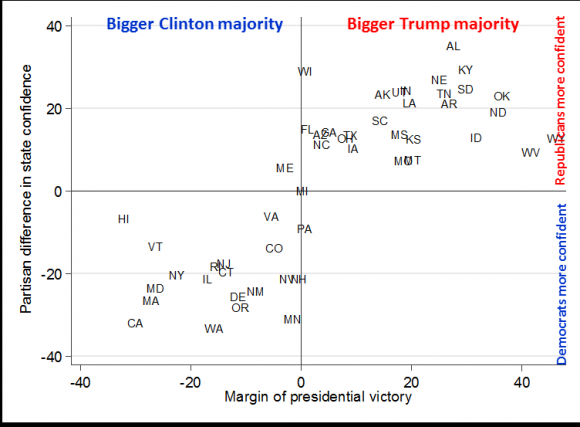
I came across a nice example of this as I was preparing for some talks at upcoming summer election conferences.  The underlying measure of voter confidence is the percentage of respondents to the Survey of the Performance of American Elections (SPAE) who stated they were “very confident” that votes were counted accurately in their state in 2016.  I separated those responses by the party of the respondent and then took the difference.  Positive amounts mean that Republicans were more confident that votes were counted accurately in their state, negative amounts mean that Democrats were more confident.

Below you see the results.  With only three exceptions (Maine, Michigan, and Pennsylvania), the more-confident partisans in a state match the party of the presidential candidate who won the state.


On average, there is a 34-point net jump associated simply with living in a state won by Trump compared to being a state won by Clinton.

There are some states with less polarization than we would expect (Wyoming, West Virginia, and Hawaii) and some with more (Alabama, Washington).  Understanding why this is will have to wait for another day.

Initial thoughts on the “Pence Commission”

President Trump has just issued the executive order announcing the creation of his “voting fraud” commission to be chaired by Vice President Pence.  Here are my own initial thoughts.

1. Title.  This will be the Presidential Advisory Commission on Election Integrity.  Election integrity is the principal dimension over which Democrats and Republicans differ when they think about the main problems of election policy, both at the mass and elite levels.  For instance, in my own module of the 2016 Cooperative Congressional Election Study, I asked respondents to place themselves on a five-point continuum, based on which of the following statements was closest to their own opinion:  (1) It is important to make voting as easy as possible, even if there are some security risks, vs. (2) It is important to make voting as secure as possible, even if voting is not easy.  Here is how partisans distributed themselves among these answers:

This pattern recurs on virtually all questions on this survey — and others like it — that touch on security vs. access.  Bottom line:  This is a commission focused on problems that Republicans will resonate with and Democrats won’t.  Unlike the last presidential commission on election issues, the Bauer-Ginsberg PCEA, the Pence Commission seems like a body that will primarily reinforce partisan lines and gridlock on hot-button election issues.

2. Voter confidence. The executive order starts by charging the commission with identifying “those laws, rules, policies, activities, strategies, and practices that enhance the American people’s confidence in the integrity of the voting process used in Federal elections.”  If the commission focuses on the scholarly research on this item, it will discover two overwhelming findings:  (1) voter confidence is driven most powerfully by who wins and loses and (2) election laws such as voter identification don’t affect the confidence that the mass public has in the electoral process.  In other words, when your party’s candidate wins the election, you become more confident of the process than when your party’s candidate loses.  In 2012, for instance, 52% of Republicans were very confident their votes were counted as cast, according to responses to the Survey of the Performance of American Elections (SPAE).  In 2016, that percentage rose to 71%.  On the flip side, the percentage of Democrats who were very confident fell from 76% to 72%.  There is no election reform that has been shown to produce such swings in voter confidence as this.

3.  Focusing on rare problems vs. common problems.  One of the greatest barriers to advancing the cause of evidence-based election reform is how the field regularly gets side-tracked by issues that are serious on their face, but for which there is little-to-no evidence that they are encountered by millions of voters.  I’m thinking here about the belief that George W. Bush won in 2004 only because thousands of votes were stolen for him by electronic machines in Ohio, or that Donald Trump would have won the popular vote in 2016 if only millions of fraudulent votes hadn’t been cast.  At the same time, state and local election officials struggle to get state legislatures and county commissioners to focus their attention on keeping voting machines up-to-date or modernizing voter registration systems.  These latter problems have had demonstrable effects in the past, and election administration continues to struggle with them today.

4. The lost opportunity.  Most people who work in the field of election administration, academics and practitioners, know that the voter registration system is less than perfect and needs help.  Democrats and Republicans alike have worked in recent years to address the vulnerabilities in this system.  In some cases, they have come together to embrace programs like ERIC (the Electronic Registration Information Center) , in order to improve list maintenance.  In other cases, they have supported online voter registration, which holds the promise of improving the accuracy of voter lists.  The existence of a commission with a partisan framing will create barriers for non-partisan and dispassionate work in this area to proceed — not because it will necessarily politicize those already doing the hard, tedious work in this area, but because they (we) will yet again have to swat back unfounded rumors, leaving less time for the work that actually needs to get done.


Democrats were more likely to vote early in 2016 than Republicans. That’s not new.

By now, I would hope that the idea that early voting patterns reliably predict the eventual outcomes of an election would have died a dignified death. Last week, Philip Bump provided some useful analysis into the tendency of the two parties to vote early in presidential elections.

Bump’s analysis was a useful start, but because it was ultimately based on election returns from the six states that broke out results by mode of voting in 2016 (Election Day, early, and absentee/mail), it is of limited generalizability.

One way of answering the question, “do Democrats rely more on early voting than Republicans” is to look to public opinion surveys.  Luckily, there are now two academic studies with sufficient observations for each state that we can look at the question for each of the fifty states.

Those two studies are the Cooperative Congressional Election Study (CCES) and the Survey of the Performance of American Elections.  The CCES draws a representative sample from across the country.  In 2016, the CCES had 64,600 respondents, ranging from 99 in Wyoming to over 6,000 in California.  The SPAE draws representative samples from each state — 200 from each state plus DC, for 10,200 overall.  Both surveys are conducted by YouGov using similar questions.  By adding the SPAE results to the CCES sample, we boost the number of observations available from the smaller states.

Early voting by Democrats and Republicans in 2016

Early voting by Democrats and Republicans in 2016

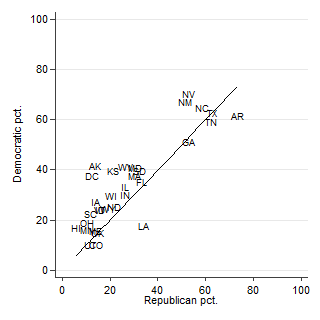
The accompanying graph plots the percentage of Democratic respondents in each state who reported voting early (and in person) against the percentage of Republicans who reported the same.  (Only states in which more than 10% of voters reported voting early are included in the graph.) Note that in virtually every state, Democrats were more likely to vote early than Republicans.  Louisiana and Arkansas were the notable exceptions.

So, using a broader data set, Bump’s analysis is confirmed.

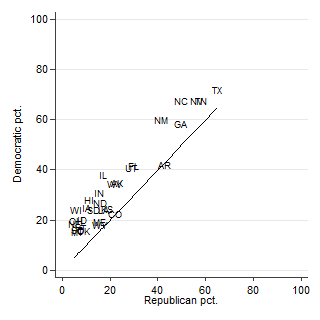
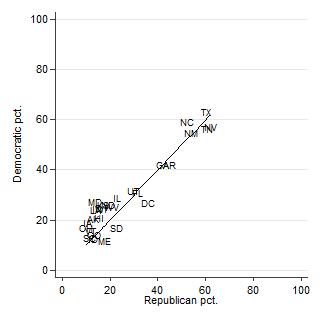
Furthermore, it is possible to expand the analysis back to 2008 and 2012, which is done in the following two graphs. Note that Democrats were also much more likely to use early voting in 2008 in most states (Arkansas is against an exception), but not in 2012.

Early voting in 2008

Early voting in 2008

Early voting in 2012

Early voting in 2012

Some general points to end:

  1. It does appear that Democrats were more likely than Republicans to vote early in 2016.  This was also true in 2008 but not in 2012.
  2. Estimating which party relies more heavily on early voting (or absentee/mail voting, for that matter) is just that, an estimate.  Other surveys and other attempts to use administrative records might come up with different results.  I’d be curious to see what those other results are.
  3. Presidential elections are different from other elections.  Even if Democrats were more likely to vote early in 2016, there is no reason this has to persist for other types of elections, such as local elections or midterm elections.  (Other analysis I’ve performed, for instance, shows that the fraction of voters relying on early voting fluctuates from election-to-election much more than the fraction of voters using absentee ballots.)
  4. Even if it turns out that Democrats are more likely to use election voting than Republicans, it is still the case that a lot of Republicans vote early in the states that allow it.

Georgia’s 6th CD is in reach for the Democrats, but Republicans have a buffer that’s easily discounted

The nation’s electoral attention has turned to the 6th congressional district of Georgia, where the scramble is on to replace Tom Price, the Republican who left to join the Trump Administration.  Press accounts focus on the possibility the seat will flip to the Democratic column, in light of last week’s squeaker in the Kansas by-election and in light of the strong showing of Democrat Jon Ossoff in the 6th CD contest.

A quick look at the numbers from 2016 show why Democratic hopes are so high today.  Just look at the election returns from the general election last November,  Although Price won his district with 60.6% of the vote, Trump carried Price’s district with only 47.7% to Clinton’s 47.5% of the vote.  However, Libertarian candidate Gary Johnson received the remaining 4.9%, which was slightly above his 3.1% total in the state as a whole.

Prognosticators ignore the Johnson vote at their peril.  Leaving them out of the equation makes the district appear to be a 50/50 tossup that might very well go to a high-energy Democratic upstart.  Including them as natural Republican voters in the special election makes the district more in the +5 “leans Republican” category.

A week ago, Democrats managed to increase their vote share in the Kansas 8th CD by 8 points over the November election.  If the same holds true in the Georgia 6th, the district will flip, even accounting for the Libertarian vote in the district.  And yet, I’m not discounting the Johnson vote when push comes to shove, should a run off occur.

Summer 2017 Conference on Election Sciences, Reform, and Administration

My friend Paul Gronke has just issued the call for this year’s summer conference on Election Sciences, Reform, and Administration. Below I’ve cut-and-pasted the full call from Paul. Please consider attending, or even proposing a paper.

[Update:  A fuller version of the call is now up on the EVIC website.]

Dear Colleagues,

Please find attached a call for papers for a 2017 Summer Conference on Election Sciences to be jointly hosted by Reed College and Portland State University from July 26-272, 27-28, 2017.  We currently plan for a conference of approximately 1 1/2 days, but may be able to extend the conference, and provide additional support, pending funding applications. We do have funding in place from Reed College’s McKinley Fund and MIT’s Election Data and Science Lab to fully support first authors.

Lonna Atkeson of the University of New Mexico and Bernard Fraga of Indiana University have graciously agreed to serve as program chairs.

I have included a brief description here; the longer description is in the attached PDF. [Ed note:  not attached]

Paper proposals are being invited for a Summer Conference on Election Science, Reform, and Administration, hosted by Reed College and Portland State University, and co-sponsored by the Early Voting Information Center at Reed College and the Election Data and Science Lab at MIT. The conference will be held in Portland, OR from July 26-27, 2017.

The goals of the conference are, first, to provide a forum for scholars in political science, public administration, law, computer science, statistics, and other fields who are working to develop rigorous empirical approaches to the study of how laws and administrative procedures affect the quality of elections in the United States; and, second, to build scientific capacity by identifying major questions in the field, fostering collaboration, and connecting senior and junior scholars.

Airfare, lodging, and conference meals will be covered for paper presenters and discussants. Other scholars are welcome to attend if they can cover conference costs (details to be announced within a month).

Lonna Atkeson, University of New Mexico, and Bernard Fraga, Indiana University, will serve as program co-chairs, and Paul Gronke, Reed College and Phil Keisling, Center for Public Service at PSU, will act as conference organizers and hosts.

Paper proposals of no more than 250 words should be submitted by April 15, 2017.  Submit proposals at http://bit.ly/PDXelection – we expect to announce decisions by May 1.  Any questions can be sent to atkeson@umn.edu, bfraga@indiana.edu, or gronke@reed.edu.

A mirror site of the PCEA is now up

I am happy to report that we have been able to bring back up a mirror site that reproduces the content, look, and feel of the original Website that hosted the work of the Presidential Commission on Election Administration.  The URL is http://web.mit.edu/supportthevoter/www/. All the content should be there, just like before.

I am indebted to Jeff Licht for actually doing the Web work.

I am delighted to have been able to sponsor this.  I should also note that there are other efforts under way to preserve the important material related to the Commission’s work.  As others have noted, myself included, it was always possible to re-visit the site through the Internet Archive and its Wayback Machine.  The PCEA site was crawled many, many times by IA, and I suspect that long after the cockroaches have taken over, the PCEA site will be available there.  In addition, I am hoping/assuming that the End of Term Project will eventually get around to adding the PCEA to its collection.  (To nominate supportthevoter.gov to their presentation efforts, go to this link.) Also, the EAC has just announced that it plans to incorporate PCEA materials into the new Website it intends to launch in the coming year.

Finally, the charter of the PCEA states that “The records of the Commission and respective subcommittees or subgroups will be maintained pursuant to the Presidential Records Act of 1978 and FACA [the Federal Advisory Committee Act].”  While this doesn’t help in the short-term, it does mean that the PCEA proceedings will be preserved by the National Archives and Records Administration.

In talking with my archive friends over the past several days, they all have made the distinction between access and preservation of materials.  Presently, lots of people are still using the PCEA Website for their work, and it was disruptive to have it taken down.  For all of you (and I include myself), you have a new place to go.  That’s access.  In the long run, no Website lives forever, but we hope the content will.  These other efforts will ensure that long after we are all gone, the materials will be preserved.

New MIT Election Data and Science Lab

I’m very happy to announce this morning that we have launched at MIT an entity we’re calling the MIT Election Data and Science Lab.  The purpose of the lab is to generate, advance, and disseminate scientific knowledge about the conduct of elections in order to improve their performance.

Here is a link to the press release that has more information.

The idea of the lab grows out of a desire to provide a hub to help direct scholars, election officials, citizen groups, journalists, and the general public to the best research into the conduct of elections.  By the end of the year, we will have a fully functioning Website that will serve as a one-stop portal, pointing to scholars, research, and data sources that should be of use to the entire elections community.

While the Lab will be responsible for conducting its own original research, what I most look forward to is championing the excellent work that colleagues around the country are doing to bring rigorous social science to questions of election reform and election administration.  I also hope the Lab will become a venue for practitioners and scholars to meet and grapple with the the difficult empirical issues that face election administration and reform.

This new Lab would not be possible without the financial and moral support of the Madison Initiative of the Hewlett Foundation.  Hewlett is to be praised for stepping up, in this turbulent time, and investing in the long-term strength of American elections.

We have established a very basic Website here that will allow us to share our progress as we build our staff, expand our programming, publish our research, and eventually migrate over to a more sophisticated Website by the end of the year.

As Doug Chapin is fond of saying, stay tuned…

This just in: lines at the polls shorter in 2016 than in 2012

Last Thursday I helped kick off Pew’s Voting in America event by reviewing the preliminary findings from the 2016 Survey of the Performance of American Elections.  (My presentation begins at 1:06:55 in the YouTube video.) While there is a little more work to be done in wrapping up all the data gathering, we have enough responses in to begin painting a systematic view of the election process in 2016 from the perspective of the voters.

One important piece of news from that presentation is that average wait times to vote were down in 2016, compared to 2012, particularly in the states that had the longest waits in 2012.  The following graphs shows the overall perspective.  Here, I have plotted average 2016 wait times against average 2012 wait times.  States below the diagonal line had shorter lines in 2016.  I’ve labeled the states that had the biggest improvements.  Note particularly the drop in Florida times, from an average of 45 minutes to less than 10 minutes.

wait_lower


This is significant news, and a tribute to all the work that went into making the 2016 election run smoothly, despite public comments intended to cast doubt on the quality of American election administration.  The news is a feather in the cap of the bipartisan Presidential Commission on Election Administration, whose creation was spurred on by images of long lines in the 2012 election, both on Election Day itself and in early voting.

Despite this good news, there is still work to be done to achieve the PCEA benchmark that no voter wait longer than 30 minutes in line.  First, even with the significant reduction in wait times among the states with the longest times in 2012, a significant fraction of voters still waited longer than 30 minutes in many states.  (More than 10% of voters waited longer than 30 minutes in roughly half the states.)  Second, while the racial disparities reported in 2012 were diminished in 2016, they weren’t wiped out entirely; the disparity in wait times between whites and blacks in early voting narrowed only slightly.

Nonetheless, this is at least preliminary evidence that when the elections community puts its mind to it, real improvements can be made in the experiences of voters.

Some thoughts about the reports of supposed evidence of election irregularities in MI, PA, and WI

The Internet lit up on Monday over the news, reported in New York Magazine, that a team of computer scientists and lawyers had reported to the Clinton campaign that “they’ve found persuasive evidence that results in Wisconsin, Michigan, and Pennsylvania may have been manipulated or hacked. ”

A later posting in Medium by University of Michigan computer science professor J. Alex Halderman, who was quoted in the NY Mag piece,  stated that the reporter had gotten the point of the analysis wrong, along with some of the numbers.  As he notes, the important point is that all elections should be audited, and not only if you have statistics suggesting that something might be fishy.

Unfortunately, the cat is out of the bag.  Because of the viral spread of the NY Mag article, the conspiratorially minded now have something to hang their hats on, if they want to believe that the 2016 election (like the 2004 election) was stolen by hacked electronic voting machines.

Many of my friends who are not conspiratorially minded have been asking me if I believe the statistical analysis suggested by the NY Mag piece is evidence that something is amiss.  They’re not satisfied with me echoing Alex Halderman’s point that this is beside the point.  So, here are some thoughts about the statistical analysis.

  1. Some very good commentary about the statistical analysis has already appeared in fivethirtyeight.com and vox.com.  Please read it.  (And, do read Halderman’s Medium post, referenced above.)
  2. I should start my own commentary by saying that I have not seen the actual statistical analysis alluded to by the NY Mag piece.  I know no one else who has seen it, either.  (I’ve asked.)  Therefore, I must make assumptions about what was done.  I’ve been doing analyses such as this for over 16 years, so I have a good idea about what was probably done, but without the actual study and the data on which the analysis was conducted, I can’t claim to be replicating the study.  (By the way, I’m also assuming that a “study” was done, but it’s also not at all clear that this was the case.  It could be that Halderman and his colleagues provided some thoughts to the Clinton campaign, and this communication was misconstrued by the public when word got out.)
  3. The gist of the analysis described by NY Mag appears to be comparing Clinton’s vote share across the types of voting machines used by voters in Michigan, Pennsylvania, and Wisconsin.  To attempt a replication of this analysis, it would be necessary to obtain election returns and voting machine data at the appropriate unit of analysis from these three states.
  4. Voting machine use.  Both Michigan and Wisconsin only use paper ballots for Election Day voting.*  Therefore, one simply cannot compare the performance of electronic and paper systems within these states.  This sentence in the NY Mag article must be false:  “The academics presented findings showing that in Wisconsin, Clinton received 7 percent fewer votes in counties that relied on electronic-voting machines compared with counties that used optical scanners and paper ballots.”  On the other hand, some counties in Pennsylvania do use electronic voting machines, known in the election administration field as “DREs” for “direct recording electronic” devices.  Pennsylvania, therefore, could be used to compare results for voters who used electronic machines with those who used paper.
  5. Voting machine data.  For many decades Kim Brace, the owner of Election Data Services, has collected data about the use of voting technologies as a part of his business.  Every four years I buy Kim’s updated data, which I have done for 2016.  Verified Voting also has a publicly available data set that reports voting machine use at the local level.  I tend to prefer Brace’s data because of his long track record of gathering it.  As I show below, both data sources tell similar stories about the use of voting machines in Pennsylvania.  The comparisons are the same, regardless of the voting machine data set.
  6. Election return data.  Here, I use county-level election return data I purchased from Dave Leip at his wonderful U.S. Election Atlas website. (This is from data release 0.5.)
  7. The Pennsylvania comparison.  Using the Brace voting machine data to classify counties, Clinton received 39.3% of the vote in Pennsylvania counties that used opscans and 49.0% of the vote in counties that used DREs.  However, when the standard statistical controls are included to account for the other factors that would predict the Clinton vote share in a county — race, population density, and education — the difference in vote share between Clinton and Trump is reduced to 0.095%.   Using the Verified Voting data to classify counties, Clinton received 40.2% of the vote in opscan counties and 52.4% of the vote in DRE counties.  (The Brace and Verified Voting data sets differ in reporting the machines used in four counties.)   In this case, when the statistical controls for race, population density, and education are included, the vote share difference between Clinton and Trump goes down to 0.6%.

To summarize:

  1. Virtually all Michigan and Wisconsin Election Day voters (and absentee voters, for that matter) use paper ballots.  In Michigan, these ballots are counted on scanners; in Wisconsin, some are counted by hand, but most by scanners.  Election returns from these states cannot be used to compare voting patterns using electronic machines and paper-based systems.  The core empirical claim in the NY Mag article that has the Internet all atwitter cannot be true.
  2. The difference in voting patterns between Pennsylvania voters who used  electronic machines and those who used optically scanned ballots is accounted for by the fact that voting machines are not randomly distributed in Pennsylvania.  Clinton received proportionally more votes in counties with electronic machines, but that is because these counties were disproportionately nonwhite and metropolitan — factors that are correlated with using DREs in Pennsylvania.
  3. The importance of advocating for post-election audits to ensure that the ballots were counted correctly is not a matter of electronic vs. paper ballots, or a matter of whether doing so will save the election for one’s favored candidate.  The reason all systems, regardless of technology, should be audited after every election is to ensure that the election was fair and that the equipment and counting procedures functioned properly.  This critical message was unfortunately garbled by playing to conspiratorial fears about the outcome of the 2016 election.
  4. My biggest fear in this episode is that election officials, state legislators, and voters will now regard advocates for post-election audits as part of the movement to discredit the election of Donald Trump as president.  I know that this is not the intention. My biggest hope is decisionmakers will look beyond the sensational headlines and recognize that post-election audits are simply  a good tool to make sure that the election system has functioned as intended.

*I have learned that between 5% and 10% of Wisconsin voters who are not physically disabled do use the so-called “accessibility machines,” rather than the regular opscan paper ballots.  However, I know of no election returns that have reported the results of ballots cast on these machines alone, nor do I believe that the reports discussed in the NY Mag article were referring to these ballots.

My experience with VoteCastr on Election Day

VoteCastr’s mixed record on election day providing useful information about turnout and the emerging vote totals in real time are now getting scrutiny from the press, including from its partner, Slate.  I was not involved in the development of VoteCastr, so I don’t have much to say about its difficulties in getting the numbers right.  However, I do have one direct anecdote of the VoteCastr operation, based on my observation work on Election, and a few reflections based on that experience.

The anecdote:  I spent election day travelling around Franklin and Delaware Counties in Ohio.  (That’s Columbus and the northern suburbs.)  I visited about 10 voting locations overall which accounted for something like 30 precincts.  At the first voting location I visited, a union hall on the west side of Columbus, I watched for an hour as the hard-pressed workers did their best to whittle down the line of 100 voters who had greeted them when the polls opened at 6:30. (By the end of the hour the line had grown, owing to the painfully slow work of the poll worker handling check-ins for last names ending in S-Z, but that’s another issue.)

At about 7:15, a young woman carrying an over-stuff backpack on which a VoteCastr badge had been affixed came in looking for the polling place manager.  She and he talked for a couple of minutes right next to where I was standing, so I listened in.  This was the dialogue, played out in a space the size of a large living room, stuffed full of voting equipment, folding tables, and about 30 people at any one time:

  • VoteCastr person:  I’m from VoteCastr.  I’m here to gather information about the number of people turning out to vote each hour.  How can I get that information?
  • Manager:  (Looking at the table where they are checking in voters using paper poll books):  I would love to help you, but I don’t know how we would do that.  We’d have to stop all operations and count up the number of signatures on all the poll books to get that.
  • VoteCastr person:  But, don’t you have a list of people who have voted attached to the wall over there?  (Pointing to a list of voters tacked to the wall.)
  • Manager:  Those are people who had previously voted absentee or early.  We don’t post the names of voters in real time.  We do issue reports back to the county a couple of times during the day about the number of people who voted, based on machine use.
  • VoteCastr person:  Could you get the count from looking at the machines more frequently than that?
  • Manager:  Maybe I could, but it would take one of my busy people several minutes to do that and, as you can see, we can’t spare anyone right now.
  • VoteCastr person:  Is there any other way you can think of that I could get the information?
  • Manager:  You’re welcome to count people as they come in the door.  I’m afraid that’s the only way you’re going to get the information you need on an hourly basis.

I can’t vouch for the empirical claims made by the manager or the VoteCastr person, but the manager seemed like an accommodating fellow (and amazingly poised) and the VoteCastr person was very professional and polite.  My conclusion was that they were honestly trying to make this work, but there was no easy solution.

The observation:  If the turnout reporting was so important to the VoteCastr model, why was it sending one of its data-gatherers into a precinct an hour after polls had opened with no idea about how the data and check-in processed worked?  This was either an example of poor training, poor advance knowledge among leadership about how Franklin County elections are administered, poor cooperation with local officials, or a combination of all three.

It brings to mind the work I have done for the past four years to gather precinct-level data about polling practices, for my own research and to provide advice to election officials.  One thing I’ve learned is that when you go into a precinct wanting to get data in the rush of an election, you over-prepare and you plan for each county, and indeed each precinct, to operate differently.  From what I observed, it appeared that the VoteCastr folks assumed that Franklin County had electronic poll books, like neighboring Delaware County.  With EPBs, there was a decent chance that hourly data could have been obtained.  With paper poll books, not so much.

I’m intrigued by VoteCastr and wish them well as they work out their business model.  One thing going against them — and everyone else in this space — is that presidential elections only come around every four years.  That’s bad for two reasons.

First, it’s hard raising funds and organizing a business (or a research project) during the 3.5 years before the next presidential election, because no one is thinking about it.  The right thing to do would be to be conducting endless trial runs on low-turnout elections, to work out the kinks and to gain the trust of election officials who, after all, are the gatekeepers to the precincts.

Second, presidential elections are qualitatively differently from all other elections.  The surge in activity is so much greater than even midterm congressional elections that you don’t know if you have it right until the onslaught hits; if you make mistakes, it’s an eternity until you know if you’ve make the right corrections.  This is a lesson known by election officials for decades, and now it’s a lesson being learned by the new data companies being formed to make sense of elections.