Big changes coming in the OC

As Election Updates readers know, in 2018 our Caltech team collaborated in an important election integrity and election performance auditing study with the Orange County Registrar of Voters. The project material is available online — and we are now working on various research papers and a book-length report about the pilot project, how we did it, what we found, and how we can improve on these methods in the future.

In an interesting development, Orange County will be moving away from traditional Election Day polling place voting, towards more widespread use of voting by mail and vote centers. Here’s an OC Registrar story that talks about the transition.

We are looking forward to the continuation of our collaboration with OCROV, and helping them as they implement and evaluate this transition in 2020. The data and analyses that we did in 2018 will provide strong baseline data that we can use to evaluate the changes in 2020, and there’s no doubt that the results of our continued collaboration will provide important data for other jurisdictions that are planning on similar transitions in the near future.

New developments in the fight on election interference

There is a news report today that in last fall’s midterm elections, the U.S. Cyber Command and the NSA worked to take Russian cyber-trolls offline. It’s an interesting new development in the continuing fight against interference in U.S. elections. Here’s a link to the Washington Post story, and here’s the summary:

The strike on the Internet Research Agency in St. Petersburg, a company underwritten by an oligarch close to President Vladi­mir Putin, was part of the first offensive cyber-campaign against Russia designed to thwart attempts to interfere with a U.S. election, the officials said.

“They basically took the IRA offline,” according to one individual familiar with the matter who, like others, spoke on the condition of anonymity to discuss classified information. “They shut them down.”

Interesting development in the continuing struggle to fight cyber interference in elections.

Announcing a User Group and Listserv for Data Analysts Working for Federal, State, and Local Election Agencies

Today I’m announcing that the MIT Election Data and Science Lab is creating a user group and related listserv intended for data analysts who work for federal, state, and local election agencies.  I hope that anyone who is interested will read on.

Anyone interested may add themselves to the listserv by going to this link, or by e-mailing me .

The details

The idea behind this user group and listserv is based on the observation that election agencies are increasingly hiring employees to provide data analysis in support of election administration.  In some cases, these are separate, full-time positions.  In others, these are positions for which data analysis is one of several duties.  Some of these employees come from data science or policy analysis backgrounds.  Others have fallen into the position, as the agency they work for found it necessary to respond to requests for increasingly sophisticated data analysis and data requests.

As the number of people providing data analysis to election agencies grows, so does the value of creating a professional community of election administration data analysts.  Some of the benefits include learning from peers, working out puzzles, contributing to the development of this field, and sharing the joys and frustrations of the job.

One can imagine at least two ways that this community could evolve over time.  First, it could exist as an online community organized around the listserv.  The model here is something like the election law listserv that Rick Hasen coordinates out of UC-Irvine.  That’s the minimalist path. The second path is a little more involved, and have a more face-to-face component.  The model I have in mind for this is the annual State Certification Testing of Voting Systems Conference that has been held for nearly a decade.  Others will certainly have other ideas.

My own hope is that we could evolve this into something like the State Certification conference (which I always call the “Merlefest,” after one of its founders and its soul, Merle King), which has done a great job of building a community among those who are responsible for the voting technology side of the house. Not only has it been a great place to share information, but it has provided a safe place for members of the community to develop a professional identity and accumulate knowledge.

For now, we’re starting with a listserv.  Our hope is that the listserv would allow election agency employees who work in data analysis to get to know each other and learn from each other.

Anyone interested may add themselves to the listserv by going to this link, or by e-mailing me .

Feel free to distribute this message to others who might be interested.  For now, we will restrict membership to people who work for federal, state, and local election agencies.  Once a community is established, it can decide whether to add people who do similar work, but for non-election agencies.

One last point:  Some will notice that although we are suggesting that this be a community confined (at the moment) to employees of election agencies, MEDSL is not such an agency.  We recognize the irony.  Our goal is to help jump-start this effort.  Once it gets going, we can step away, if that’s the will of the group.  For now, the important thing is to start.

Six Thoughts on Election Audits: Reflections on the December 2018 Audit Summit at MIT

The Caltech/MIT Voting Technology Project hosted an Election Audit Summit last month that was interesting, fun, and a success (if I say so myself).  With the holidays now over, it thought I would post my initial reactions to the issues raised at the event.

If you want to experience what happened, the conference’s website hosts an archive of the webcast of all the presentations.  The presentation slides are posted there, as well.

While much of the day-and-a-half event focused on risk-limiting audits (RLAs), the conference covered many other topics as well, such as auditing voter lists, ballots, and the assignment of voters to legislative districts.  Attendees covered a wide variety of perspectives — academics, state and local election officials, interested citizens, and committed voter verification activists. In other words, there were people in the room who don’t talk to each other much, and even have been known to talk past each other.

My initial reaction to the event are summarized in these five thoughts.

  1. RLAs have come a long way.
  2. RLAs have a long way to go.
  3. Comprehensive auditing is key.
  4. Auditing isn’t the only way to ensure election integrity.
  5. We need more dialogue like this.

Let me expand on these points a bit.

RLAs have come a long way. 

RLAs have come a long way in the decade-plus period they have been part of the election reform landscape.  RLAs have come a long way along many dimension — theoretical and mathematical justification, practical application, and widespread acceptance.

One of the reasons for this progress is that the intellectual pioneers of RLAs, such as Philip Stark and Ron Rivest, have invested precious time and energy to meet with officials, help run pilots, and develop publicly accessible software tools.

Progress has been made because states, like Colorado, have invested in passing laws, buying equipment, and rearranging how they run elections, so that RLAs are integrated into everyday election administration.  Other states, like Rhode Island and Virginia, have passed laws setting them on a path to eventually following Colorado.

In addition, intrepid state and local officials in places like California, Indiana, Michigan, and New Jersey have sanctioned small-scale pilots.  Finally, there’s a scientific/policy consensus that RLAs are a goal to aim for over the next decade, reflected in the recent report by the National Academies of Science, Engineering, and Medicine on making voting more secure.  (Fair warning: Rivest and I were co-authors of that report.)

RLAs have a long way to go

Despite the great strides over the past decade to build consensus around the value of RLAs, and to make them practical to implement, there’s a lot more work to be done.  At the audit summit, we heard statements and questions such as these:

  • RLA still needs its elevator speech. It remains too complicated an idea to explain to a typical state legislator, who will give you five minutes to make your case.
  • The role of the human element still needs to be established and managed. Tons of details need to be managed in implementing RLAs and humans are bad at keeping track of lots of tedious details.  What is the role of software in managing the process, and how do we know to trust it?
  • Which contests should be audited? Eventually, all elections should be subjected to a risk-limiting audit, but as the technique is being developed, should we focus on top-of-the-ballot offices or down-ballot offices?
  • How much trust needs to be put into the math, and by whom? Although techniques can be put into place that reduce the process of conducting an RLA to a matter of arithmetic, that arithmetic is based on statistical theory. Who vets the theory?  Who sets the standards?
  • Bayesianism vs. frequentism. The canonical RLA models derive from a traditional frequentist approach to statistics.  New approaches rely on Bayesian  Who choses between approaches?  How do RLA laws get written, in a context that the science is still developing?
  • How will RLAs interface with other election-challenge processes? Will the expectation that RLAs be conducted as a part of the canvass process conflict with the goal in close elections to keep ballots undisturbed until the recount? As a general matter, RLA laws may interact with election contest in unanticipated and complex ways.

Comprehensive auditing is key

Risk-limiting audits aren’t the only game in town.  In fact, in my own view — which is not shared by others — RLAs may end up being a bit player in the drive to increase the degree of quality assurance in elections.  At the very least, post-election audits of the vote tally touch on just one aspect of elections where the details matter, mistakes can be easily made, and malicious actors can penetrate.

As I noted in my remarks that kicked off the conference, developments since the 2016 election have illustrated that American elections are operating at increasingly close tolerances; mistakes can have material effects on the outcomes of elections.  Just consider the evidence provided by the breach of the Illinois voter-registration system, the omission of 118,000 voters from the rolls in Los Angeles County during the 2018 primary, the mis-assignment of voters in the 2017 Virginia state election that may have affected the partisan composition of the House of Delegates, and the ballot-design fiasco in Broward County this year that affected the U.S. Senate race in Florida.

Many of the speakers at the conference touched on work they are doing to ensure that voter registration systems, ballots, and the assignment of voters to districts are handled properly.  This was the focus of the first Saturday morning panel, which can be seen by going to this link and choosing the Day 2 AM session # 1.  My favorite line from this very good panel was when Whitney Quesenbery remarked that “post-election auditing is only as good as the paper trail is it based on.”

This idea, that we need more than just RLAs, is related to an argument made by one of the fathers of RLAs, Philip Stark, who, along with David Wagner, has made the case for “evidence-based elections.”  Still, the evidence-based election idea has tended to focus on issues related to tabulation and record-keeping about the tabulation, and I think the horizons need to be expanded even further.

While on the issue of expanding horizons, I also should add that two panelists, Emily Beaulieu and Walter Mebane, reminded us that we can learn a lot about election integrity by considering elections in other countries.  The tools they discussed are particularly relevant when access to the ballots is precluded.  Walter, of course, is well known for developing tools, such as the Election Forensics Toolkit and Guide, that help to conduct forensic analysis of election results, by tagging data anomalies.  Emily wrapped up her presentation by noting that in the polarized societies she studies, sometimes social peace is bought by not being as transparent as Americans would like their elections to be.

We need more dialogue like this

As an observer of election administration trends, it is clear that the world is gravitating toward greater accountability in election administration.  One indicator of this trend is the movement toward requiring more sophisticated audits of election.  The challenge, as I’ve suggested in this piece, is that more sophisticated vote tabulation audits are still in their infancy, both theoretically and practically, and that other forms of quality control are even further behind.

The area of election auditing will only advance with the close collaboration of election officials and technically inclined outsiders, both inside and outside academia.

Absent that collaboration, election administration risks making the outcome of elections prey to errors and malicious attacks; the technically inclined also risk looking like arrogant scolds.

The most heartening aspect of the audit summit is that people with a diversity of opinions, backgrounds, and capabilities could spend two days listening to and learning from each other.  I’m hoping the audit summit can become a regular event.  We have a lot of work still to do.

Fraud, Suppression, and Hacking: Worries about the 2018 Election, and How They Changed

Commentary about the 2018 election often focused on two categories of worries that politicians, voters, and the punditocracy had about its administration — hacking and fraud.  The outcome of the election did a little bit to ease concerns about these worries, especially on the hacking front.  Partisan divisions continued when it came to attitudes about fraud; attitudes were less structured along party lines, and were more likely to change after the election, when it came to hacking.

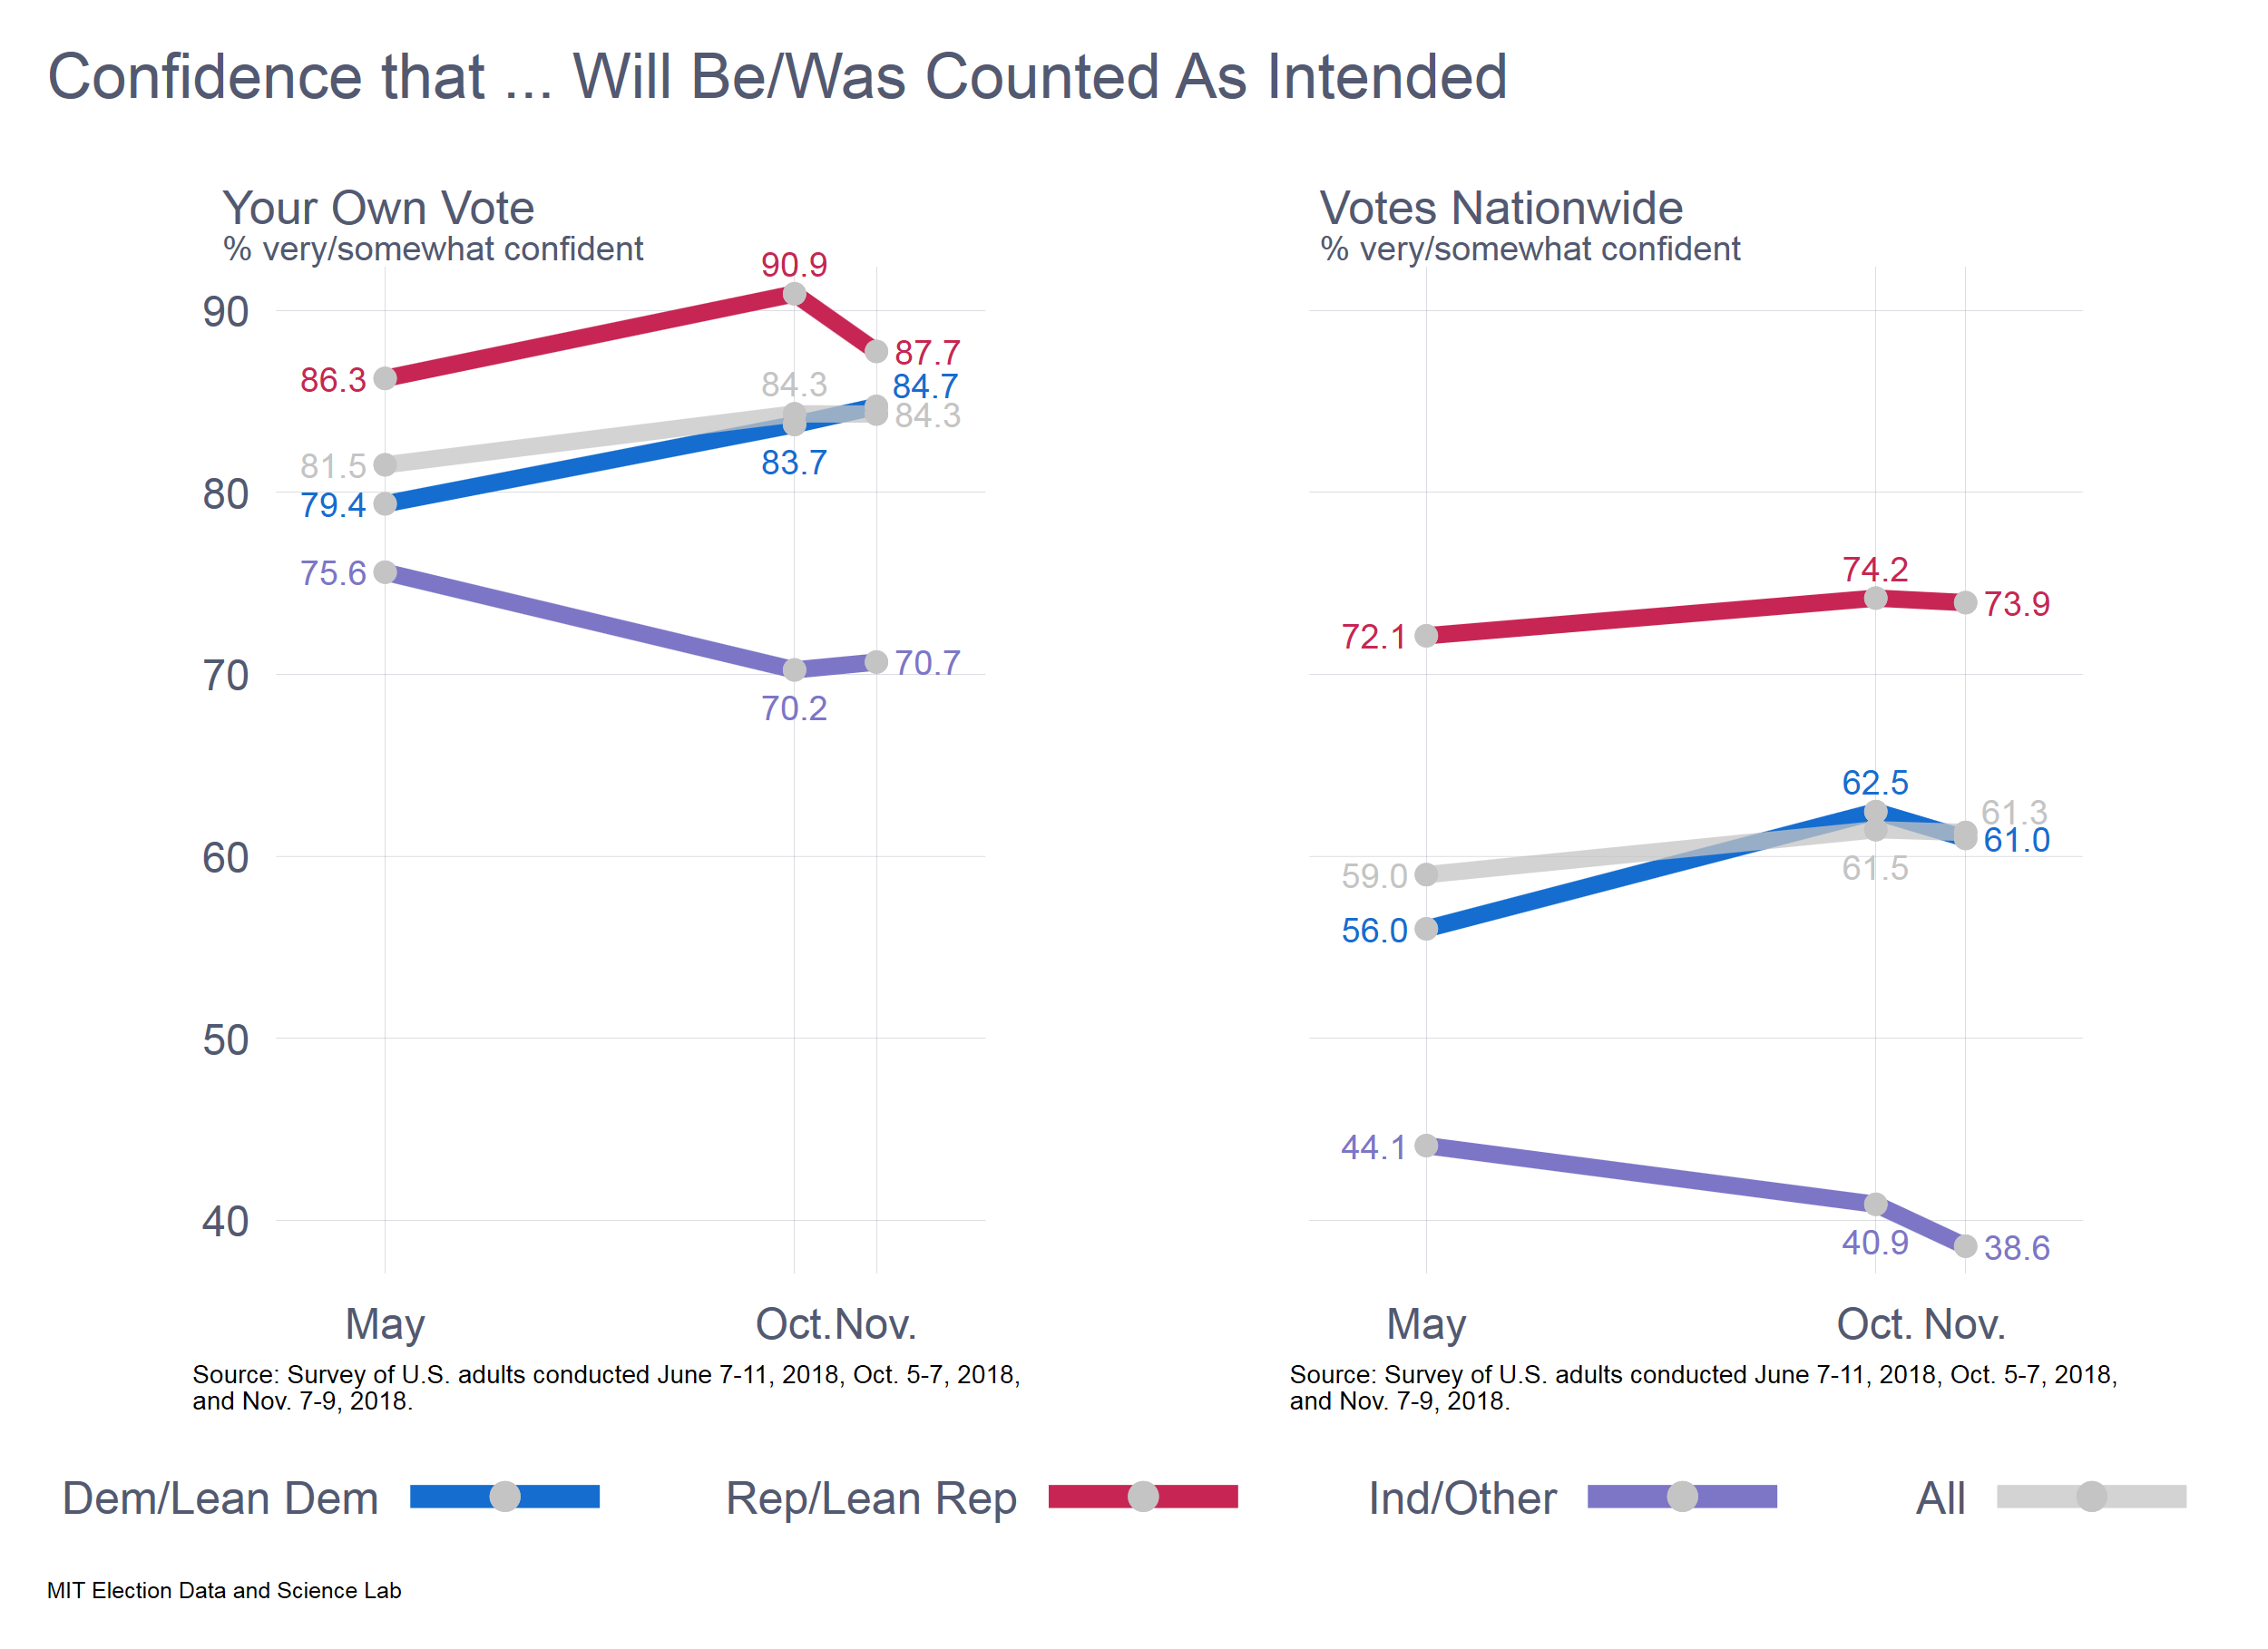
This is the last in a series of essays I have posted that have contrasted attitudes about the conduct of the 2018 election, comparing the pre- and post-election periods.  A few days ago, I looked at the broad question of voter confidence. and the (possible) demise of the “winners effect.”  Before that, I took at look at the narrower question of confidence in preparations to counter cyber threats in the election.

The data in this post were taken from two surveys I conducted, one before the election (during June 7-11) and one after (during November 7–9).  In each case, the surveys interviewed 1,000 adults as a part of the YouGov Omnibus survey.  The research was supported by a grant from NEO Philanthropy, which bears no responsibility for the results or analysis.

Fraud, Suppression, and Hacking

Elections are complicated stories.  During the conduct of an election, claims are regularly made in an effort to set the public’s expectations about whether the outcome will be, or was, fair.  In recent years, these claims have gotten more insistent and sharper, but they  have been part and parcel of election contests for centuries.

At the risk of over-simplifying, in 2018, three topics showed up in the news on a regular basis that bore on the conduct of the election and its fairness.  The first was fraud, or the idea that the wrong people — immigrants, double-voters, and the like — were illegally voting.  The second was suppression, or the idea that efforts were being made by officials to discourage voting by people because of their race or party.  The final was hacking, or the idea that computer equipment used to administer the election was being tampered with.

We can further divide this last topic in two, by distinguishing between tampering with the computer systems running the election, such as voter registration systems, and the voting machines used to cast and count ballots.

To gauge worries about these topics, in June and in November (after the election), I asked the following battery of questions:

Many people worry that elections might be tampered with, because of the illegal or unethical actions of others.  The following is a list of four ways that bad actors might try to tamper with elections.  [June question] How much of a problem do you consider these to be in a typical election in the United States? [November question]  How much of a problem do you consider these to have been in the recent midterm election nationwide?

  • Tampering with the computers used by election administrators to run elections [Computer tampering]
  • Tampering with the voting equipment used to cast or count ballots [Voting machine tampering]
  • People trying to vote even though they are too young, don’t actually live in the precinct, or are non-citizens [Voter fraud]
  • Officials trying to keep people from voting because of their party membership or race [Voter suppression]

The response categories were “major problem,” “minor problem,” “not a problem,” and “don’t know.”

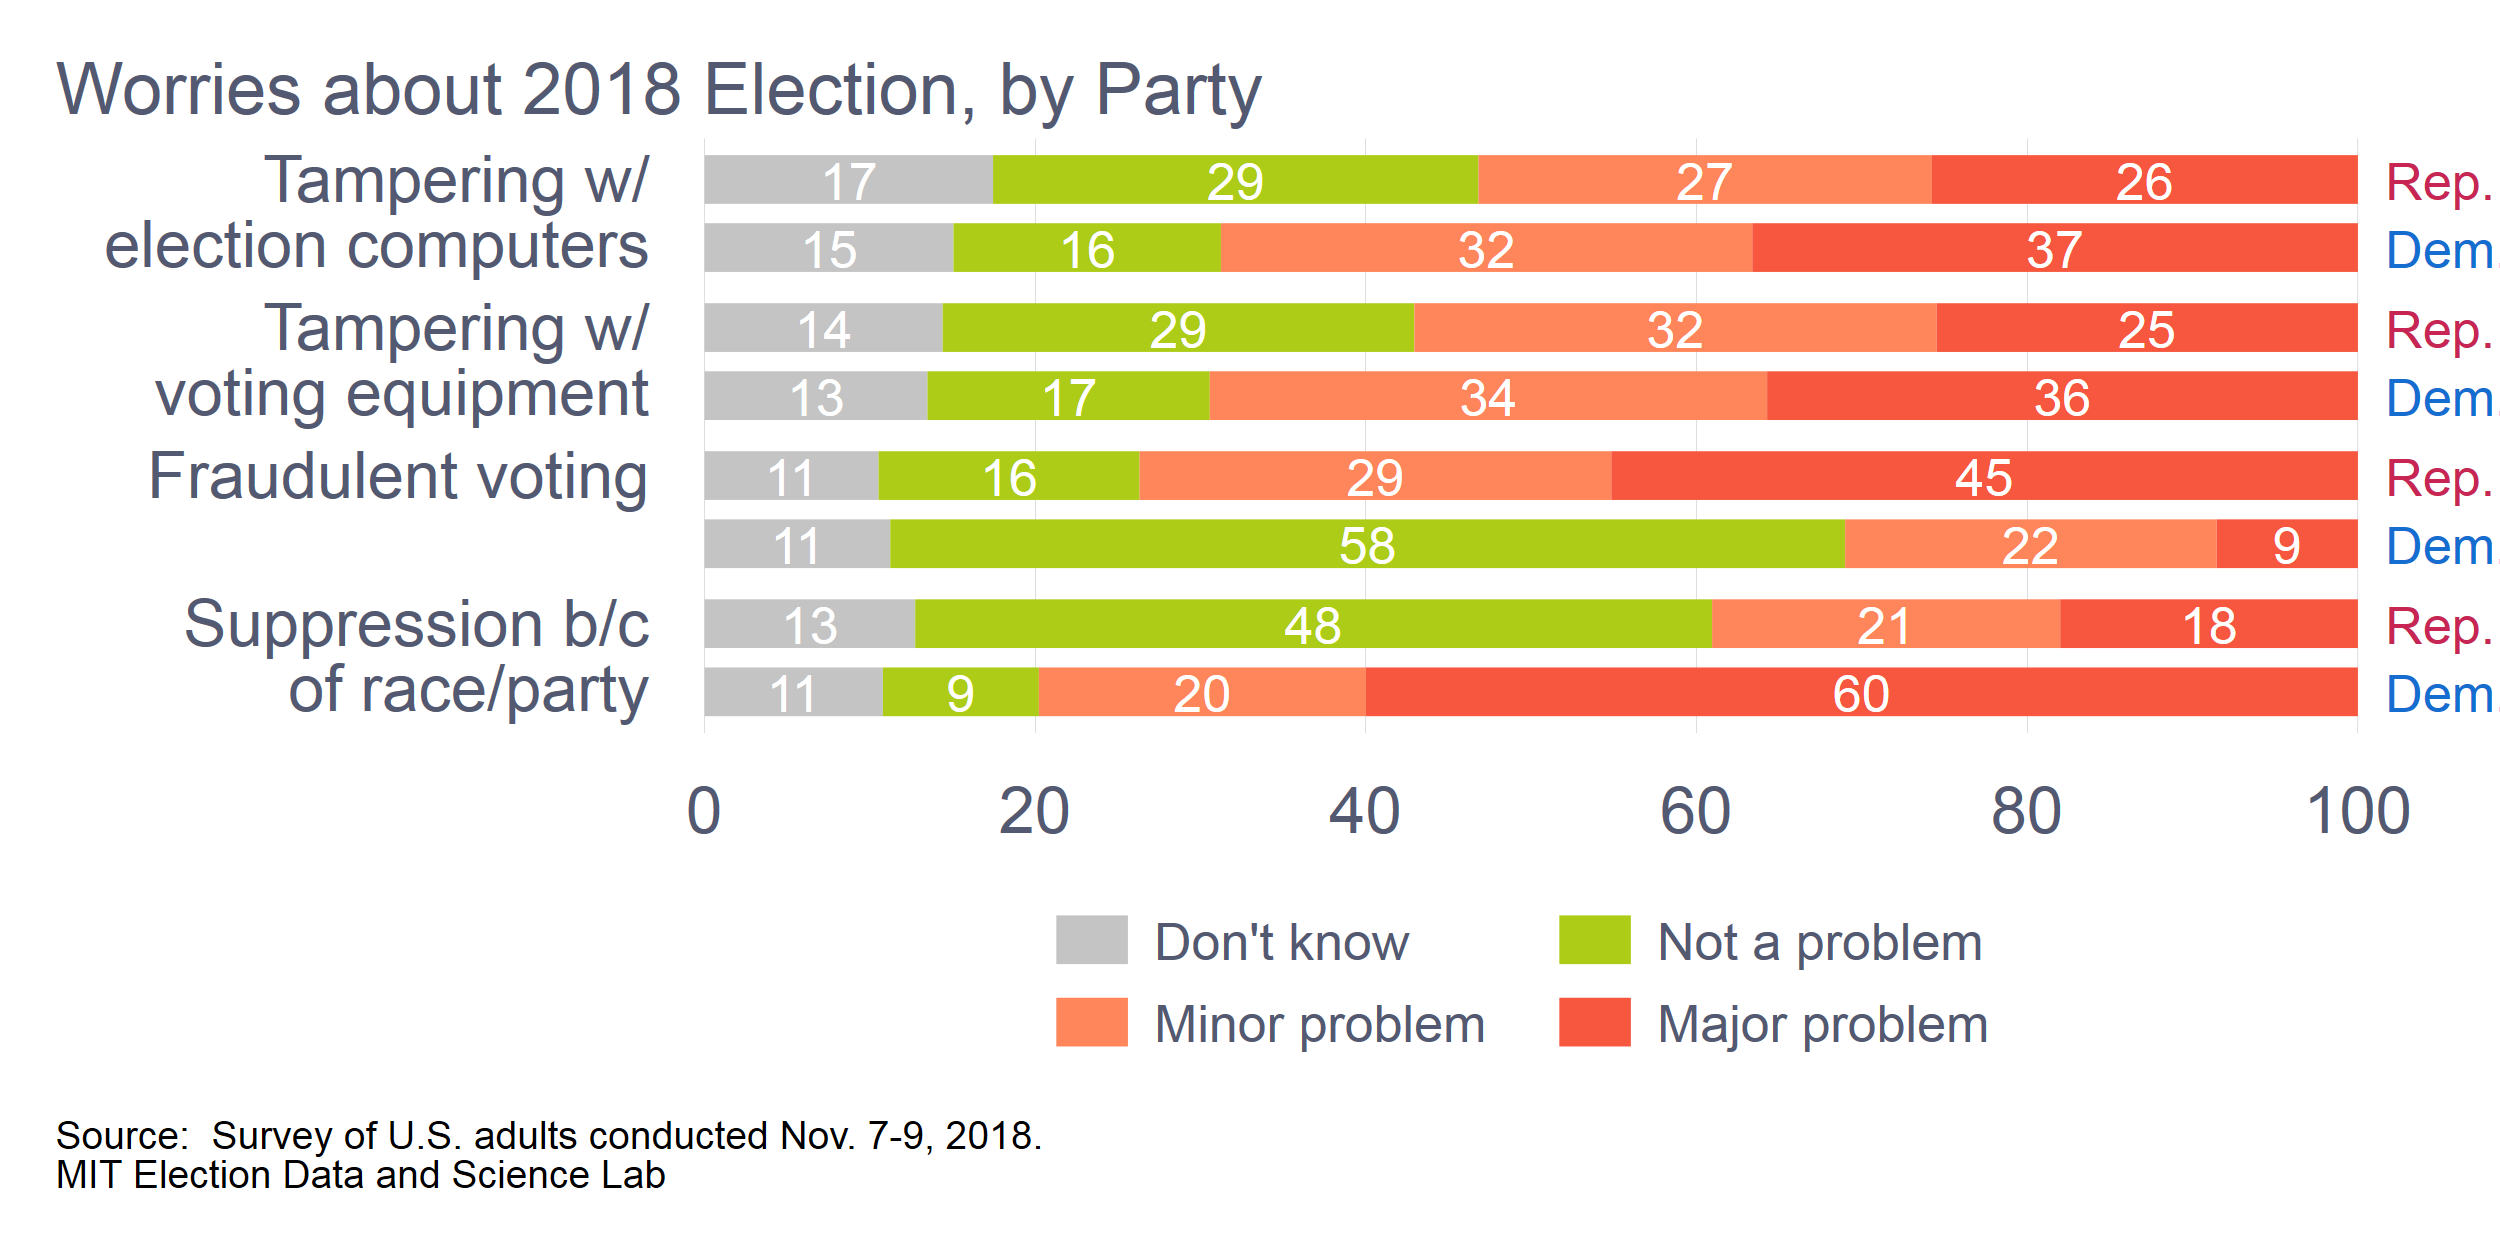
In June, the biggest perceived problems were tampering with the computers used to run elections (40% “major problem” ) and suppression (41%), followed by tampering with voting machines (36%) and voter fraud (30%). (Click on the accompanying graph to emlargify it.)

With the November election, attitudes moved in two directions.  On the one hand, more people responded that they didn’t know the answer to the question.  Whether this reflects an actual change in attitude, or is an artifact of the survey method and the slight change in questions between the two administrations, remains to be explored.

On the other hand, respondents generally eased their concerns over whether hacking, fraud, or suppression were problems.  These are not huge shifts, but they are consistent, for instance, with my previous finding that respondents became more confident in cyber-preparedness over time.

The role of party

Party is the big independent variable these days, so it’s natural to explore partisan differences in these answers.  Democrats have run on an anti-suppression platform in recent years, while Republicans have been vocal in suggesting that fraud is the election problem to be worried about.

Thus, it’s not surprising that these partisan differences showed up in answers to these survey questions, especially the questions pertaining to fraud and suppression.

In the November survey, for instance, 58% of Democrats stated that voter fraud had not been a problem in the 2018 election, compared to only 16% of Republicans.  In contrast, 48% of Republicans said that suppression was not a problem, compared to only 9% of Democrats.

There were also partisan difference on the two hacking questions, although they weren’t as stark.  For instance, Republicans were more likely to state that tampering with computers used to administer elections was not a problem, by a 29%-16% margin, and that tampering with the voting machines was not a problem (29%-17%).   This partisan difference shouldn’t surprise anyone who has followed these issues, but it also bears emphasizing that there is much greater variability in attitudes about hacking within the parties than there is about fraud and suppression.

So much for November attitudes.  How did attitudes change from the summer?

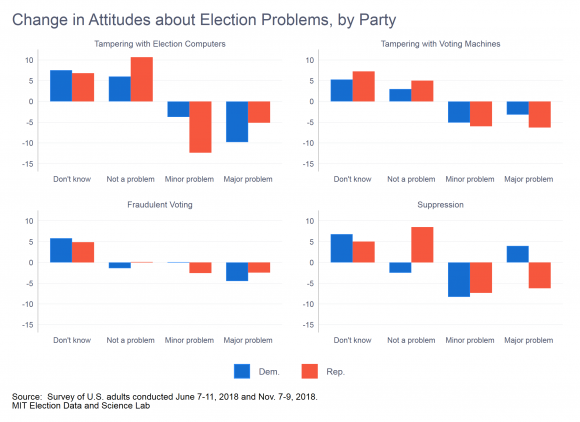
Here, it really matters what the question is.  Both Democrats and Republicans became less likely to state that hacking of either sort was a problem, after the election had been conducted, although the change was greater in reference to administrative computers compared to voting machines.

On the question of fraud, the outcome of the election did little to change attitudes among members of both parties.

However, on the issue of suppression, we see some interesting variation and distinction between the parties.  Republicans became much less likely to regard suppression as a problem, either a major or minor one, when the question was asked in November, compared to June.

Among Democrats, the fraction saying that suppression was a minor problem fell between June and November, with a slight increase coming among those who said it was a major problem, plus, of course, the increase in the number of people who stated they didn’t know the answer to the question.

Some final thoughts

The purpose of these surveys was to take the pulse of voters, and not to probe these issues deeply.  Therefore, unfortunately, it’s not possible to probe deeply the nature of partisan changes since the summer.

One observations seems obvious to probe in the future, as better and deeper data come available.  Among the four topics explored in these surveys, the issue of voter fraud is probably the most long-standing.  Party divisions were big in June, and they didn’t budge much because of the election.

The other three issues are more emergent.  In the case of suppression, Democrats have certainly been pressing the issue for many years.  In contrast, it’s possible that Republicans just haven’t been paying much attention.  Thus, it is possible that news from states like Georgia and Florida in the days immediately before and after November 6 primed a partisan response, especially among Republicans.  (Democrats were already there.)

The issue of election hacking has emerged in a context of difficult-to-parse claims that evoke attitudes of patriotism, partisanship, and acceptance of technology.  Because the 2018 election ended up being relatively quiet when it came to news of verified cyber attacks on the system, it’s to be expected that Election Day brought relief among voters of all types.

Had there been a major verified cyber attack, the attitudinal patterns would probably have been considerably different.  Consider, for instance, what would have happened if the Broward County election-night reporting system had been hacked into.  Of course, the important thing for the conduct of the election is that it wasn’t hacked into.  But, the important thing for understanding public opinion about election hacking is that 2018 did not test the system like 2016 did, or like 2020 might.

In the coming months, much more comprehensive public opinion data will become available from the 2018 election that will allow more in-depth exploration of the issues I have written about in Election Updates, here and in past weeks.  (The recent release of a great report by the Pew Research Center on some of these issues has left me champing at the bit to gain access to the raw data, once it comes available.)  Until then the equivalent of the election geek hot-stove league will have to chew over the evidence we do have, as we look forward to the spring and even better public opinion data on these issues — not to mention the promise of baseball.

Voter Confidence in the 2018 Election: So Long to the Winner’s Effect?

For the past two decades, Americans have consistently exhibited a “winner’s effect” in judging whether votes were counted fairly in elections.  The 2018 election broke that pattern.

In particular, prior to 2018, it was common for voters who identified with the prevailing party in a federal election to acquire much greater confidence post-election that votes were counted as intended.  Conversely, members of the vanquished party became much less confident.

Not in 2018.

In a nationwide survey of adults I conducted in the days immediately after the 2018 federal election, 84% of voters stated they were either “very” or “somewhat” confident that their vote was counted as they intended.  (Throughout this post, I will refer to these respondents as “confident.”)  This is virtually identical to the response they gave a month before the election.  In contrast with patterns from past elections, the results of the election had no effect on overall levels of confident, and essentially no effect on differences between the parties.

The data in this post were taken from two surveys I conducted before the election (during May 14–16 and October 5–7) and one after (on November 7–9).  In each case, the surveys interviewed 1,000 adults as a part of the YouGov Omnibus survey.  The research was supported by a grant from NEO Philanthropy, which bears no responsibility for the results or analysis.  I will contrast the results I found in 2018 with similar research I performed in the 2014 and 2016 federal elections, plus a peer-reviewed article I published in 2015 with Mike Sances, which examined the history of voter confidence from 2000 to 2012.

Voter confidence in the 2018 election

The focus of this post is on two questions that form the core of research on attitudes about public confidence in election administration.  Asked after the election, the questions are:

  • How confident are you that your vote was counted as you intended?
  • How confident are you that votes nationwide were counted as intended?

The questions can also be asked before the election, in which case they are altered slightly to reflect the fact they are being asked prospectively.  (E.g., “How confident are you that your vote will be counted as you intend?”)  There are variations on this question across researchers, but they all tend to produce very similar response patterns.

Voters in 2018 were like voters in past years in one important respect:  they expressed greater confidence that their own vote was (or would be) counted as intended, compared to opinions about vote-counting nationwide.  For instance, after the election, 84% expressed confidence that their own vote was counted as intended, compared to 61% of respondents who said the same about votes nationwide.

Ever since questions about voter confidence have been asked, starting with the 2000 election, answers have tended to divide along partisan lines, depending on who was in power and which party was perceived to have won the most recent election.  A partisan divide also appeared in 2018, both before and after the election. For both questions, Republicans expressed greater confidence than Democrats during the pre-election period.  After the election, the two parties converged when the question was about their own vote, but the divide remained when the question was about vote-counting nationwide.

Before exploring these patterns in more detail, it is notable that voter confidence grew between May and October among partisan identifiers, but it dropped among respondents who identified with neither of the major parties. The election itself seems to have deflected these patterns only a bit.  Yet, the movements in opinions after the election are so small that any changes in early November may have been due to random noise.

Comparison with past year

The patterns in voter confidence that emerged in 2018 are remarkable when we place them beside results from past years.  In an article that Michael Sances and I published in Electoral Studies in 2015, we found that starting in 2000, and running through 2012, there was a tendency for voter confidence to improve after elections.  We don’t see that in 2018.  We also found that there was a tendency for the “winning” party’s adherents to be especially confident in the quality of the vote count post-election.  We also don’t see that in 2018.

To help illustrate how unusual the 2018 patterns are, even compared to the recent past, I went back to research I conducted in 2014 and 2016, using data from my module in the the Cooperative Congressional Election Study (CCES).  In both years, I asked a sample of adults the voter-confidence questions I have been discussing here, before and after the election. In each election, all the patterns related to partisanship were consistent to what Sances and I found when we explored earlier years.  The patterns in 2014 and 2016 were also different from what we see in 2018.

The accompanying graphs show how the question pertaining to confidence in one’s own vote was answered in 2014, 2016, and 2018.  The pre-/post-election change in confidence in 2018 stands in stark contrast with what we saw in 2014 and 2016.  In 2014, for instance, Democrats and Republicans were equally confident one month before the election.*  Just a month later, the results at the polls revealed a set of solid Republican victories in federal and state elections nationwide.  Good electoral news for Republicans was followed by a 14-point increase in Republican confidence and a slight decrease in confidence among Democrats.

In 2016, the even-more-dramatic electoral results produced an even greater shift in partisan confidence.  One month before the election, Democrats were more confident by a margin of 15 points.  Right after the election, Democrats were less confident, by 13 points.

Turning our attention to the question about how the respondent felt about the vote-count nationwide, we see some interesting differences across the years, but the same stark contrast between 2018, on the one hand, the 2014 and 2016, on the other.

In shifting our attention away from local vote counting toward attitudes about elections nationwide, it is notable that in both 2014 and 2016, Democrats went into the election with a much more sanguine view about the state of election administration than Republicans did.  And, in each year, the partisan shifts in attitudes after the election were substantial.  Not so with 2018, where Republicans started out much more confident than Democrats before the election, and stayed that way afterwards.

Parting thoughts

These results just skim the surface of what we have yet to learn about voter confidence in the 2018 election.  As data from the large academic surveys come available in the new year, we’ll be able to explore the contours of voter confidence with much greater nuance than I’ve been able to do here.

I must underscore that the post-election results from 2018 are based on a survey that was in the field the two days after the election.  Responses, therefore, are largely unaffected by election-counting controversies that unfolded in the days and weeks ahead, in Florida, Georgia, and North Carolina. Nor do they reflect responses to the “blue shift” in the returns, as California and other west-coast states completed the count in the following weeks.

For the past two years, close observers of election administration have wondered whether the current political climate is corrosive to trust in our electoral process.  The results I’ve reported here are inconsistent with the view that Americans are less trusting of their elections — or at least the administration of elections.  Overall, Americans expressed more confidence that their votes were counted as intended in 2018 than in either 2014 or 2016.  Although there is a significant partisan divide between Republicans and Democrats in levels of confidence, both at a local and national level, it must be underscored that Democrats in 2018 were still more confident than they were in 2016, or even 2014 for that matter.

What is unusual about 2018 is the fact that Democrats did not become more confident after the election, despite the fact that the party retook the House and held its own in the Senate.  In past years, a blue wave in the election returns would have resulted in Democrats feeling much better about the electoral process than they apparently did in 2018. ** This might be a sign that Democrats have begun to internalize a critique of the electoral process that focuses on efforts to raise barriers to participation in some states.  Alas, we can’t probe questions like this with the data we have.

As questions of election administration become more politicized, it is natural to wonder whether this politicization is eroding confidence in the process among Americans.  The preliminary evidence here is that it has not.  However, the preliminary evidence is also that Americans may be changing how they think about whether they are confident in how elections are run.  If voters are beginning to think about confidence in the system in terms of the long-term political allegiances,  rather than in terms of short-term winners and losers,  then the world of voter confidence will have changed.

Notes

*The analysis here focuses on the difference between the October and November numbers because they are the most comparable data points.  Unfortunately, I did not have public opinion soundings from late spring/early summer, like I did this year.

**Of course, it might also be the case that the 2018 post-election survey was held too close to the election for the fact that this was a blue-wave year to sink in on Democrats.

Two More Thoughts about the NC 9th CD Situation

The North Carolina 9th congressional district controversy is an interesting case of how the data-rich environment of North Carolina elections allows election geeks to explore in great detail the dynamics of an election, using the incomparable North Carolina Board of Elections data website.  In particular, Nathaniel Rakich at FiveThirtyEight  and Michael Bitzer at Old North State Politics have mined the data deeply.

I don’t have much more to add, but I did want to put my oar in on two topics  that may have relevance to the unfolding scandal.  The topics are:

  • Unreturned ballots by newly registered voters
  • Unreturned ballots by infrequent voters

Thing # 1: Unreturned ballots by newly registered voters

The first topic is the return rate of absentee ballots by newly registered voters.  Robeson County officials noticed a large number of absentee ballot requests being dropped off in batches, along with new voter registration forms.  This apparently was one of the things that alerted officials to the possibility that something was up.  In all the analyses posted, I hadn’t seen any reports of the percentage of unreturned absentee ballots by newly registered voters.  Here it goes.

First, this pattern of batches of absentee ballots along with registration forms was reported in August.  It turns out that the non-return rate of absentee ballots requested in August in Robeson County when the registration was also received in August was quite high — 95%, compared to 33% in the rest of the county.  The number of affected ballots was quite small, 21, but this is still an eye-popping statistic when compared to other counties.

Second, broadening the window a bit, the non-return rate of absentee ballots among those who registered any time in 2018 in Robeson County was 81%, compared to 67% for those who had registered before 2017.

Thus, it’s likely that some sort of registration+absentee request bundling  was going on in Robeson.  However, the non-return rate is still high if we exclude the (possibly) bundled requests.  Clearly, if there was fraud, it was multi-strategy.


Thing # 2: Unreturned ballots by infrequent voters

The second topic is whether infrequent voters were more likely to request an absentee ballot and not return it.  This question occurred to me because it fits into a scenario I’ve talked about with other election geeks, about how absentee ballots might be used fraudulently.  The idea is that if someone wants to request a ballot to use it fraudulently, they need to request it for someone who is unlikely to vote.  Otherwise, when they — the actual legitimate voter — do go to vote, it will be noticed that they had already requested an absentee ballot.  If this happens a lot in a jurisdiction, the fraud is more likely to be noticed.

Were a disproportionate number of absentee ballot requests being generated among likely non-voters in the 9th CD?  Yes, but mostly in Bladen County.

To investigate whether this type of calculation may have played into the strategy, I looked a bit more closely at the unreturned absentee ballots in the recent North Carolina election.  I hypothesized that registered voters who had not voted in a long time would be more likely to have an absentee ballot request manufactured for them than a regular voter.  To test this hypothesis, I went to the North Carolina voter history file, and counted up the number of general and primary elections each currently registered voter had participated in since 2010.  There have been nine statewide elections in this time (5 primaries and 4 general elections, not counting November 2018).

Sure enough, frequent voters were less likely to have an unreturned absentee ballot  than non-voters.  Statewide, voters who had participated in the past 9 statewide elections had a non-return rate of 14%, compared to a non-return rate of 32% for those who had never voted.  (Among those who had never voted, but had registered in 2010 or before, the non-return rate was 38%.)  In the 9th CD, these percentages were 25% and 43%, respectively.  In Bladen, they were 22% and 72%

Interestingly enough, in Robeson County, which had the highest non-return rate in the district — and in the state — the relationship between being an infrequent voter and not returning the absentee ballot was not as strong.  Among registered voters who had not cast a ballot since 2010, 81% failed to return their absentee ballot.  Among those who had voted in every election, the non-return rate was 60%.

The accompanying graph shows the more general trend.  The grey circles represent each county in North Carolina.  (Counties in more than one CD show up more than once.)  Throughout the state, infrequent voters are more likely to request absentee ballots that are not returned.

Bladen County is highlighted with the blue hollow circles.  Robeson is highlighted with the hollow red circles.  All the other counties in the districts are the hollow green circles.

If the unreturned absentee ballots reflect, in part, artificial generation of absentee ballot requests, the logic of who was getting targeted looks to have been different in Bladen and Robeson Counties.  Bladen County’s non-returns look more like they were associated with the strategy of requesting absentee ballots from people who would not notice.  Something else was going on in Robeson County.

A Quick Look at North Carolina’s Absentee Ballots

News comes that North Carolina’s State Board of Elections and Ethic Enforcement has chosen not to certify the results of the 9th congressional district race, which was (provisionally) won by the Republican Mark Harris over Democrat Dan McCready by 905 only votes. News accounts provide speculation that this is related to “irregularities” among absentee ballots in the district.  Because North Carolina has such a great collection of election-related datasets, I thought I’d dive in quickly to see what we can see.

(For the data geeks out there, go to this web page, and enjoy!)

My interest is guided by a number of statements that have appeared in news sources and filings with the SBOE.  Among these are:

  • Charges of an unusually large number of mail absentee ballot requests in the “eastern” part of the district, especially Robeson and Bladen Counties.
  • Charges that an unusually high proportion of mail absentee ballots were unreturned.
  • Charges that “ballot harvesters” were gathering up ballots and collecting them in unsealed envelopes (presumably allowing the harvesters to fill in choices on the ballot and then submit them).

What do the data show?  Here are some quick takes.  This is certainly not the last word, but reveals what one can glean from the SBOE’s public data.

Number of ballots by county

It certainly is true that Bladen County had a disproportionately high level of absentee ballot usage in the 2018 congressional election, but it goes beyond Bladen County and beyond the 9th CD.  The accompanying graph shows the percentage of votes that were cast by mail absentee ballots for each district-county unit.  (For instance, Mecklenburg County is in two districts, so it appears twice in the graph,  once for each district.)  The part of Bladen County that is in the 9th District did cast the highest percentage of mail absentee ballots in a congressional race, at 7.3%.  In the entire district, 3.8% of ballots were cast absentee.  And in the part of Bladen County that is not in the 9th District, a lower percentage (4.6%) was cast by mail.

(As with all the graphs in this post, you can click on them to enlargify them.)

Note, however, that Mecklenburg County also cast a notably high percentage of mail ballots in the race — 5.8% of all votes.  Also, because Mecklenburg is about ten times larger than Bladen, it turns that that its absentee ballots (over 5500) swamped Bladen’s (nearly 700).

Finally, it should be said that one other county, Yancey, is an even bigger outlier, if what we’re looking for is a comparison of mail absentee ballot use with the rest of a district.  Nearly six percent (5.6%) of Yancey’s votes were cast by mail, compared to 2.4% in the rest of the 11th district.

Party composition of ballots by county

For absentee ballots to have a major influence on the outcome of a race, they need to overwhelmingly support one of the candidates.    Here, we encounter even more interesting and unexpected patterns.

In this case, the accompanying graph has two parts.  The left part is a scatterplot of the percentage of the two-party vote given to the Democratic congressional candidate in all mail absentee ballots (y-axis) against the percentage of the vote given to the Democratic -congressional candidate in all ballots.  Again, the unit is the county-district.  The red dashed line is set to 45-degrees (ignoring the aspect ratio).  Most counties are above the red line, indicating that in most counties, Democratic congressional candidates did better in the mail absentee vote than they did in the other voting modes.  The data tokens are clustered around the line.  There are outliers, to be sure — a few counties are below the line, where Republican candidates actually out-performed in the absentee ballots, and a few are well above the cloud of circles.

The right part of the graph pulls out the counties that are part of the 9th CD.  There are three counties of note (at least) in the graph.  The first is our friend, Bladen County, which is identified here as one of the few counties in the state in which the Republican congressional candidate actually did better in the mail absentee ballots than in the other modes.  No wonder Democrats were suspicious.  At the same time, Union and Anson Counties are outliers on the other side of the equation.  Union County’s absentee ballots were 21 points more Democratic than votes overall.

As an aside, in the part of Bladen County that is in the 7th congressional district, the Democratic share of the mail absentee vote was 86.6%, compared to an overall Democratic share of 61.3% in that part of the county.  It makes one wonder whether the Democrats and Republicans were concentrating their efforts to get their supporters to cast mail ballots at opposite ends of the county.

Unreturned ballots

This is where it gets interesting.  Some of the speculation that has been floating around suggests that there was a significant number of unreturned mail absentee ballots in the district.  This has been attributed to a number of things.  It could be that political activists were requesting ballots for voters without their consent, and those ballots simply went unreturned.  Another possibility is that “ballot harvesters” were going door-to-door asking people to give them their ballots — and then maybe not delivering them to the county.

I looked at the percentage of requested mail absentee ballots that were never returned for counting, and sure enough, Bladen and Robeson Counties stand out.  The pattern stands out in the accompanying graph, which really needs to be enlarged to be fully appreciated.  (Again, you can enbiggify the graph by clicking on it.)  The graph shows the percentage of mail absentee ballots requested by Democrats (blue dots), Republicans (red dots), and unaffiliated voters (purple dots) that were unreturned in each county.  I have made the dots associated with the counties in the 9th district a bit bigger.  Statewide, about 24% of mail absentee ballots were not returned after being requested — 27% of Democrats, 19% of Republicans, and 24% of unaffiliated.  In Anson, Bladen, and Robeson Counties, the nonreturn rates were 43%, 47%, and 69%, respectively.

Robeson County stands out, because not only is the overall nonreturn rate high, but the partisan discrepancy is so high, as well.  The overall nonreturn rate 69%, but it was 73% for ballots requested by Democrats and 66% for ballots requested by unaffiliated voters.  Still, the Republican nonreturn rate was also unusually high, at 49%.

Some news accounts remarked that Robeson County officials started noticing batches of absentee requests being delivered in August, and started keeping track.  This made me wonder whether the unreturned ballots were associated with these batch requests.  To explore this, I calculated the percentage of mail absentee ballots that were unreturned, based on the week of the year when they were requested.

That led to the accompanying graph.  The grey circles represent the fraction of mail ballots requested each week of 2018 that ended up not being returned for counting, in each county.  Note that the grey circles become a grey blob toward the end.  The black line shows the average nonreturn rate for the whole state, as a function of the week when the ballot was requested.  The hollow blue circles represent Robeson County.  Note the large number of unreturned ballots that appear after week 30 — the August period noted before.  After Labor Day, the nonreturn rate in Robeson fell, although it was still high by statewide standards.

I’ve also shown the Bladen and Anson nonreturn rates by week.  We don’t see the same patterns in these counties that we see in Robeson.

Some concluding remarks

The purpose of this post has been to show the reader the type of numerical exploration one can engage in, using data provided by the North Carolina elections board on its incredible data page.  The analysis seems to confirm the suspicious that “something’s going on” with absentee ballots in the 9th district, but it also suggests complications that aren’t always clear from news accounts.  It seems quite likely that the campaigns — or individuals acting to support them — targeted absentee ballots in some counties, and not just in the 9th district.  (I have generated similar graphs to the ones shown here for the 2016 election, and there are some stories to be told…)  Whether this was just a small bit of tactical political warfare or something more nefarious, we’ll have to wait to see.


Confidence in Election Cyber-Preparedness Sees Post-Election Improvements

Pre-election worries about the conduct of the 2018 election centered on the threats of cyber-attacks on election systems from abroad and hacking of voting machines from, well, everywhere.  Although the election produced the usual supply of stories that raised concerns about election administration overall, there was no verified successful attack on computerized election equipment this year.  The question this raises is whether this news percolated down to the general public.

Based on public opinion research I conducted after the election, it seems that it did.

However,the public was already becoming more optimistic about cyber-preparation before the election.  Last June, 53% of the public stated they were either very or somewhat confident that local election officials had “taken adequate measures to guard against voting being interfered with this November, due to computer hacking.” By October, this proportion had risen to 62%.  Immediately after the election, 68% of the public stated they were either very or somewhat confident that local officials had, in fact, taken adequate measures to guard against computer hacking in the election.

Not surprisingly, both before and after the election, attitudes about election cyber-preparation were structured along partisan lines. Republicans were more confident than Democrats in June (66% vs. 51%), October (80% vs. 60%), and November (79% vs. 71%).

What is probably more interesting is that attitudes about cyber-preparation also varied by respondent education and attention to the news.   As we will see, the pattern of responses by education was especially interesting.

The data in this post were taken from three surveys I conducted during June 7-11 and October 5-7, before the election, and during November 7-9, after the election.  In each case, I interviewed 1,000 adults as a part of the YouGov Omnibus survey.  The research was supported by a grant from NEO Philanthropy, which bears no responsibility for the results or analysis.

Partisan attitudes

Unsurprisingly, attitudes about election administration have become structured around partisanship for many years.  In the case of attitudes about cyber preparations, in June Republicans were 14 points more likely to agree that local officials were taking adequate precautions against computer hacking in the upcoming election.  By October, that gap had opened up a bit to 17 points, although both Democrats and Republicans had become more confident across those four months.

Experience from the election did not change how Republicans viewed cyber preparations, but it did alter the views of Democrats quite a bit.  Republicans were still more sanguine, but the gap between Democratic and Republican attitudes had been cut in half.

Respondents who were neither Democrats nor Republicans — which includes both “pure” independents (about 17% of respondents) and minor-party identifiers (6%) were much, much less likely to express confidence in preparations about computer hacking across all three surveys.  They were also immune to changing opinions across the five months.

Interest in the news

The fact that partisans of all stripes became more confident in the preparations of local election officials to handle computer security suggests there were other factors that led Americans to change their attitudes about cyber preparations. What might these be?  A couple come immediately to mind.  The first is attention to the news.  The second is education.

The YouGov omnibus has a question intended to measure how closely respondents pay attention to the news and public affairs: “Would you say you follow what’s going on in government and public affairs … most of the time/ some of the time/ only now and then/ hardly at all.”

Throughout the past five months, the respondents who were the most confident that local officials had taken adequate precautions against election hacking were also the most likely to follow what’s going on in government.  Right after the election, 78% of those who followed public affairs “most of the time” had confidence in these preparations, compared to 69% of those who followed public affairs “some of the time” or “now and then.”  Among those who followed public affairs “hardly at all” or who didn’t know, only 34% were confident.

In addition, respondents at all level of attention to public affairs increased their confidence in the adequacy of computer-hacking preparations over the three surveys.

The fact that high-information respondents — political junkies — have consistently expressed the greatest confidence in the adequacy of the response to potential election cyber attacks is interesting, considering the amount of negative press that election officials received before the election about their security preparations for the 2018 election.  This finding suggests that the negative tone of many of these articles did not sink into the consciousness of all readers.  Or, it could suggest that high-information respondents already are more likely to trust election officials as a general matter any way.

Education

The correlations between educational attainment and attitudes about cyber preparations are probably the most interesting in the surveys.  All educational groups became more confident over time in the degree of preparations to counter hacking the election.  However, one group stands out in how this correlation changed — those with postgraduate degrees.

Back in June, when the question about cyber preparation was first asked, respondents with postgraduate degrees were by far the most skeptical.  Only 43% of postgraduates had confidence in the level of preparation, compared to 54% of all other respondents.

As summer turned to fall, all groups, with the possible exception of those with no more than a high school education, became more confident, but the biggest movement came from those with postgraduate degrees.  Finally, in the month that bracketed the election, all educational group became more confident, but the increase in confidence among postgraduate degree-holders is especially striking.

Opinions and election machines

Finally, one of the major topics in the election security realm was the fact that about 20% of voters, including all in-person voters in five states, continued to cast ballots on paperless voting machines (direct-recording electronic machines, or DREs).  The past couple of years have seen a relentless attack on these machines by reform groups and expert bodies (including one I served on), and so it would be natural to see if voters from states with a high degree of DRE usage had a lower opinion about hacking preparations at the state and local level.

It is notable that in the five states that rely entirely on DREs without a voter-verifiable paper audit trail (Delaware, Georgia, Louisiana, New Jersey, and South Carolina), a majority of respondents were not confident in computer hacking preparations in the summer.  In June, 42% of respondents from these fives states expressed confidence, compared to 54% of respondents from all other states.  By October, these numbers had tightened up, to mere 58%/63% differential.   Finally, in the November poll, 67% of respondents from the all-DRE states were confident in their states’ preparations to combat computer hacking, compared to 69% of respondents in the non-DRE states.

The number of voters in the surveys from the DRE states is relatively small (only about 90), so I would not bet too much on this analysis.  However, as I have written before, (see this link, for instance) up until recently, voters in all-DRE states have been quite confident in the voting machines they use.  The fact that respondents in these states may have been less confident in overall computer hacking preparations during the summer may be further evidence in the gradual erosion of confidence in these machines, where they are being used.  Still, we don’t see evidence here of those voters being more worried about whether their states are adequately pushing back against the dangers of hacking elections.

Conclusion

Computer security is a new topic in the area of election administration for most of the public.  It is unsurprising, therefore, that attitudes are fluid.  Like other election-administration attitudes, they are amenable to being viewed through a partisan lens.  But, because the issue is so new, attitudes about hacking are also amenable to being changed by unfolding events.  No verifiable computer attacks on voting machines were reported in 2018, and some of the public picked up on it.  Whether this positive state of affairs remains unchanged is, of course, subject to the unfolding of history.  It will be interesting to see what happens, as we move into the 2020 election season, and the outcome of the election (and thus the threat environment) moves to a different level.

On the recounts: Let’s get it right

Why don’t we immediately know the results of American elections right after polls close on election night?

The answer is simple. American elections are highly decentralized, and highly complex. The laws, procedures, and technologies used for our elections are not designed to produce quick results. Rather the way we administer elections in America requires patience, as we want to get the numbers right, not rely on guesswork.

In America we pride ourselves on our federalist system. One important principle of our democracy is that states many rights under the U.S. Constitution, and important state rights is running elections. States have wide authority to determine the conduct of their elections, and that’s one reason that we see such vast differences in how elections are run in America.

But the decentralization goes further, because in most states elections are largely run by counties or even municipalities. This means that we don’t have a single federal election, nor do we have fifty elections in the states. Rather we have thousands of elections in the November of each even-numbered year, with very different procedures and technologies.

The reality of this extreme decentralization of election administration in America, which is largely unique in the world, is that we have to rely on under-resourced local governments to run elections with integrity. That’s a big ask, because elections are complex administrative tasks.

At Caltech, we’ve been working in collaboration with the Orange County Registrar of Voters here in Southern California, and studying various methods to help audit their election administration practices. When you look under the hood, and see exactly how elections are administered in Orange County, you see quickly how complicated it is.

In the elections this fall, Orange County had over 1500 polling locations, and had to recruit thousands of poll workers to service the polling locations. They have about 1.5 million registered voters, with at least 8,000 of them living abroad or serving in the military. 1.1 million ballots were sent to voters in the mail before the election.

Our research group spent time observing voting in five of Orange County’s early voting centers, and in 35 polling places on Election Day. Seeing how poll workers do their jobs, how the technology works, and witnessing voter experiences directly, is an invaluable experience. We observed just how diligent polling place inspectors and clerks about about trying to provide a good experience for voters.

But we also saw how complicated the process is for poll workers, and saw first-hand why it takes so long for final election results to be tabulated and certified in places like Orange County.

In every Election Day polling place we visited, we saw many voters bringing in their completed and sealed mail ballots, depositing them in the ballot box. Many voters who had received a by-mail ballot brought them along, and surrendered them at the polling place, preferring to vote at the polling place instead. Some of the by-mail voters forgot to bring their ballots to surrender, and others could not be found in the registration books, leading many voters to cast provisional ballots.

All of these ballots have to be confirmed and reconciled after the polls close on Election Day. Despite what people may claim, election officials count every valid ballot — but they must first determine which ballots are valid, and they need to reconcile the vast array of ballots coming from different sources: from in-person early voting, absentee ballots sent by mail, ballots from overseas voters and military personnel, Election Day ballots, provisionals, and mail ballots dropped off on Election Day.

Keep in mind that this process happens in every election jurisdiction in America. The exact procedures and voting technologies used differ across states and counties, but every one of those jurisdictions is doing this very process to come up with a final and accurate tally of all valid votes that were cast in this midterm election. Some jurisdictions do it quickly, others will be slower, but in every single election jurisdiction in America, it takes time to count all of the votes.

This process isn’t pretty to watch, but it’s vital for the health of our democracy. And this process just takes time, because election officials want to get the most accurate count of the vote as is possible.

Not having final election results just after the polls close is not an indication of fraud, or any necessary indication that there was something wrong with the election. Instead, the delay in reporting final results is generally a good thing, as it means that election officials are working hard to make sure that all valid votes are included in the final tabulation.

So why don’t we have final results in many places, a week after the election? Because American elections are decentralized, and complex. Election officials are working to get the results right. We need to give them the time to do that, free from political pressure.

My advice?

Be patient, let the process continue, and make sure that every valid vote cast in the midterm election is counted.