Category Archives: Uncategorized

Polling Place Observation As A Classroom Experience

When we first started the Voting Technology Project, in the immediate aftermath of the 2000 presidential election, there was very little known in the research literature about the administration of polling places. We quickly learned, as part of the initial research we did in 2000 and 2001, that polling place problems might have produced a large number of “lost votes” in the 2000 presidential election, but we really had no precise methodology for then producing a reliable estimate of the number of votes lost to polling place problems in 2000, nor a good methodology for understanding what was going on in polling places that might have generated lost votes in that same election. The data and tools we had available to us back then led us to estimate that up to a million votes may have been lost in the 2000 presidential election due to problems in polling places.

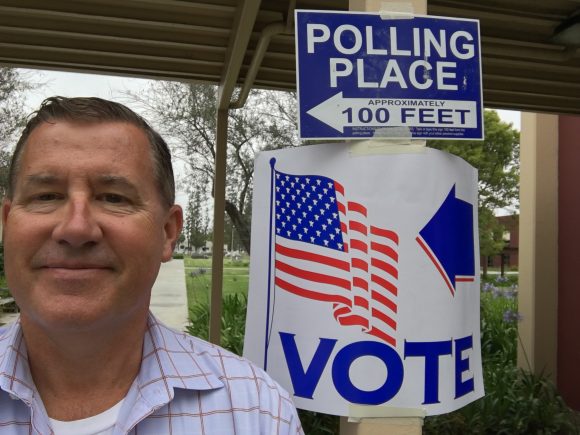
Observing elections in Orange County (CA) in June 2018.

In our search for new ways to understand what was going on in polling places that might be generating lost votes, we realized that we needed to do some qualitative, in-person, analysis of polling place administration and operations. Early in 2001, I did my first in-person observation of polling places, which was an eye-opening experience. This led to a number of working papers and research articles, for example the paper that I published with Thad Hall, “Controlling Democracy: The Principal-Agent Problems in Election Administration.”. We found that by working collaboratively with state and local election officials, we could gain access to polling places during elections and thereby learn a great deal about how elections are administered, from them and their polling place workers.

Over the years, these polling place observation efforts have become quite routine for me, and I’ve been involved in polling place observation efforts in many states and countries. Each time I go into a polling place I learn something new, and these qualitative studies have given me an invaluable education about election administration, polling place practices, and election security.

As part of my polling place observations, I early on began to involve graduate students from my research group, and also to involve Caltech undergraduates. I integrated visits to actual polling places into the curriculum of my courses; we would discuss election administration before Election Day, we would then engage in polling place observation on Election Day, and then we would discuss what they observed and what we learned from this activity. In general, this has been wildly successful — for students, to actually see the process as it really works, to meet polling place workers and election officials, and to learn the practical details of administering large and complex elections, is an invaluable part of their education. A number of graduate students who where part of these efforts have gone on to themselves continue to observe elections in their area, and to also build these sort of efforts into their curriculum.

Party list ballots in Buenos Aires

But beyond my anecdotal evidence about the effectiveness of teaching students about election administration through polling place observations, I’ve always wondered about how we can try to better measure the education effect of projects like these, and to from there learn more about how to improve our education of each generation of students about election administration and democracy.

That’s why I was very excited to see the recent publication of “Pedagogic Value of Polling-Place Observation by Students”, by Christopher Mann and a number of colleagues. I urge colleagues who are interested in adding an activity like this to their curriculum to read this paper closely, as it has a number of lessons for all of us.

Here’s the paper’s abstract, for interested readers:

Good education requires student experiences that deliver lessons about practice as well as theory and that encourage students to work for the public good—especially in the operation of democratic institutions (Dewey 1923; Dewy 1938). We report on an evaluation of the pedagogical value of a research project involving 23 colleges and universities across the country. Faculty trained and supervised students who observed polling places in the 2016 General Election. Our findings indicate that this was a valuable learning experience in both the short and long terms. Students found their experiences to be valuable and reported learning generally and specifically related to course material. Postelection, they also felt more knowledgeable about election science topics, voting behavior, and research methods. Students reported interest in participating in similar research in the future, would recommend other students to do so, and expressed interest in more learning and research about the topics central to their experience. Our results suggest that participants appreciated the importance of elections and their study. Collectively, the participating students are engaged and efficacious—essential qualities of citizens in a democracy.

My experience has been that student polling place observation can be a very valuable addition to undergraduate and graduate education. I know that every time I enter a polling place to observe, I learn something new — and helping students along that journey can really have an important effect on their educational experience.
More DMV mistakes in California’s new “motor voter” process

The LA Times reported this week that another 1,500 registration errors have been identified in the DMV “motor voter” process. This time, the errors are being blamed on “data entry” errors.

At this point, given that the general elections are only weeks away, it would be fantastic to see if the type of registration database forensics methods that our research group has been building and testing in our collaboration with the Orange County Registrar of Voters might be applied statewide. While there’s never any guarantees in life, it’s likely that the methods we have been developing might identify some of the errors that DMV seems to be generating, in particular potential duplicate records and sudden changes to important fields in the registration database (like party registration). We’d need to test this out soon, to see if how the methods that we’ve been working on with Orange County might work with the statewide database.

Third-party forensic analysis might help identify some of these problems in the voter database, and could help provide some transparency into the integrity of the database during the important 2018 midterm elections.

Americans Are (Slightly) More Confident about Fending off “Computer Hacking” in the Upcoming Election

In recent months, Americans have become somewhat more confident that election officials are taking the steps necessary to guard against “computer hacking” in the upcoming election.  At the same time, likely voters have become no more (or less) confident that their votes will be counted as intended this coming November.

These findings are based on answers to questions posed to a representative national sample of 1,000 adults by YouGov last weekend.  The research was supported by a grant from NEO Philanthropy, which bears no responsibility for the results or analysis.  These questions, about computer hacking and overall voter confidence, were identical to ones asked last spring.  The results suggest that despite a fairly steady stream of negative journalistic reports and opinion pieces implying that election officials are unprepared for the November election (like here, here, and here), the public’s overall evaluations have remained steady, and certainly haven’t gotten worse.

A deeper dive into the data show many of the same traces of partisanship that are now common in attitudes about election administration.  For instance, Republicans are more confident about the upcoming election, both from a cybersecurity and general perspective.

Worries about election security

Concern about election security was measured by a question that read:

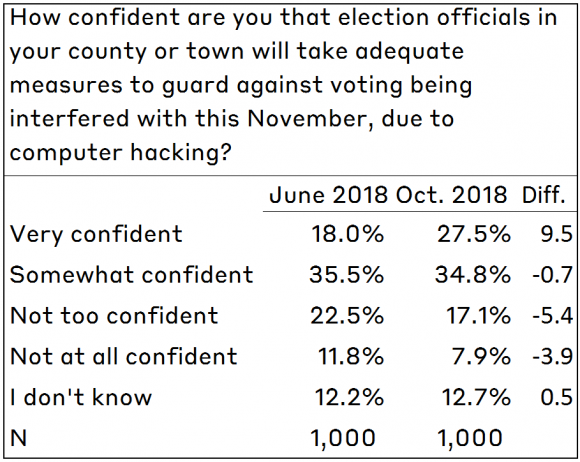
How confident are you that election officials in your county or town will take adequate measures to guard against voting being interfered with this November, due to computer hacking?

Overall, 27.5% responded “very confident” and 34.8% responded “somewhat confident.”  This compares to answers from last June, when the corresponding figures were 18.0% and 35.5%.

On net, the 9.5-point increase in the “very confident” response came in roughly equal portions from the two “not confident” categories.  Of course, because we don’t have a panel of respondents, just two cross-sections, it’s impossible to know how much individual opinion shifted over the five months.  Still, it is clear that the net opinion shift is in a positive direction.

The partisan divide over election security preparedness

Who shifted the most?  Only one demographic category really stands out upon closer inspection when we examine the change:  party.  Although confidence in protecting against election hacking rose among all party groups, the rise in the “very confident” response was greater among Republicans than among Democrats.  Independents also became more confident, but they were still more subdued than partisans.

The interesting case of political interest

One demographic had an interesting effect in the cross-section, but not in the time series:  interest in the news.

In both June and in October, respondents who reported that they followed news and public affairs “most of the time” were more confident that election hacking would be fended off at the local level than those who followed the news less often.

For instance, in June, 70.9% of Republican respondents who reported they followed the new and politics “most of the time” were either “very” or “somewhat” confident that local officials were prepared to fend off hacking in the upcoming election.  Republicans not so engaged in political news were less likely to report confidence, at 58.9%.  The comparable percentages for Independents were 54.5% and 35.2%, and for Democrats they were 53.5% and 49.0%.

In October, high-interest respondents of all strips were more confident than they had been in June.  However, neither the high- nor the low-interest groups grew  more confident faster than the other.  That’s what I mean when I write that the effect is “in the cross-section, but not in the time series.”

(One might read the previous table as suggesting that high- and low-information Democrats became more confident at different rates over the past four months.  However, the number of observations is so small in these subgroups that I wouldn’t make such fine distinctions with these data.)

What do I, and the respondents, mean by “computer hacking?”

Before moving on to voter confidence more generally, I want to address one question that I know some people are asking themselves:  What is meant by “computer hacking” in the upcoming election?  In March, I wrote about what election hacking means to voters.  You can read that post here.

I wrote back then that Republicans were more likely to define the general phrase “election hacking” in terms of domestic actors committing fraud of some sort, while Democrats were more likely to define it in terms of foreigners messing with our elections.

Assuming that this differential framing of the issue remains true today, we can imagine that the more sanguine view about computer security in the upcoming election means different things to the two sets of partisans.  It is likely that Republicans are becoming more convinced that state and local election officials have traditional election administration under control for the upcoming election.  Democrats, on the other hand, have most likely become slightly more convinced that election officials will be effective in fending off foreign intrusions.

Let’s see what they think when the election is over.

Coda:  Voter confidence more generally

The slight improvement in confidence about preparations to defend elections against cyber-attacks is in contrast with the lack of change in attitudes about overall voter confidence.

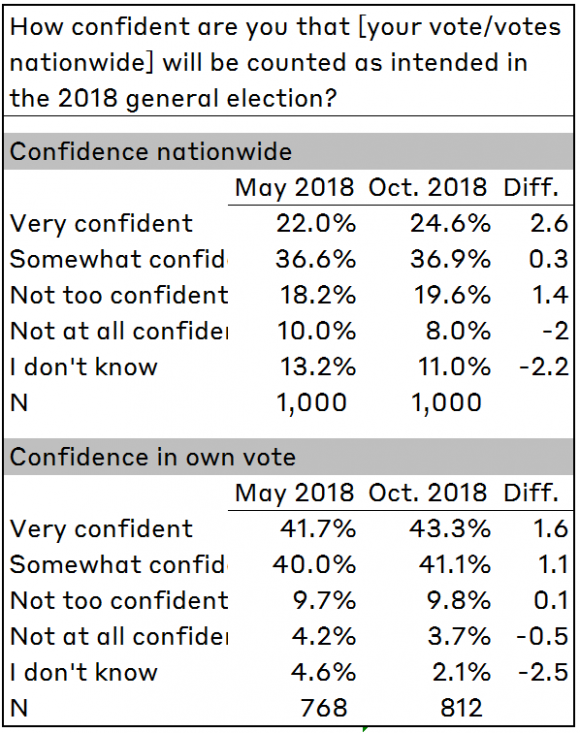
In addition to asking the cyber-preparedness question, I also recently asked respondents my two standard voter confidence questions.  The first, asked of all respondents, was:

How confident are you that votes nationwide will be counted as intended in the 2018 general election?

The second question, asked of respondents who said they planned to vote in November, was:

How confident are you that your vote in the general election will be counted as you intended?

These are commonly asked questions.  Others have asked them recently, such as the NPR/Marist poll in September.  Here, I take advantage of the fact that I regularly ask the question in the same way, using the same method, to see whether there have been any shifts as the election approaches.

There has been virtually no change in overall responses to either question since May, the last time I asked this question.  In May, 58.6% gave either a “very” or “somewhat” confident answer to the nationwide question, compared to 60.5% in October.  The comparable percentages for confidence in one’s own vote were 81.7% and 84.4%.  The changes across the five months are not large enough to conclude that anything has changed.

Drilling down more deeply into partisanship, we also see few changes that distinguish the parties.  Republicans gave more confident responses to both questions, but both parties’ partisans were virtually unchanged since May.

There is now a considerable literature on the tendency of survey respondents to express confidence in the overall quality of the vote count, either in prospect or in retrospect.  The findings I report here, therefore, are not path-breaking.  They do stand in contrast to attitudes about a newly prominent piece of election administration, computer security.  That piece is new to most Americans, and they are still getting their bearings when it comes to assessing the difference between hyped alarm and serious worry in the field.  It will be interesting to see how all this plays out in the next month, and in the weeks to follow.

Doug Chapin would, of course, say it more simpy:  stay tuned.


Voting by mail and ballot completion

Andrew Menger, Bob Stein, and Greg Vonnahme have an interesting paper that is now forthcoming at American Politics Research, “Reducing the Undervote With Vote by Mail.” Here’s the APR version, and here’s a link to the pre-publication (ungated) version.

The key result in their analysis of data from Colorado is that they find a modest increase in ballot completion rates in VBM elections in that state, in particular in higher-profile presidential elections. Here’s their abstract:

We study how ballot completion levels in Colorado responded to the adoption of universal vote by mail elections (VBM). VBM systems are among the most widespread and significant election reforms that states have adopted in modern elections. VBM elections provide voters more time to become informed about ballot choices and opportunities to research their choices at the same time as they fill out their ballots. By creating a more information-rich voting environment, VBM should increase ballot completion, especially among peripheral voters. The empirical results show that VBM elections lead to greater ballot completion, but that this effect is only substantial in presidential elections.

This is certainly a topic that needs further research, in particular, determining how to further increase ballot completion rates in lower-profile and lower-information elections.

Blast from the Past: How Early Voting Can Serve as an Early Warning about Voting Problems.

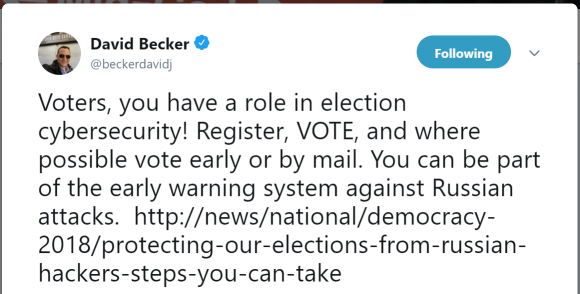
Two of my best friends and closest confidants in this business, Paul Gronke and David Becker, just exchanged tweets about using early and absentee voting as an early warning device.  What this exchange brought to mind was the Florida congressional district 13 race in 2006, which I played a small part in as an expert witness for one of the candidates, Christine Jennings.  (You can see my old expert report here.)

First, the setting:  The 2006 Florida 13th congressional district race was, at the time, the most expensive congressional election in American history.  It pitted Republican Vern Buchanan against the Democrat Christine Jennings.  Buchanan was eventually declared winner by 369 votes, out of over 238,000 cast for the candidates.

What drew this election to national attention was the undervote rate for this race and, in particular, the undervote rate in Sarasota County, where Jennings had her strongest support.  In Sarasota County, 12.9% of the ballots were blank for the 13th CD race.  In the rest of the district, the undervote rate was 2.5%.  In the end, it was estimated that the number of “lost votes” in Sarasota County was between 13,209 and 14,739.  Because the excessive undervotes were in precincts that disproportionately favored Jennings, it was clear that the excess undervotes in Sarasota County caused Buchanan’s victory.

(As an aside, this was my first court case.  The biggest surprise to me, among many, was that the other side of the case — which consolidated the county, ES&S, and Buchanan — pretty much conceded that Buchanan’s victory was due to the undervote problem in Sarasota County.  But, that’s a story for another day.)

Here’s another piece of background, which gets us closer to the Becker/Gronke exchange:  Part of the evidence that there was something wrong with the voting machines, and not just Sarasota County voters choosing to abstain, was that the undervote rate in early voting and on Election Day was much greater than the absentee voting in that county.  This is important because early voting and Election Day voting were conducted on paperless iVotronic machines, whereas absentee voting was conducted on scanned paper.

The absentee undervote rate in Sarasota County was 2.5%, which was close to that of Charlotte County (3.1%), which was also in the district.  The early voting undervote rate was 17.6%, compared to 2.3% in Charlotte; the Election Day undervote rate was 13.9%, compared to Charlotte’s 2.4%.

Here’s the factiod from this case that the Becker/Gronke exchange brought to mind.  Note the difference in the undervote rate in Sarasota County between early voting (17.6%) and Election Day (13.9%).  The Election Day rate wasn’t dramatically lower than the early voting rate, but it was lower, and probably not by chance.

During the early voting period, voters complained to poll workers and the county election office that (1) they hadn’t seen the Jennings/Buchanan race on the computer screen and (2) they had had a hard time getting their vote to register for the correct candidate when they did see the race on the screen.  This led the county to instruct precinct poll workers on Election Day to remind voters of the Jennings/Buchanan race, and to be careful in making their selections on the touchscreen.

Of course, the fact that the undervote rate on Election Day didn’t get back down to the 2%-3% range points out the limitations of such verbal warnings.  And, I know that Jennings supporters believed that the county’s response was inadequate.  But, the big point here is that this is one good example of how early voting can serve as a type of rehearsal for Election Day, and how election officials can diagnose major unanticipated problems with the ballots or equipment.  It’s happened before.

Thus, I agree with David Becker, that early voting can definitely help election officials gain early warning about problems with their equipment, systems, or procedures.  I would amend the point — and I think he would agree — that this is true even if we’re not concerned about cybersecurity.  Preparing for elections requires that millions of small details get done correctly, and early voting can provide confirmation that the preparations are in order.

I don’t know of evidence that absentee voting serves as quite the same type of early-warning system, but it makes intuitive sense, and I would love to hear examples.

Two final cautionary thoughts about the “early voting as early warning idea,” as attractive an idea as it is.  First, I’m not convinced that many, or even any, voters will vote early because they want to help shake-out the system.  Indeed, there’s the possibility that if a voter believes there are vulnerabilities that will only become visible during early voting, but that are likely to be fixed by Election Day, it would drive them to wait until Election Day.  Let other people shake out the system and risk discovering that something needs to be tweaked or fixed.

Second, we always need to be aware of the “Robinson Crusoe fallacy” in thinking about how to respond to risk.  The Robinson Crusoe fallacy, a term coined by game theorist George Tsebelis in a classic political science article, refers to the mistakes one can make when we think we are playing a game against nature, rather than playing a game against a rational opponent.  If the game is against nature, the strategies you choose don’t influence the strategies the opponents choose.  (Think about the decision whether to bring an umbrella with you if there is a possibility of rain.  Despite what my wife and I joke about all the time, bringing the umbrella doesn’t lower the chance of rain.)  If the opponent is rational, your actions will affect the opponent’s actions.  (Tsebellis’s example is the decision to speed when you’re in a hurry and the police might be patrolling.)

A bad guy trying to disrupt the election will probably not want to tip his hand until as late as possible, to have maximal effect. Thus, “early voting as early warning” is probably most effective as a strategy to ensure against major problems on Election Day that occur due to honest mistakes or unanticipated events.

I don’t know if “early voting as early warning”  is the best justification for voting early, but it’s not a bad one, either.  It’s probably best at sussing out mistakes, and probably will be of limited use in uncovering attacks intended to hurt Election Day.

But, that’s OK.  I continue to be convinced that if any voter is going to  run into a roadblock in 2018 in getting her vote counted as intended, it will probably be because of a problem related to good, old-fashioned election administration.  The need to ensure that the blocking-and-tackling of election administration is properly attended to is reason enough for me to learn about the system from early voting.


The Blue Shift Comes to the California Primary

Ned Foley alerted the world to the “blue shift” that has begun to characterize the trends in vote totals after the initial tranche of results are released on election night.    The blue shift is the tendency for presidential vote results to trend in a Democratic direction as the count proceeds from ballots counted on Election Day to ballots counted during the canvass period — both absentee and provisional ballots.

For instance, in 2016, the nationwide election-night returns had Clinton leading Trump 48.14% to 47.12%, or by 1.02 points among the 124.2 million votes accounted for on Election Day.  By the time all the votes were counted in all the states, Clinton ended up leading 48.02% to 45.93%, or 2.09 points, among the 137.1 million votes eventually counted.  The growth in Clinton’s lead was a blue shift of 1.07 points (i.e., 2.09-1.02).

(The election night totals are taken from the New York Times.  The final canvass totals are taken from Dave Leip’s Atlas of U.S. Presidential Elections.)

California is one of the biggest contributors to the nationwide blue shift — although there is a blue shift of some size in most states — because of the large number of provisional and mail ballots in the Golden State.  Although 14.2 million votes were eventually counted in California, only 8.8 million were accounted for on election night.  In the process, Clinton’s lead grew from 61.49%-33.22% to 61.48%-31.49%, for a blue shift of 1.72 points.

It’s not surprising, therefore, that a significant blue shift showed up in California’s recent top-two primary.  Let’s take a look.

The good students working for the MIT Election Data and Science Lab downloaded the election night returns from California and stashed them on our Github depository (where anyone can access them).  This means we can compare the early returns with the final results published by the state, which are available here.

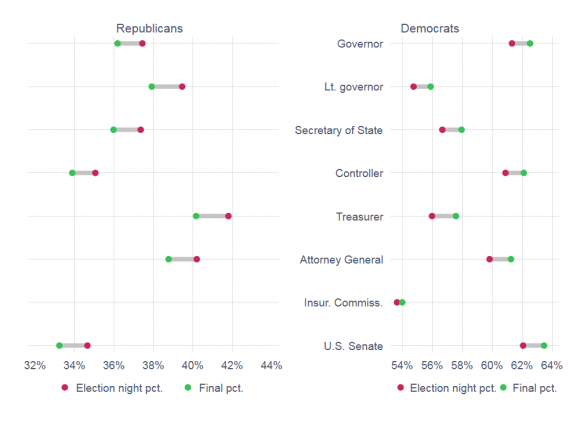
The accompanying graph helps to illustrate the magnitude of the blue shift for each of the statewide races with party labels on the ballot. (Click on the graph to biggify it.) In every race except insurance commissioner, Democratic-affiliated candidates as a whole saw their share of the votes grow by over a point, whereas the Republican-affiliated candidates saw their aggregate vote shares shrink by more than a point.

In the gubernatorial primary, for instance, all the Democratic candidates added together accounted for 61.31% of the primary votes cast, compared to 37.43% for the Republicans, a 23.88-point lead.  In the final count, Democratic candidates received 62.51% of all the votes counted, compared to 36.17% for the Republicans, causing the lead to grow to 26.34 points.  The blue shift in this case was 2.46 points.

It should be noted that the partisan shfits associated with the minor-party and no-party candidates did not go systematically one way or the other.  The only non-major-party candidate who was a factor in any of the primaries was Steve Poizner, the former insurance commissioner, who ran without a party label to get his old job back.  In this one race, the two Democrats in the contest gained very little percentage-wise as the count progressed, and Poizner lost very little.

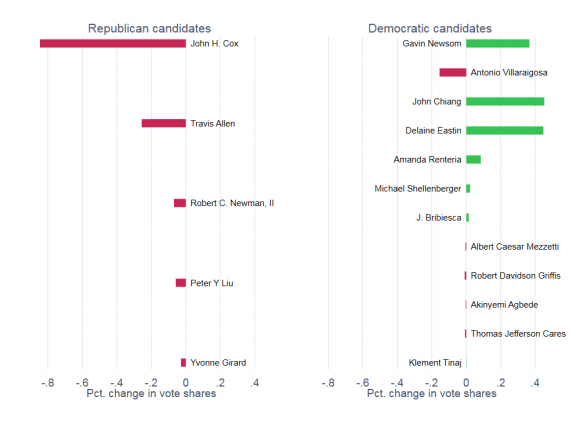
The aggregate blue shifts seen among Democratic and Republican candidates are clear, but do they benefit all candidates equally?  Not really.  To see this, take a look at the change in the vote shares enjoyed by all the Democratic and Republican candidates on the gubernatorial primary. (Click on the graph to enlargify it.)  For both the Republican and Democratic candidates, I have shown the magnitude of the shift in the vote share from election night to the final canvass.  The candidates are displayed with the top election-night vote-getter from each party at the top, and then the other candidates down below in the order of their votes.

All Republicans lost vote share during the canvass, with John Cox, who came in second overall, losing the most — nearly a full point.  Of course, he was far ahead of Travis Allen (and also Antonio Villaraigosa, the second-place Democrat), so he had plenty to lose.  Indeed, since he was the only Republican candidate whose vote share was in the double digits, it’s not surprising that virtually all of the down-side of the blue shift was heaped on him.

Most of the top-ranked Democrats gained vote share as counting progressed.  The exception at the top was Villaraigosa, who lost 0.16 points from election night to the final canvass.  Why he was along among the top vote-getters in losing vote share, I will leave to others to figure out.

California is not alone in having a lot of ballots left to count after election night, but it is by far the largest state with so much to do in the days after an election.  With California a deep blue state, its healthy blue shift has not really been much of a factor in national elections.  This might change in November.  I haven’t yet drilled down to analyze the magnitude of the blue shift in California’s congresisonal primaries, but I suspect the patterns are similar to what we see at the state level.  If so, then a blue shift of a point or two in those elections in November could not only have state significance, but could be a factor as we seek an answer to the question of whether the Democrats will gain control of the U.S. House.

Voters Think about Voting Machines

The annual State Certification Testing of Voting Systems National Conference was recently held in Raleigh, North Carolina.  This is one of my favorite annual meetings, because it brings together state and local officials who are responsible for the care and feeding of voting technologies.  I learn a lot every year.

Check out the program, including slides and other documents, here.

The price of attending is that every participant must give a presentation.  This gave me an opportunity this year to pull together work I have done over the past several years about public opinion related to voting technology and election security.  This is the first in a series of blogs in which I share some of the material I presented in Raleigh.

Today’s post is about attitudes toward voting machines.  The current nationwide attention to election security has led to a renewed interest in voting technologies and to two topics in particular:  (1) the use of computers to cast and count ballots and (2) the age of the equipment and the need to replace machines that were bought in the aftermath of the 2000 election.

Beginning in 2012 I started asking respondents to public opinion surveys what they think about different voting technologies.  Not surprisingly, opinions among the public about voting machines have changed in recent years, particularly as the drumbeat against DREs has grown louder, and as the security of voting technologies has become more salient.

Public opinion in 2012

To see how opinion has changed in the recent past, it is useful to start in 2012, when I first asked a series of questions about voting machines in the Cooperative Congressional Election Study (CCES).

(The CCES is the largest academic study of political opinions conducted every two years before and after the federal election.  One nice thing about the CCES is that it allows researchers to ask their own questions of a representative sample of adults within the context of a larger survey.)

The responses to the questions I asked revealed that DREs were clearly the technology of choice. in 2012

The bottom line was measured by asking respondents which voting technology they would prefer to vote on.  The technologies were defined as follows:

  • Paper ballots scanned and counted by a computer. (Opscans)
  • Electronic voting machines with a touch screen. (DREs)
  • Paper ballots counted by hand. (Paper)

Of the 2,000 respondents, 56% preferred DREs, 25% opscans, 7% paper, and 11% had no opinion. (See the table below.)

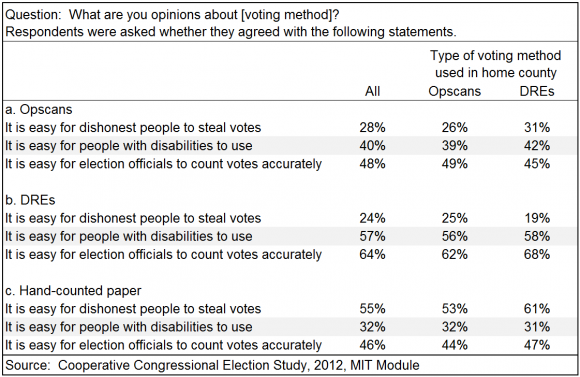
Especially interesting are attitudes of respondents based on the voting equipment used in their home county.  The table above shows how this breaks down.  Respondents from counties that used DREs preferred them over opscans, 74%-13%.  Surprisingly, respondents from opscan counties also preferred DREs, by a comfortable 50%-30% edge.

Lying behind the overall preference for DREs over opscans — and the strong preference for either of these technologies compared to hand-counted paper — was a belief in the functional superiority of DREs, especially to count ballots and for usability.

To probe these deeper attitudes about voting machines, I asked respondents what they thought about the three major types of voting technologies.  In particular, I asked whether the respondent thought it was easy (1) for dishonest people to steal votes, (2) for disabled voters to use, and (3) for election officials to count votes accurately.

As the table below shows, on the whole, DREs won out over opscans — they were virtually tied on the question of vote-stealing, whereas DREs won hands-down on usability and counting accuracy.  Both opscans and DREs won out over hand-counted paper.

Probably the most interesting results come in analyzing respondents based on the type of voting technology used in their communities.  Here, we find surprisingly little difference between users of opscans and DREs.  For instance, 26% of opscan users thought it was easy to steal votes using opscans, compared to 31% of DRE users.  Most importantly, in 2012, even users of opscans believed that DREs were easier to use by voters with disabilities, and were easier for election officials to count votes accurately.

Public opinion today

Opinions have changed since 2012.

In 2016, I had the opportunity to ask the same set of questions in the CCES.  In addition, suspecting that opinions were changing rapidly, I was able to put a couple of questions onto the YouGov Omnibus in the fall of 2017.  Here’s what I’ve found:

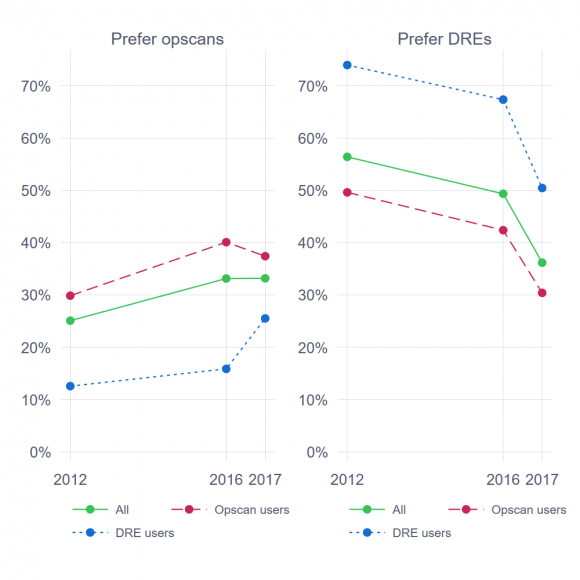
  1. Support for DREs has fallen since 2012 while support for opscans has risen. (See the accompanying figure. Click on it to enbiggen.)  A particularly sharp drop in support for DREs occurred in just one year, from 2016 to 2017.  As of last fall, DREs no longer had a commanding lead over opscans among respondents overall, and opscan users no longer prefer DREs over opscans.


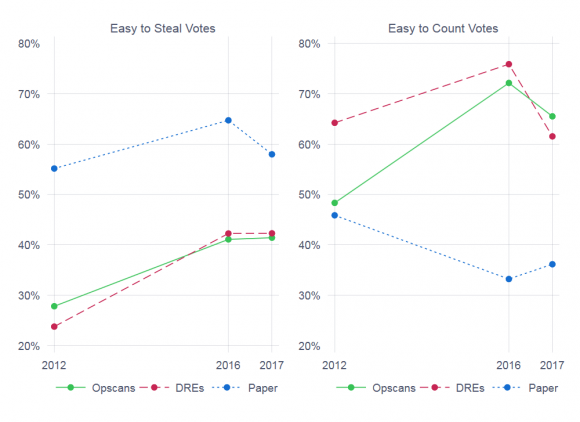
  1. The perceived functional superiority of DREs is disappearing. This is illustrated in the figure below, which shows the percentage of people who believe it is easy to steal votes and to count votes, on opscans, DREs, and hand-counted paper.  (Click on the image to largify it.) There was a significant increase in the belief that it was easy to steal votes on all voting technologies between 2012 and 2016, but the increase was slightly greater for DREs than for opscans.  There was also a significant increase in the belief that it was easy to count votes on both opscans and DREs (but not hand-counted paper) between 2012 and 2016, with some pulling back from those positions in 2017.  Whether we take the 2016 or 2017 numbers, however, it is clear that DREs no longer are the clear winners on the vote-counting dimension.

Thus, as criticism of DREs has grown in public discourse, and computer security has become a more salient issue in election administration, the bloom has come off the DRE rose.  This is good news for those who have long advocated that DREs be abandoned for paper.  There is a caution here, however. Although support for DREs has declined significantly over the past five years, DRE users still believe it is the superior technology compared to opscans.  This suggests that as election administrators transition away from DREs over the next several years, they may find themselves needing to deal with local public opinion that may be skeptical of the move, and regard opscans as an inferior technology.

Research on instant-runoff and ranked-choice elections

Given the interest in Maine’s ranked-choice election tomorrow, I thought that this recent paper with Ines Levin and Thad Hall might be of interest. The paper was recently published in American Politics Research, “Low-information voting: Evidence from instant-runoff elections.” . Here’s the paper’s abstract:

How do voters make decisions in low-information contests? Although some research has looked at low-information voter decision making, scant research has focused on data from actual ballots cast in low-information elections. We focus on three 2008 Pierce County (Washington) Instant-Runoff Voting (IRV) elections. Using individual-level ballot image data, we evaluate the structure of individual rankings for specific contests to determine whether partisan cues underlying partisan rankings are correlated with choices made in nonpartisan races. This is the first time that individual-level data from real elections have been used to evaluate the role of partisan cues in nonpartisan races. We find that, in partisan contests, voters make avid use of partisan cues in constructing their preference rankings, rank-ordering candidates based on the correspondence between voters’ own partisan preferences and candidates’ reported partisan affiliation. However, in nonpartisan contests where candidates have no explicit partisan affiliation, voters rely on cues other than partisanship to develop complete candidate rankings.

There’s a good review of the literature on voting behavior in ranked-choice or instant-runoff elections in the paper, for folks interested in learning more about what research has been done so far on this topic.

Our Orange County project

It’s been a busy few weeks here in California for election geeks, specifically for our research group at Caltech. We’ve launched a pilot test of an election integrity project, in collaboration with Orange County, where we have been using the recent primary here in California to test various methodologies for helping evaluate election administration.

At this point, our goal is to work closely with the Orange County Registrar of Voters to understand what evaluative tools they believe are most helpful to them, and to also determine what sorts of data we can readily obtain during the period immediately before and after a major statewide election.

We recently launched a website that describes the project, and where we are building a dashboard that summarizes the various research products as we produce them.

The website is Monitoring the Election, and if you navigate there you’ll see descriptions of the goals of this project, and some of the preliminary analytics we have produced regarding the June 5, 2018 primary in Orange County. At present, the dashboard has a visualization of the Twitter data we are collecting, an analysis of vote by mail ballot mailing and return, and our observations of early voting in Orange County. In the next day or two we will add some first-pass post-election forensics, a preliminary report on our election day observations, and an observation report regarding the risk-limiting audit that OCRV will conduct early this week.

Again, the project is in pilot phase. We will be evaluating these various analytic tools over the summer, and we will determine which we can produce quickly for the November 2018 general election in Orange County.

Stay tuned!

Tackling Long Election Lines in Theory and Practice

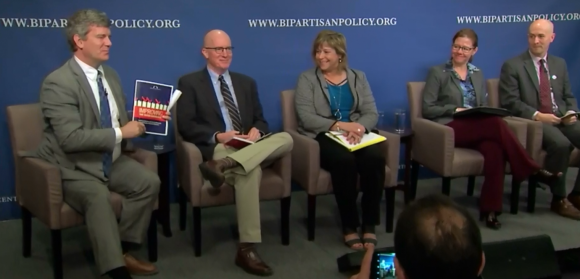
Last week the Bipartisan Policy Center (BPC) hosted an event to celebrate the four years since the Presidential Commission on Election Administration (PCEA) issued its report with recommendations to improve the experience of American voters.  (You can view videos of the event’s sessions here.)  The two major issues addressed in panels were long lines at the polls and the modernization of voter registration rolls—two of the primary concerns outlined in the PCEA’s report.

On the issue of long lines, the event provided the opportunity to release a report on Improving the Voter Experience, which provided results about a major project the BPC and the Caltech/MIT Voting Technology Project (VTP) collaborated on to monitor polling place wait times in 2016. That report is based largely on data provided by 88 counties from 11 states that participated in the line-length program.  These counties represented 15.6 million registered voters, 11.1 votes cast (8% of nationwide turnout), and 4,006 precincts.  This is the largest study ever conducted of how long voters wait to cast their ballots.

The report is full of facts that came from an analysis of all the data that was gathered by the 88 jurisdictions, and I encourage you to read the full document.  Here are some of the most important findings in brief:

  1. Most voters wait very little, if at all, to vote. Consistent with past survey research that’s been done on the subject, the modal (most-common) line length recorded in the project was zero.  Just over 2/3 of precincts had average wait times of less than 10 minutes.
  2. The longest lines, and wait times, are first thing in the morning. Almost every precinct in the study had people lined up waiting to vote when the polls opened on Election Day.  (As an aside, the fact that virtually every polling place has a line when the polls open suggests how easy it is for a news photographer to get a picture of a long line early on Election Day, and how meaningless these pictures are as evidence of problems.)  The average precinct had between 30 and 45 minutes’ worth of voters at the door when polls opened.  This is the most significant source of wait times, both when things go well and when things go poorly.  While we saw evidence of surges in turnout at other times of the day, such as around noon and after work, those surges were minor ripples compared to the tsunami of voters at the start of the day.
  3. If long lines are resolved after two hours, a precinct is highly unlikely to experience long waits the rest of the day. If the morning rush isn’t cleared up in three hours, count on lines throughout the day.  The findings of the study revealed the critical nature of managing wait times at the opening of the polls.  The line at the start of the day isn’t an issue so much as the line at the end of the first hour.  If a polling station’s line hasn’t been cut (at least) in half after the first hour, it will be difficult to make progress on wait times for the rest of the day.  I have talked to election officials who, after seeing the data from the project, have said they will use new resources they get for staffing to increase the number of staff who work in the morning.  (These are officials who live in states where poll workers are allowed to work in shifts.)

The report also brings to mind several points about process.

  1. We can improve election administration performance if we put our minds to it. President Obama was inspired to create the PCEA because of press reports of long waits to vote — some up to six hours long — in 2012.  In the PCEA’s report, the commission set a benchmark that no voter should have to wait more than 30 minutes to cast a ballot.  The survey research reveals that great progress was made toward hitting that benchmark in 2016.  According to responses to the Survey of the Performance of American Elections, in 2012, 13% of in-person voters waited more than 30 minutes to vote.  In 2016, that was reduced to 9%.  The most dramatic improvements occurred in the states that had the longest wait times in 2012.   The percentage of voters who waited more than 30 minutes fell from 39% to 4% in Florida, from 39% to 17% in D.C., and from 28% to 10% in Virginia.  We still have more work to do to make the commission’s benchmark a reality:  more than 5% of voters waited over 30 minutes in 25 states in 2016.  Still, the improvement in 2016 in the most troubling states reveals that election officials can make great strides in improving polling place management if they put their minds to it.  (As an aside, I think the wait-time success story bodes well for handling the current cybersecurity concerns, but only if officials put the same effort into addressing the issue.)
  2. If you don’t measure it, you can’t manage it. A barrier to managing polling place wait times before 2012 was the lack of detailed knowledge about how long voters waited to cast a ballot.  Survey research was valuable to help give the public and policymakers an idea about where the longest wait times were happening, but it didn’t provide “news you can use” to improve wait times.  After all, if we learn that wait times are much shorter in Vermont than in Florida, it doesn’t help if I tell you to move to Vermont if you want to vote more quickly in the future.  To help election officials pinpoint precisely where and when long wait times emerge, they need to measure wait times directly.  This means counting the number of voters waiting in line on a regular basis, gathering data about how many people arrived to vote during a given time, and then using Little’s Law to calculate what the wait times were.
  3. You can measure it, and you can manage it. The wait time project highlighted in the Improving Voter Experience report offers a simple, high-impact way for election officials to gather the data they need to find out when and where they long wait times are happening.  Election officials can go to this webpage and answer the call to participate in the program for 2018.

Finally, this report, which highlights data-gathering, reminds us that there are tools available to help local officials plan ahead of time to make sure they have enough staff, poll books, voting booths, etc. to handle the number of voters who walk through the doors.  The VTP continues to host, at the PCEA’s invitation, a set of online tools to aid in that management.  The Center for Technology and Civic Life’s Election Toolkit also contains helpful tools.  For those interested in a deeper dive into the science behind line management as applied to elections, I wrote the report Managing Polling Place Resources a couple of years ago to help translate queuing theory to the polling place.