Author Archives: cstewart

Early Voting Trends: Surge or Return to Normal?

Charles Stewart III, MIT

[Note: This posting was written on the eve of Election Day, based on statistics reported Monday morning.]

We’ve come to the end of the time in the election cycle when the politically engaged, tired of obsessively going to FiveThirtyEight or the Silver Bulletin, look to other tea leaves. A few of you may still wonder what the mail and early in-person voting trends portend for the results tonight. Here are some thoughts on that.

(Before proceeding, a little nomenclature: Some people—journalists, election officials, and just normal folks—mean different things when they say “early voting.” When some refer to early voting, they mean any votes cast before Election Day, whether cast in person or at home. Others only mean votes cast in person. To try to avoid that confusion here, I will refer to the in-person version as “early voting,” and combined early in-person and by-mail voting as “advance voting.” I will refer to ballots cast after being mailed to a voter as “by-mail ballots.” )

My simple answer to the “what does this all mean” question is that things seem to be returning to normal in two related ways. First, voters are mostly returning to pre-pandemic voting patterns (with important exceptions). Second, campaigns are recognizing they need all the turnout weapons in their arsenal to win.

2024 represents the return to a long-term trend of increased advance voting

First, the patterns of the use of vote modes. As illustrated in the graph below, prior to 2020, the fraction of people voting on Election Day had been declining linearly for a quarter century, replaced in equal measure by people voting by mail and voting early. This pattern was interrupted by the pandemic, which shifted large numbers of voters out of Election Day voting booths into other modes, especially voting by mail. In 2022, mode usage either returned to the pre-pandemic trend or at least was much closer to the trend. (By-mail voting was about 5 points above trend in 2022, while early voting would have been right on trend if we account for the obvious seesaw pattern in the data between on- and off-year elections.)

Vote Mode in Federal Elections, 1996-2024

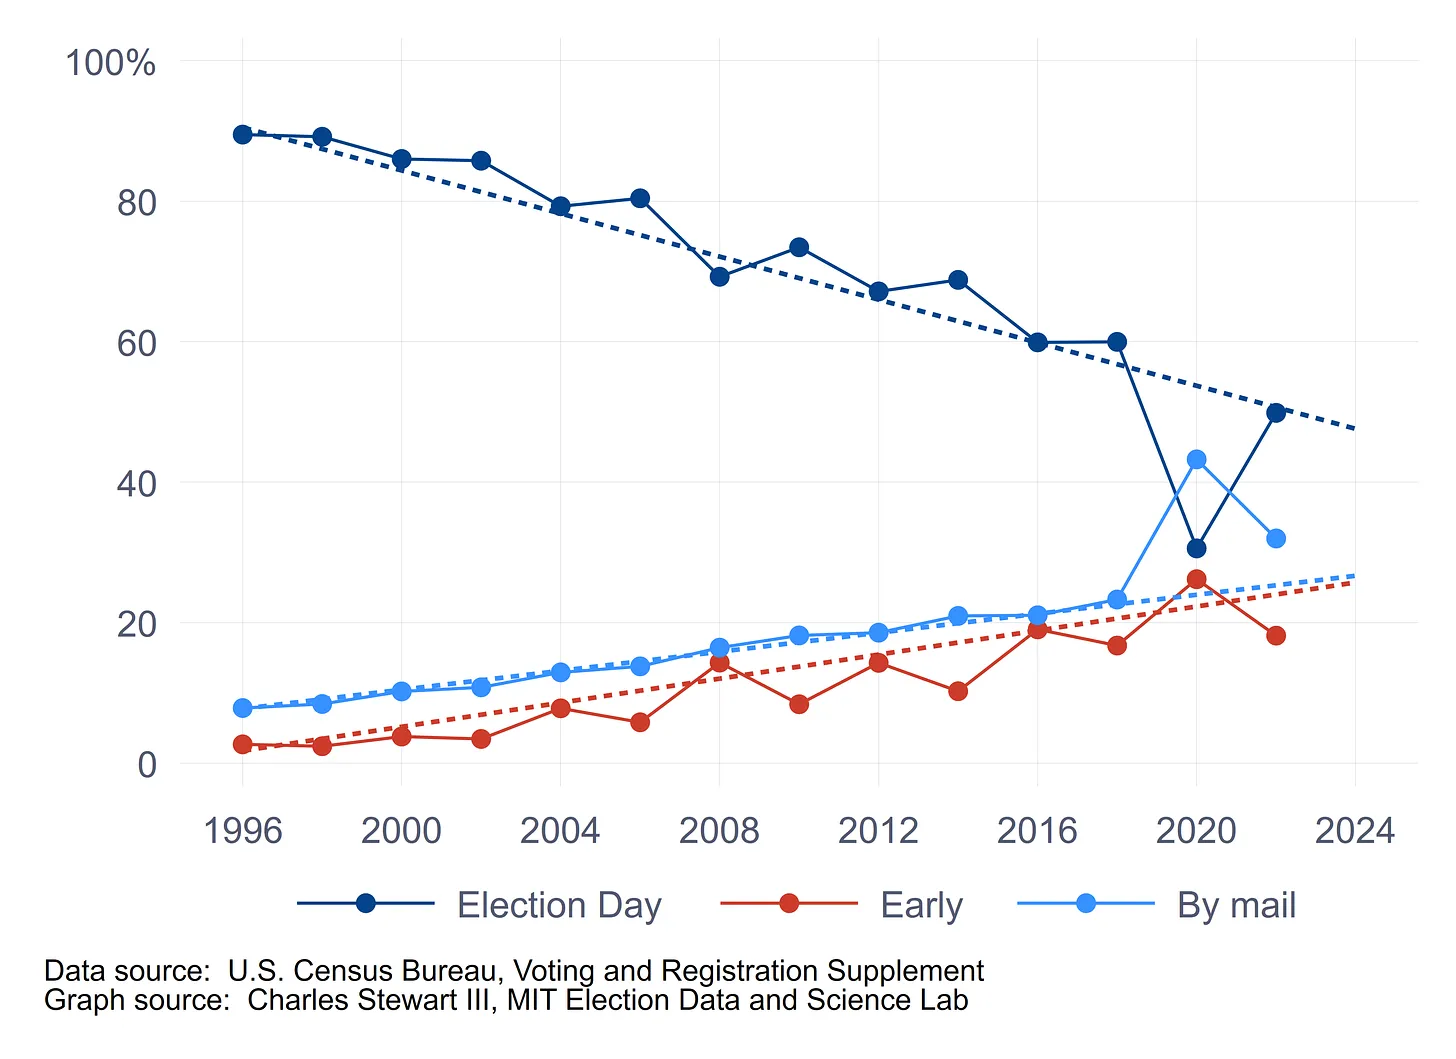
The dashed lines in this graph are based on simple linear trends in the use of the three voting modes from 1996 to 2018, estimated using linear regression. Although the trends are based on the data from 1996 to 2018, they have been extended to 2024 to see how the pandemic and the recovery from it affected the long-term trends.

Not surprisingly, in 2020, Election Day voting was significantly below trend, while by-mail voting significantly exceeded it. Early voting was roughly what we would have expected without the pandemic. In 2022, Election Day voting returned us to where the long-term trend predicted; early voting was slightly below the trend, and mail voting slightly exceeded it.

The ends of the trend lines provide the predictions of mode usage in 2024 if we just allow the pre-pandemic trends to continue. This is obviously a mindless prediction, if you want to call out-of-sample prediction using regression mindless, but it does help define the expectations ballpark for this year.

Keep in mind that most states made changes to their laws that either facilitated or reined in advance voting before 2022, so state-law-induced factors weighing on 2024 are already baked into the trends for the most part. The decision by Republican strategists to validate advance voting in 2024 may have played a role in the growth of voting in the pre-Election Day period this year. Still, the shift could also have reflected voters deciding how they prefer to vote, given what’s going on in their lives.

As voters shift to early voting in 2024, they are also shifting away from by-mail voting, compared to 2020. Based on Michael McDonald’s indispensable early voting website and some back-of-the-envelop calculations of my own, it appears we are on target for over 40 million early votes in 2024, up from 36 million in 2020, and 48 million by-mail votes, down from 66 million in 2024. Both of these numbers are right where the trend lines in the above graph would predict if turnout ends up at around 160 million. This also means that 2024 may be the second election in a row in which most votes are cast before Election Day. (It will at least be close.)

The closing partisan gap

Of some note, in 2024, there has been a shift in thinking among Republicans about the value of voting by mail. Certainly, the GOP and its candidates are giving mixed signals about advance voting. Still, just as Donald Trump’s attack on by-mail voting helped create a partisan chasm in voting by mail in 2020, his campaign’s change of attitude in 2024 has to make a difference, too.

For the decade before 2020, Democrats were only slightly more likely to vote by mail than Republicans, and almost all that difference was accounted for by the greater availability of no-excuse absentee voting and universal vote-by-mail in predominantly Democratic states. As the graph below shows, in 2020, a gap of nearly 30 points opened up between Democrats and Republicans in usage rates of by-mail ballots. That gap was then cut down to 12 points in the 2022 midterm.

Partisan Gap in Vote Mode

It appears that the gap has been diminished even further in 2024, although we cannot be 100% certain about how much. The party statistics reported by the states and communicated by Michael McDonald reflect the party registration of those returning ballots in states that record party registration. We won’t know for sure about the size of the partisan gap until surveys that track such things begin to report their results.

An increase in Republican by-mail voting in 2024 could just represent the demise of the stigma associated with mail voting. A decline in the use of by-mail voting by Democrats could also just represent a weakening of the sense that voting by mail is part of one’s Democratic duty.

Of course, it could be that a decline in advance voting by Democrats in comparison to Republicans could reflect a better mobilization effort by the Trump campaign and a lagging effort by Republicans. I’m doubting it, though. If I were a betting person, my money would be on voters and campaigns getting closer to a pre-pandemic normal. By Tuesday night, we’ll see if I’m right.

Blue Shift, Red Shift?

Charles Stewart III, MIT

The 2020 election taught America what most political pros already knew: votes aren’t counted immediately, and there are partisan patterns in how election results unfold. America also learned new terms for these partisan patterns: the blue shift (if you’re academically oriented) and the red mirage (if you read Axios).

As Election Day approaches, it’s time to dust off what we learned about the blue shift/red mirage in 2020 and apply it to 2024.

Vote share trends in 2020

To jump to the chase, the following two graphs summarize partisan patterns to the reported vote in each state in 2020. Let’s start there.

The first graph shows Biden’s two-party vote share from the close of polls in every state through midnight on Wednesday following Election Day. (The subgraphs are admittedly tiny, so click on this link and zoom in if you’d like to take a closer look.) The blue circles show each vote report during this period. The gray line shows the percentage of the vote reported and when it was reported.

Two-party vote share for Biden from the closing of polls until midnight Wednesday following Election Day.

For an election data nerd like me, I can spend hours studying this graph, but a couple of things stand out. First, although the phenomenon is called the blue shift, suggesting a steady evolution of vote share from a Trump majority to a Biden majority, in fact, for many states, the pattern was nonlinear. Take Georgia, for example. The very first vote report, with 4% of the eventual vote reported, showed Biden with 55% of the two-party vote. However, his share quickly dropped until it bottomed out at 42% just an hour and a half later. At that point, Biden’s share of the reported vote started a slow and steady rise. (He did not overtake Trump until Thursday, which is not on these charts.) Pennsylvania showed a similar pattern that was even more exaggerated.

Second, most states actually saw a red shift during this period. Setting aside the earliest vote reports (which I define as all reports before 10% of all ballots were reported), only 13 states saw Biden’s vote share grow during this time.

A broader view of the vote share shifts can be shown if we plot the two-party vote share for Biden against the percentage of all votes reported in a state. Those plots are shown in the next graph. (Click here if you want a bigger graph you can zoom in on.)

Plots of the Biden two-party vote share against the percentage of votes reported show that in most states, there wasn’t a steady blue shift in 2020.

This graph perhaps provides a clearer view of the two patterns I discussed above when I confined myself to the first day and a half after the polls closed. Most states—31—saw Biden’s reported vote share start above his final vote in the state before dipping below his final share. Georgia and Pennsylvania again provide good examples of this.

These graphs help make the point that vote reports did not all follow the same path in 2020. They also show that the idea of the blue shift is more complicated than often understood. What most people are thinking of when they say that Georgia and Pennsylvania had blue shifts is what they experienced toward the end of the vote-counting period, when the nation was on tenterhooks about the outcome of the election. And what they fail to appreciate is that many states, in addition to Arizona, also had pronounced red shifts late into the count.

Some thoughts for 2024

These are the patterns from 2020. What do they tell us for 2024?

For most states, we can probably expect similar patterns. The patterns observed in the graphs above reflect the results of an interaction of state election laws, local practices, and unique urban/rural differences. Most of these things haven’t changed much in most states.

However, they have changed in some states. For instance, Georgia now requires its counties to report its early in-person and mail votes within an hour of polls closing. This could easily put 75% to 80% of all the state’s votes out at once, leaving little room for any movement afterward. It will also reduce, but not eliminate, the pattern of rural counties reporting first and urban counties coming in later. Similarly, Michigan’s allowing for pre-processing of mail ballots should dampen any blue or red shift and shorten the period over which it occurs.

Finally, reports of early in-person and mail voting suggest that Republicans are more active in turning out before Election Day than in 2020. In those states where the blue/red shift is caused by differentials in how the two parties’ supporters use different voting modes, differences in vote reports over time will be muted.

Looking back to 2020 for a Guide to How Fast the Votes Will Be Reported in 2024

Charles Stewart, MIT

As we approach Election Day, I’ve been getting lots of questions about what to expect as the election results are reported. Will we be seeing the same patterns as in 2020? Will Pennsylvania take forever to count its votes because of limitations prohibitions on pre-processing? Will Arizona slow-walk from a comfortable Democratic lead to a nail-biter?

The simple answer to all these questions is that we’re likely to see similar patterns to 2020 and 2022, although some states will be more similar than others. The reason for the similarities is simple: for many states, the rules governing the counting and reporting of votes will be quite similar to 2020.

I can hear you saying, “Wait a minute. Didn’t 2020 see a surge of voting by mail that won’t repeat in 2024? Surely, that will affect what the vote reports look like.” In some states, that will be undoubtedly true. However, for most states, the laws in 2020 that sped up the counting of mail ballots, notably allowing for mail ballot pre-processing, will remain in place. To the degree that mail ballots may slow down the count, the presence of fewer mail ballots in 2024 may speed things up a bit. In addition, in many states, the mail ballots are the first to be reported, not the last, because they’re available to be tallied centrally either during Election Day or as soon as the polls close.

The pace of counting in 2020

In 2020, the team at the MIT Election Data and Science Lab (MEDSL) scraped the election results reported by the New York Times, which, in turn, were provided by Edison Research. This gives us a picture of how quickly states reported results in 2020 as a baseline for what to expect in 2024.

Also in 2020, MEDSL published a report that analyzed these data. One of the analyses we performed was on the velocity of vote reporting, measured in several ways. One simple way to illustrate cross-state differences was to show the percentage of votes reported 4, 8, 24, and 48 hours after polls closed in the state. A figure showing those numbers appears below, with the fastest-reporting state after four hours (Iowa) at the bottom and the slowest state (D.C.—I’ll call it a state for these purposes) at the top.

This figure helps to illustrate the frustration many voters and politicians felt on election night and beyond. While some states could get almost all their votes reported by the wee hours of Wednesday morning, only about half had reported 90% of their votes eight hours after polls closed. Among the seven battleground states this year, North Carolina was, by far, the fastest out of the shoot, trailed a long distance by Wisconsin, which was about in the middle of the pack. Michigan and Pennsylvania were among the ten slowest.

I invite the reader to study this figure (or look at the report) because it reveals all sorts of nuances about how states report their vote totals. Georgia, for instance, was a relatively slow-reporting state after four hours but quickly caught up after midnight of election night. After 48 hours, it was in the top half of states in terms of votes reported. On the other hand, Alaska reported about half its votes by Wednesday morning and then stopped for several days owing to the challenges in aggregating vote totals in that far-flung and road-poor state.

The role of pre-processing

One detail about vote reporting not evidenced in this figure is what the pre-processing of mail ballots does to the speed of voting counting. In the statistical analysis performed in the MEDSL report, the failure to pre-process did slow down the count, on average, but by a small amount. Within four hours of the polls closing, the average state with no pre-processing had reported 63% of its votes, compared to 78% that didn’t restrict pre-processing. At the twenty-four-hour point, the gap between states had essentially disappeared.

In a later academic paper written by me and two MEDSL colleagues, we also found that states with more mail ballots reported at a slower pace. However, the effect of mail-ballot load also declined over time.

Three thoughts for 2024

What does all this mean for 2024? I would highlight three things.

First, pre-processing make a difference, although it makes the biggest difference in the early hours of counting. In 2020, seventeen states prohibited processing of mail ballots before Election Day. In 2024, that number declined to seven. Unfortunately, three are battleground states: New Hampshire, Pennsylvania, and Wisconsin. (Michigan will allow pre-processing in 2024.)

Second, there will be fewer mail ballots in 2024 than in 2020 to be processed on Election Day in these states. At this point before Election Day in 2020, nearly 3 million mail ballots had been sent out in Pennsylvania; as of today, just over 2 million have been sent out for 2024. In Wisconsin, nearly 1.5 million mail ballots had been issued a week before the 2020 election; this year, the number is about 600,000. Thus, even though there will be a lot of mail ballots to process on Election Day, that number will be significantly less than in 2020.

Third, perceptions of vote-reporting speed in 2020 were heavily influenced by the closeness of the count. Georgia, for instance, got a reputation as a slow-counting state even though it was in the middle of the pack after midnight of election night. The long wait until Thursday for Georgia to be “called” for Biden wasn’t because Georgia was slow, but because of a small number of ballots—such as straggling UOCAVA ballots, provisional ballots, and damaged ballots—that needed to be processed before the count was all finished.

There are other things to say about the speed of vote reporting, especially about reporting in non-battleground states, but I will leave that for another time.

One last thing

I will end with this, however. It is important to remember that the reports of votes on election night are just that, reports. Once the initial unofficial reports are issued, localities and states begin the canvass, which confirms the results, resolves discrepancies, and moves toward official results. It is important to get the results reported quickly, but it is even more important for them to be accurate. In the days following the election, I hope the public will watch the canvassing process carefully, but also give election officials the room they need to make sure the results are correct.

What’s Michigan to Expect with Early Voting?

Charles Stewart III

The Healthy Elections Project has been running a series of surveys in a half dozen battleground states, asking how voters intend to cast their ballots.  I have previously published thoughts on Arizona, Florida, North Carolina, Pennsylvania, and Wisconsin, with a bonus posting about Georgia (where we are not surveying, ourselves.)  This brief note focuses on Michigan.

First, about the intentions themselves.  The table below shows that there was very little movement in reported intentions across the four waves of the surveys.  An ANOVA test fails to reject the null hypothesis that the four waves are drawn from independent samples, so I proceed using results from the pooled survey, discarding the “don’t knows.”

Vote mode intention among likely voters, including don’t knows
Date

Election Day

Early Mail Don’t know

N

Sept. 4 – Sept. 11

44.0%

7.2% 45.1% 3.8%

484

Sept. 16 – Sept. 25

40.5%

4.3% 49.4% 5.9%

490

Sept. 30 – Oct. 9

37.2%

4.7% 55.6% 2.5%

484

Oct. 14 – Oct. 21

39.8%

10.5% 48.6% 1.0%

491

Total

40.4%

6.7% 49.7% 3.3%

1,949


Vote mode intention among likely voters, excluding don’t knows
Date

Election Day

Early Mail

N

Sept. 4 – Sept. 11

45.7%

7.5% 46.8%

465

Sept. 16 – Sept. 25

43.0%

4.5% 52.5%

462

Sept. 30 – Oct. 9

38.2%

4.8% 57.0%

472

Oct. 14 – Oct. 21

40.2%

10.7% 49.1%

486

Total

41.8%

6.9%

51.4%

1,885

(By the way, the overall 95% confidence interval for all four waves combined is around +/- 2.2 points.  For any one wave, it’s around 4.4 points.)

Second, to convert these expectations to raw numbers, we need an estimate of turnout. In most of the other memos, I used a couple of ad hoc methods.  Since then, I have come across the state-level turnout estimates that are produced as a byproduct of the FiveThirtyEight presidential election forecasting model, and so I’ll use those instead.  For Michigan, the low and high estimates are 4.8 million and 6.2 million, respectively, which is what I’ll use here.  However, turnout in 2016 was 4.9 million, and thus I’m certain that the low estimate is too low.

Third, here is what the combination of numbers above imply for the final distribution of votes in Michigan, by mode:

Vote mode, combining four waves of survey
Assumed turnout

Election Day

Early

Mail

4.8 million

2.712M

125k

1.963M

6.2 million

3.503M

161k

2.536M

Fourth, a final calculation needs to be made, if we want to estimate the number of mail ballots that will be requested, since not all mail ballots are returned.  For the states that make their absentee ballot files available, it appears that in 2016, around 85% of requested mail ballots were returned.  If that return rate holds for Michigan, then it should expect between 2.3 million and 3.0 million requests.

There is one data issue that needs to be brought up here.  Michigan does not have a full-bore early voting program.  Rather, it allows in-person absentee voting, but it does not keep track of this separately.  For that reason, and because so few survey respondents indicated they planned to vote in-person before Election Day, I will proceed by considering only mail balloting.

The other data issue is that Michigan, unlike most of the other battleground states, does not provide an easily accessible absentee file to the public, nor even a daily report about these statistics.  For that reason, I’m relying here on Michael McDonald’s irreplaceable reports on his U.S. Elections Project website for these statistics.

As of yesterday, the U.S. Elections Project reports that 3,109,105 ballots had been requested and 2,255,280 mail ballots had been returned.  The deadline for requesting mail ballots is this Friday, although the state (really, the world) has been encouraging voters to request their mail ballots as soon as possible.  Therefore, it seems highly unlikely that anything more than 3.2 million ballots will be requested.

On the returns side, the past week has seen about 66,000 ballots returned per day.  This should pick up in the final days leading up to Election Day.  Nonetheless, at this pace, and with the deadline for receipt on Election Day.  That would yield another 462,000 ballots, or 2.7 million, total.

The following graph summarizes the important calculations.

As for Election Day, this is where the turnout estimate really matters.  If we believe the low-end turnout projections of 4.8 million and that 2.7 million mail ballots returned, that leaves 2.1 million to vote on Election Day.  If the high-end projection of 6.2 is correct, then Michigan would be at 3.5 million on Election Day. If I had to choose, I’d go with the higher estimate.

What’s Pennsylvania to Expect with Early Voting?

Charles Stewart III


The Healthy Elections Project has been running a series of surveys in a half dozen battleground states, asking how voters intend to cast their ballots.  I have previously published thoughts on Arizona, Florida, North Carolina and Wisconsin, with a bonus posting about Georgia (where we are not surveying, ourselves.)  This brief note focuses on Pennsylvania

First, as to the intentions themselves.  The table below shows that there was very little movement in reported intentions across the four waves of the surveys.  An ANOVA test fails to reject the null hypothesis that the four waves are drawn from separate samples, so I proceed using results from the pooled survey, discarding the “don’t knows.”

Vote mode intention among likely voters, including don’t knows

Date

Election Day

Early

Mail

Don’t know

N

Sept. 4 – Sept. 11

53.5%

2.6%

39.1%

4.8%

489

Sept. 16 – Sept. 25

56.2%

2.2%

39.3%

2.2%

484

Sept. 30 – Oct. 9

56.8%

1.9%

38.2%

3.1%

492

Oct. 14 – Oct. 21

51.9%

3.5%

41.7%

3.0%

491

Total

54.6%

2.6%

39.6%

3.3%

1,957


Vote mode intention among likely voters, excluding don’t knows

Date

Election Day

Early

Mail

N

Sept. 4 – Sept. 11

56.2%

2.8%

41.0%

465

Sept. 16 – Sept. 25

57.5%

2.3%

40.2%

473

Sept. 30 – Oct. 9

58.6%

2.0%

39.4%

477

Oct. 14 – Oct. 21

53.5%

3.6%

43.0%

476

Total

56.5%

2.6%

40.9%

1,892

(By the way, the overall 95% confidence interval for all four waves combined is around +/- 2.2 points.  For any one wave, it’s around 4.4 points.)

Second, to convert these expectations to raw numbers, we need an estimate of turnout. In most of the other memos, I used a couple of ad hoc methods.  Since then, I have come across the state-level turnout estimates that are produced as a byproduct of the FiveThirtyEight presidential election forecasting model, and so I’ll use those instead.  For Pennsylvania, the low and high estimates are 6.0 million and 7.7 million, respectively, which is what I’ll use here.  However, turnout in 2016 was 6.2 million, and thus I’m certain that the low estimate is too low.

Third, here is what the combination of numbers above imply for the final distribution of votes in Pennsylvania, by mode:


Vote mode, combining four waves of survey

Assumed turnout

Election Day

Early

Mail

6.0 million

3.390M

156k

2.454M

7.7 million

4.351M

200k

3.149M

Fourth, a final calculation needs to be made, if we want to estimate the number of mail ballots that will be requested, since not all mail ballots are returned.  For the states that make their absentee ballot files available, it appears that in 2016, around 85% of requested mail ballots were returned.  If that return rate holds for Pennsylvania, then it should expect between 2.9 million and 3.7 million requested ballots.

There is one data issue that needs to be brought up here.  Pennsylvania does not have a full-bore early voting program.  Rather, it allows in-person mail voting, which some cities, notably Philadelphia, have promoted.  The Pennsylvania voter file does not have a separate code for in-person absentee ballots, and the conventional way to figure out who was voting in person yielded an implausible number of early in-person voters.  (The standard way is to select records in which the request for the ballot, its issuance, and return all share the same date.)  Therefore, I am assuming that the absentee ballot file does not record in-person absentee voters, although I could be wrong about that.

As of yesterday, 3,058,367 ballots had been requested and 1,850,393 returned a mail ballot.  Today was the deadline for requesting mail ballots, which means that the number of mail ballots requested will likely hit the low end of the estimates, at around 3.1 million.  For the past week, Pennsylvania has been averaging 95,000 returned ballots each day.  Leaving aside the ballots that will arrive after Election Day, if the state keeps receiving ballots at last week’s page, it will eventually have 2.5 million mail ballots, which is also on the low side of the estimates.

The following graph summarizes the important calculations.

As for Election Day, this is where the turnout estimate really matters.  If we think that 2.5 million mail ballots (and a small number of early votes) will come in before Election Day, then if turnout is at the low end of 6.0 million, that leaves 3.5 million to vote on Election Day.  If turnout is at the upper range of 7.7 million, then Election Day turnout would have to be 5.2 million.  This is a considerable range.  My own hunch is that turnout will hit the upper range, so Pennsylvania’s election officials would be well served by planning for this larger number. Whether this is necessary, or an over-reaction, will only be known on Election Day.

What’s Arizona to Expect with Early Voting?

Charles Stewart III

One week to go.

The Healthy Elections Project has been running a series of surveys in a half dozen battleground states, asking how voters intend to cast their ballots.  I have previously published thoughts on Florida, North Carolina and Wisconsin, with a bonus posting about Georgia (where we are not surveying, ourselves.)  This brief note focuses on Arizona.

First, as to the intentions themselves.  The table below shows that there was very little movement in reported intentions across the first three waves of the surveys, but in the last one, there is a move away from Election Day voting, in favor of voting by mail.  For that reason, I’m going to focus this analysis just on the last wave of the survey.

Vote mode intention among likely voters, including don’t knows

Date Election Day Early Mail Don’t know N
Sept. 4 – Sept. 11 24.3% 7.8% 66.1% 1.8% 493
Sept. 16 – Sept. 25 28.7% 10.6% 57.9% 2.9% 477
Sept. 30 – Oct. 9 27.1% 11.4% 58.1% 3.4% 496
Oct. 14 – Oct. 21 16.6% 12.6% 68.8% 2.0% 495

Total

24.1%

10.6%

62.8%

2.5%

1,962


Vote mode intention among likely voters, excluding don’t knows

Date

Election Day

Early

Mail

N

Sept. 4 – Sept. 11

24.7%

8.0%

67.3%

484

Sept. 16 – Sept. 25

29.5%

10.9%

59.6%

463

Sept. 30 – Oct. 9

28.1%

11.8%

60.1%

479

Oct. 14 – Oct. 21

16.9%

12.8%

70.3%

485

Total

24.8%

10.9%

64.4%

1,911

(By the way, the overall 95% confidence interval for all four waves combined is around +/- 2.2 points.  For any one wave, it’s around 4.4 points.)

Second, to convert these expectations to raw numbers, we need an estimate of turnout. In previous memos, I’ve done this by adding 10% to 2016 turnout and then utilizing a simple regression model.  Since then, I have come across the state-level turnout estimates that are produced as a byproduct of the FiveThirtyEight presidential election forecasting model, and so I’ll use those instead.  For Arizona, the low and high estimates are 2.7 and 3.7 million, respectively, which is what I’ll use here.  (For the record, a 10% increase would get you 2.7 million and the regression technique would get you 3.5 million.)

Third, here is what the combination of numbers above imply for the final distribution of votes in Arizona, by mode:

  Vote mode, combining four waves of survey
Assumed turnout Election Day Early Mail
2.7 million 456k 345k 1.898M
3.7 million 625k 474k 2.601M

Fourth, a final calculation needs to be made, if we want to estimate the number of mail ballots that will be requested, since not all mail ballots are returned.  For the states that make their absentee ballot files available, it appears that in 2016, around 85% of requested mail ballots were returned.  If that return rate holds for Arizona, then it should expect between 2.2 million and 3.1 million requested ballots. Of course, with the large size of the Arizona permanent absentee list, I should put the word “requested” in quotes (which I just did), because most of these requests didn’t even need to be made for this election.

I’m relying on data being collected and reported on a private website maintained by Data Orbital.  The most recent report from Arizona, which is updated to yesterday (October 26) states that 3,343,186 ballots have been requested and 1,816,615 returned.

One thing to keep in mind is that according to Michael McDonald, Arizona combines early in-person and mail voting statistics, so we can’t distinguish the two.  For that reason, we need to combine both early in-person and mail balloting figures to come up with the comparable statistics that are reported by Arizona.  On the request side, we need to add expected in-person early votes to estimates mail requests, which get us an equivalent of 2.5 million to 3.6 million estimated requests.  We then need to add together the in-person early and mail ballot numbers, to get between 2.2 million and 3.1 million estimated early votes.

Over the past week, Arizona has been averaging 118,000 returned ballots per day.  Applied to the eight remaining days before Election Day, that works out to 944,000 additional ballots to be returned.  If we add this to the 1.8 million already returned, we get an estimate of 2.7 million early votes eventually to be returned, which is within the estimated range from previous paragraph.

These early voting estimates can be summarized in the following graph:

Note that the 2.7 million early votes that I estimate will be returned, if Arizona keeps on its current track, is 100% of the lower estimate for total turnout.  Obviously, Arizona will see some degree of turnout on Election Day, but how much?  The midpoint of the two turnout estimates is 3.2 million.  Taking that as the turnout point estimate, then we get an estimate of 500,000 to turn out on Election Day.  This is  only slightly below the half-way point between the high and low estimates of Election Day voting first calculated above, which suggests that an Election Day turnout level in the range of 500,000 to 600,000 on Election Day would not be out of the question.

What’s Florida to Expect with Early Voting?

Charles Stewart III

It’s just over a week before the election.  The Healthy Elections Project has been running a series of surveys in half a dozen battleground states, asking the intention of registered voters about how they intend to cast their ballots.  I have previously published thoughts on North Carolina and Wisconsin, with a bonus posting about Georgia (where we are not surveying, ourselves, but have survey evidence from elsewhere.)  This brief note focuses on Florida.

To summarize what follow, if we make reasonable assumptions about turnout and take the survey results as a starting point, the actual pace of mail and early voting exceeds what we would expect, which also means that estimated votes on Election Day seem way too small.  To make the math work, we either need to assume that turnout will be around 11.5 million (a 20% increase over 2016, which would be astonishing), that this coming week will see a throttling back on the pace or early and mail balloting, or that survey respondents have been significantly under-reporting their intention to vote on Election Day.  Alas, we won’t know which explanation holds until Election Day, by which time it will be too late to do anything about it.

First, as to the intentions themselves.  The table below shows that there was very little movement in reported intentions across the first four waves of the surveys, but in the last one, there was a clear decline in reported likelihood of voting on Election Day, associated with an increased tendency to prefer voting by mail.  Although an ANOVA test fails to reject the null hypothesis that the percentages from the four waves come from different underlying distributions, the apparent break in mid-October suggests that it might be useful to consider the last set of results separately.

Vote mode intention among likely voters, including don’t knows

Date

Election Day

Early

Mail

Don’t know

N

Sept. 4 – Sept. 11

29.2%

24.5%

41.8%

4.5%

493

Sept. 16 – Sept. 25

29.5%

30.3%

38.2%

2.1%

486

Sept. 30 – Oct. 9

25.7%

32.2%

39.7%

2.4%

489

Oct. 14 – Oct. 21

21.3%

31.2%

46.6%

0.9%

492

Total

26.4%

29.5%

41.6%

2.5%

1,960


Vote mode intention among likely voters, excluding don’t knows

Date

Election Day

Early

Mail

N

Sept. 4 – Sept. 11

30.6%

25.6%

43.8%

471

Sept. 16 – Sept. 25

30.1%

30.9%

39.0%

476

Sept. 30 – Oct. 9

26.3%

33.0%

40.7%

477

Oct. 14 – Oct. 21

21.5%

31.5%

47.0%

487

Total

27.1%

30.3%

42.6%

1,911

(By the way, the overall 95% confidence interval for all four waves combined is around +/- 2.2 points.  For any one wave, it’s around 4.4 points.)

Second, to convert these expectations to raw numbers, we need an estimate of turnout.  I’ve done this in two ways, as I have for all the states in the previous memos.  The first is just to assume that turnout is 10% above the 2016 turnout level of 9,580,489.  This would place 2020 turnout at 10.5 million. The second uses a very simple linear regression to predict the log of turnout in terms of the log of registered voters in the most recent six presidential elections, and then extrapolating based on the coefficients derived from that regression.  This gives us an estimated turnout level of 10.8 million. (For those paying close attention to the various posts on this subject, the difference between the two estimates are the tiniest yet.)

Third, here is what the combination of numbers above imply for the final distribution of votes in Florida, by mode:


Vote mode, combining four waves of survey


Vote mode, using last wave of survey

Assumed turnout

Election Day

Early

Mail


Election Day

Early

Mail

10.5 million

2.846M

3.182M

4.473M


2.258M

3.308M

4.935M

10.8 million

2.927M

3.272M

4.601M


2.322M

3.402M

5.076M

Fourth, a final calculation needs to be made, if we want to estimate the number of mail ballots that will be requested, since not all mail ballots are returned.  In the 2016 election, 86% of the requested mail ballots were returned.  If this holds for 2020, then Florida should expect between 5.2 million and 5.9 million ballots to be requested.

The most recent report from Florida, which is updated to yesterday (October 25) states that 5,988,213 mail ballots were either unreturned or had been counted, which I take to be the estimated number of mail ballots that have been requested.  Because the deadline to request mail ballots has now passed, it seems that the number of mail ballots requested will be just above the upper level estimated here.

Also, as of this writing, 3,805,775 mail ballots have been returned. Over the past week, Florida has been receiving an average of 173,000 mail ballots each day.  If this pace continues—and we actually can expect for the pace to quicken—Florida would have 5.1 million ballots in hand by election day, which is also just above the upper limit of the estimates here.

This brings us to early voting.  Over two million Floridians cast ballots in the first week of early voting, with seven more days to go.  Even at this pace, Florida will see more than four million early votes—and we know that the early voting pace will pick up, too.  Thus, early voting is likely to exceed even the upper bounds of these estimates by around 600,000 voters.

These early voting estimates can be summarized in the following graph:

As noted, Florida is already right above the high end of these estimates for mail ballots and is on the way to do the same for early voting.  Where does this leave Election Day?

Let us assume a turnout level of 10.8 million.  If we subtract 5.1 million mail ballots and 4.0 million early votes,  which is the path the state is currently on, that leaves a paltry 1.7 million ballots to be cast on Election Day.  That’s an astonishingly small number, by any standard.  Of course, it all depends on the turnout model and the accuracy of the extrapolations I’ve been suggesting.  Here are some additional thoughts.

  • A 10% increase in turnout over 2016 is already pretty bit, but what if it’s even bigger, at 20%? Then, we’d expect 11.5 million to vote, leaving 2.4 million to vote on Election Day.  That would get us to the lower range of the estimates, but only because we’ve assumed an astounding turnout level.
  • What if the early- and mail voting are more front loaded than in past years? In that case, the pace of mail and early voting might throttle back in the next week, giving more space for Election Day voting.

These two thoughts take off from the current level of mail and early voting and question whether certain assumptions are right.  It’s also the case that we could go back to the survey responses and ask why the proportions voting using the four modes is so off, especially the first three.  That’s the subject of another post.  A favorite hypothesis of mine right now is that both Democrats and Republicans have been responding to these polls reflecting on the clear preferences of their party’s political leaders.  If so, then it does raise important questions about using survey research to anticipate voter behavior in the realm of election administration.


What’s Georgia to Expect with Early Voting?

Charles Stewart III

I’ve been working on estimates about the number of mail ballots and early ballots we can expect in the battleground states where the Healthy Elections Project has been surveying about voter intentions.  I’ve published estimates for North Carolina and Wisconsin, and should have estimates for Michigan, Pennsylvania, Arizona, Florida, and Ohio shortly.

In hindsight, there’s at least one battleground state where I wish I had been surveying in, and that’s Georgia.  However, there is some other data available we can use, from the Voter Study Group, which can help provide some guidance to where things will be going.

Before jumping in, let me give the spoiler alert.  The survey research I have seen that has asked Georgians how they plan to vote–early, by mail, or on Election Day–seems to be under-predicting early voting turnout and over-predicting how many will cast votes by mail.  Whether Election Day ends up being relatively quiet, with voters siphoned off to early and absentee voting, or busy, with historic turnout rates continuing through to November 3, depends on what your model of the turnout level is.

First, as to the intentions themselves.  According to the VSG’s October 23 update, utilizing data from August 27 to October 21, 30% of Georgians plan to vote in person on Election Day, 36% early, 32% by mail, and 2% don’t know.  Following the convention in my other analyses, I omit the “don’t knows,” leaving us with 30.6% on Election Day, 36.7% early, 32.7% by mail,

Second, to convert these expectations to raw numbers, we need an estimate of turnout.  I’ve done this in two ways.  The first is just to assume that turnout is 10% above 2016 (4,165,405), which would place it at 4.6 million.  The second uses a very simple linear regression to predict the log of turnout in terms of the log of registered voters in the most recent six presidential elections, and then extrapolating based on the coefficients derived from that regression.  This gives us an estimated turnout of 6.0 million. 

Yes, I know this is a huge range.  What makes Georgia’s turnout rate tricky to estimate, using the registration rate, is that its adoption of automatic voter registration has caused its registration numbers to balloon since 2016.  The regression estimate assumes that turnout of registered voters who would not have been registered except for AVR is the same as those who would have registered otherwise.  That seems unlikely, but for now, I’m sticking with the high estimate, simply because it’s probably better under these circumstances to over-estimate turnout than under-estimate it.

Third, here is what the combination of numbers above imply for the final distribution of votes in Georgia, by mode:


Vote Mode

Assumed turnout

Election Day

Early

Mail

4.6 million

1.408M

1.688M

1.504M

6.0 million

1.836M

2.202M

1.962M

Fourth, a final calculation needs to be made, if we want to estimate the number of mail ballots that will be requested, since not all mail ballots are returned.  The return rate of mail ballots in the 2016 general election was 88%.  If that holds for the general election in Georgia, it should expect between 1.7 and 2.2 million mail ballots to be requested.

As of yesterday (October 25), 1,539,302 mail ballots have been requested.  Last week saw an average of 7,700 new mail requests each day.  If that is the pace of requests in the coming week (the deadline for submitting an absentee request is Friday), Georgia won’t even see 1.6 million requests for mail ballots. In other words, it appears that Georgia will under-shoot even the low-ball estimate.

If requests appear to be coming in below the estimate, then the number of mail ballots requested are likely to, as well.  As of yesterday, 963,616 ballots had been returned.  To reach the low end of the estimated range of absentee ballots, Georgia would need to see about 79,000 ballots returned each business day between now and November 3.  That would be nearly double the pace of past week.  This is not out of the range of the possible, but it would still put Georgia on a track for 1.5 million mail ballots cast, which is right at the low end of estimates, assuming the survey results are correct and Georgia gets turnout of 4.6 million.

The big story is early voting, and here the pace exceeds poll-based expectations.  As of yesterday, over 1,792,000 early votes had been cast, which means that it has already pierced the low-end estimate of 1,688,000.  For the past week, Georgia has been averaging nearly 135,000 early votes a day.  With five more days left for early voting, that pace would add another 675,000 voters, pegging total early voting turnout at around 2,467,000, which is well above the high-end estimate of 2.2 million.

However, there’s every reason to believe that the pace of early voting will accelerate even further next week.  This expectation is based on the pattern of early voting thus far, which is illustrated by the accompanying graph, which compares daily early voting numbers for 2016 and 2020.  (Click on the graph to enbiggen.) Weekday early voting volumes have ranged from 29% to 70% higher than the comparable day in 2016.  Furthermore, early voting picked up the pace in the final week before the election in 2016, crescendoing to a quarter million on the last day.

If we assume that daily early voting turnout will continue running about 40% above last year’s pace, as it did last week, then Georgia is on a path to add an additional 1.4 million early votes by the end of this week.  Combined with the 1,792,000 early votes already in the ballot boxes, we could see around 3.2 million early votes cast in Georgia when it is all over.

All told, it is looking like Georgia is on a path to see 3.7 million advanced votes this cycle, 1.5 million by mail and 3.2 million early in person.  (In contrast, it saw nearly 2.4 million advance votes in 2016, with total turnout at near 4.2 million.) 

The following graph summarizes these estimates.

Where does this leave Election Day itself?

This is where the turnout estimate really matters.  Simply assuming that turnout is 10% above 2016—in other words, slightly above population growth—gives us a turnout estimate of 4.6 million, leaving only 900,000 voters for Election Day.  The regression-based estimate of 6.0 million leaves a much larger number, 2.3 million.  For context, nearly 1.8 million cast Election Day votes in 2016.

Although we do not know what total turnout will be, nor how many early and mail ballots will be cast next week, it already seems obvious that the Voter Study Group estimates are off by quite a lot. Those estimates are consistent with the volume of early votes being only about 10% greater than the volume of mail votes.  But, the trajectories are currently putting early votes at twice the rate of mail votes.  This is no particular dig at the Voter Study Group, whose results are entirely consistent with other polling that has been shared with me in confidence. 

Nor does this appear to be simply a matter of voters intending to vote by mail and then switching to in-person early voting.  Thus far, around 10% of early voters are recorded as having previously requested a mail ballot.  It’s certainly true that if we reallocate 10% of the estimated early voters to the mail ballot group, the early/absentee voting gap closes, but the relative dominance of early voting would still be roughly a factor of two, rather than parity.

This is a puzzle to be resolved by the researchers after the election.  Where does it leave the state, as it plans for the next eight days? First, it seems obvious that the state needs to brace for even greater early voting volume this coming week.  Second, it also seems that the state cannot be complacent about Election Day.  The cruel reality this year is that we won’t know if this is a high turnout election, or a high HIGH turnout election until the polls close on November 3. 

What’s Wisconsin to Expect with Early Voting?

Charles Stewart III

It’s now twelve days to the general election.  The Healthy Elections Project has been running a series of surveys in half a dozen battleground states, asking the intention of registered voters about how they intend to cast their ballots.  This brief note focuses on Wisconsin.

First, as to the intentions themselves.  Not surprisingly, as the following table demonstrates, as Election Day has approached, voters have become more certain of what they intend to do.  Overall, as the uncertain voters have decided what to do, they have tended to gravitate toward voting by mail.  This is a small trend, based on small numbers, so I wouldn’t make too much of it.  If we take the average across all three waves of the survey and exclude those who don’t know how they will vote, we can expect 44% on Election Day, 12% during in-person absentee (early) voting, and 44% by mail.  If we take just the most recent wave, these numbers are 42%, 10%, and 48%, respectively.

Vote mode intention among likely voters, including don’t knows

Date

Election Day

Early

Mail

Don’t know

N

Sept. 4 – Sept. 11

44.7%

11.1%

40.3%

4.0%

496

Sept. 16 – Sept. 25

42.7%

12.6%

41.6%

3.1%

496

Sept. 30 – Oct. 9

40.8%

9.9%

46.2%

3.1%

494

Total

42.7%

11.2%

42.7%

3.4%

1,486


Vote mode intention among likely voters, excluding don’t knows

Date

Election Day

Early

Mail

N

Sept. 4 – Sept. 11

46.5%

11.6%

41.9%

476

Sept. 16 – Sept. 25

44.1%

13.1%

42.9%

480

Sept. 30 – Oct. 9

42.1%

10.2%

47.7%

479

Total

44.2%

11.6%

44.2%

1,435

(By the way, the overall 95% confidence interval for all three waves combined is around +/- 2.5 points.  For any one wave, it’s around 4.4 points.)

Second, to convert these expectations to raw numbers, we need an estimate of turnout.  I’ve done this in two ways.  The first is just to assume that turnout is 10% above 2016, which would place it at 3.3 million.  The second uses a very simple linear regression to predict the log of turnout in terms of the log of registered voters in the most recent six presidential elections, and then extrapolating based on the coefficients derived from that regression.  This gives us an estimated turnout of 2.8 million.

Third, here is what the combination of numbers above imply for the final distribution of votes in Wisconsin, by mode:


Vote mode, combining three waves of survey


Vote mode, using most recent wave of survey

Assumed turnout

Election Day

Early

Mail


Election Day

Early

Mail

2.8 million

1.238M

0.325M

1.238M


1.179M

0.286M

1.336M

3.3 million

1.459M

0.383M

1.459M


1.389M

0.337M

1.475M

Fourth, a final calculation needs to be made, if we want to estimate the number of mail ballots that will be requested, since not all mail ballots are returned.  During the summer, it seems that 90% of requested mail ballots were returned.  If that holds for the general election in Wisconsin, it should expect between 1.4 and 1.6 million mail ballots to be requested.

As of this morning (October 21), 1,419,484 mail ballots have been requested.  In recent weeks, requests have been running at around 10,000 per day, so Wisconsin is on target for around 1.5 million mail ballots.

Also, as of this morning, 947,811 mail ballots have been returned.  This means that about 60% of the ballots that will be returned have been returned.  It also suggests that between now and Election Day, Wisconsin should be seeing an average of 60,000 mail ballots arrive each day, which is just a bit above what was received this past Monday.

One final thing:  Today was the first day Wisconsin started separating out in-person absentee voting from is daily absentee report.  In this first day, nearly 80,000 people voted early.  That’s much higher than the number of mail ballots that were returned (30,846).

Here is the graph that summarizes this all.


North Carolina Is on Track to More than 1.3M Mail Ballots and 2.1M Early Votes

What’s North Carolina to expect?

Charles Stewart III

It’s now two weeks and a day to the general election.  The Healthy Elections Project has been running a series of surveys in half a dozen battleground states, asking the intention of registered voters about how they intend to cast their ballots.  This brief note focuses on North Carolina.

First, as to the intentions themselves.  Not surprisingly, as the following table demonstrates, as Election Day has approached, voters have become more certain of what they intend to do.  Overall, as the uncertain voters have decided what to do, the fraction saying they intend to vote during the early voting (one-stop absentee) period has grown.  This is a small trend, based on small numbers, so I wouldn’t make too much of it.  If we take the average across all three waves of the survey and exclude those who don’t know how they will vote, we can expect 30% on Election Day, 43% during one-stop (early) voting, and 27% by mail.  If we take just the most recent wave, these numbers are 27%, 46%, and 27%, respectively.

Vote mode intention among likely voters, including don’t knows

Date

Election Day

Early

Mail

Don’t know

N

Sept. 4 – Sept. 11

29.8%

39.8%

24.7%

5.7%

483

Sept. 16 – Sept. 25

30.3%

38.7%

26.8%

4.2%

487

Sept. 30 – Oct. 9

26.6%

45.4%

26.3%

1.7%

488

Total

28.9%

41.3%

26.0%

3.9%

1,458


Vote mode intention among likely voters, excluding don’t knows

Date

Election Day

Early

Mail

N

Sept. 4 – Sept. 11

31.6%

42.2%

26.2%

455

Sept. 16 – Sept. 25

31.6%

40.4%

28.0%

467

Sept. 30 – Oct. 9

27.1%

46.2%

26.7%

480

Total

30.1%

43.0%

27.0%

1,402

(By the way, the overall 95% confidence interval for all three waves combined is around +/- 2.5 points.  For any one wave, it’s around 4.4 points.)

Second, to convert these expectations to raw numbers, we need an estimate of turnout.  I’ve done this in two ways.  The first is just to assume that turnout is 10% above 2016, which would place it at 5.0 million.  The second uses a very simple linear regression to predict the log of turnout in terms of the log of registered voters in the most recent six presidential elections, and then extrapolating based on the coefficients derived from that regression.  This gives us an estimated turnout of 5.3 million.

Third, here is what the combination of numbers above imply for the final distribution of votes in North Carolina, by mode:


Vote mode, combining three waves of survey


Vote mode, using most recent wave of survey

Assumed turnout

Election Day

Early

Mail


Election Day

Early

Mail

5.0 million

1.500M

2.150M

1.350M


1.350M

2.300M

1.350M

5.3 million

1.590M

2.279M

1.431M


1.431M

2.438M

1.431M

Fourth, a final calculation needs to be made, if we want to estimate the number of mail ballots that will be requested, since not all mail ballots are returned.  During the summer, it seems that 90% of requested mail ballots were returned.  If that holds for the general election in North Carolina, it should expect between 1.5 and 1.6 million mail ballots to be requested.

As of this morning (October 19), 1,331,050 mail ballots have been requested.  In recent weeks, requests have been running at around 100,00 per week, so North Carolina is on target for the 1.5 – 1.6 million requests estimate.

Also, as of this morning, 622,781 mail ballots have been returned and 920,337 early ballots have been cast.  On the mail ballot side, this means that about 45% of the ballots that will be returned have been returned.  It also suggests that between now and Election Day, North Carolina should be seeing an average of 50,000 mail ballots arrive each day.  Last week’s peak days saw just over 25,000 ballots received, so from this point out, the average day moving forward will be twice as busy as last week’s peaks.

On the early voting side, with 920,337 votes cast already, this leaves between 1.2 and 1.5 million votes go to.  In other words, North Carolina is also a bit over 40% of the way to processing its early voting, as it is its mail votes.

Here is the graph that summarizes this all.