Author Archives: cstewart

The Blue Shift Comes to the California Primary

Ned Foley alerted the world to the “blue shift” that has begun to characterize the trends in vote totals after the initial tranche of results are released on election night.    The blue shift is the tendency for presidential vote results to trend in a Democratic direction as the count proceeds from ballots counted on Election Day to ballots counted during the canvass period — both absentee and provisional ballots.

For instance, in 2016, the nationwide election-night returns had Clinton leading Trump 48.14% to 47.12%, or by 1.02 points among the 124.2 million votes accounted for on Election Day.  By the time all the votes were counted in all the states, Clinton ended up leading 48.02% to 45.93%, or 2.09 points, among the 137.1 million votes eventually counted.  The growth in Clinton’s lead was a blue shift of 1.07 points (i.e., 2.09-1.02).

(The election night totals are taken from the New York Times.  The final canvass totals are taken from Dave Leip’s Atlas of U.S. Presidential Elections.)

California is one of the biggest contributors to the nationwide blue shift — although there is a blue shift of some size in most states — because of the large number of provisional and mail ballots in the Golden State.  Although 14.2 million votes were eventually counted in California, only 8.8 million were accounted for on election night.  In the process, Clinton’s lead grew from 61.49%-33.22% to 61.48%-31.49%, for a blue shift of 1.72 points.

It’s not surprising, therefore, that a significant blue shift showed up in California’s recent top-two primary.  Let’s take a look.

The good students working for the MIT Election Data and Science Lab downloaded the election night returns from California and stashed them on our Github depository (where anyone can access them).  This means we can compare the early returns with the final results published by the state, which are available here.

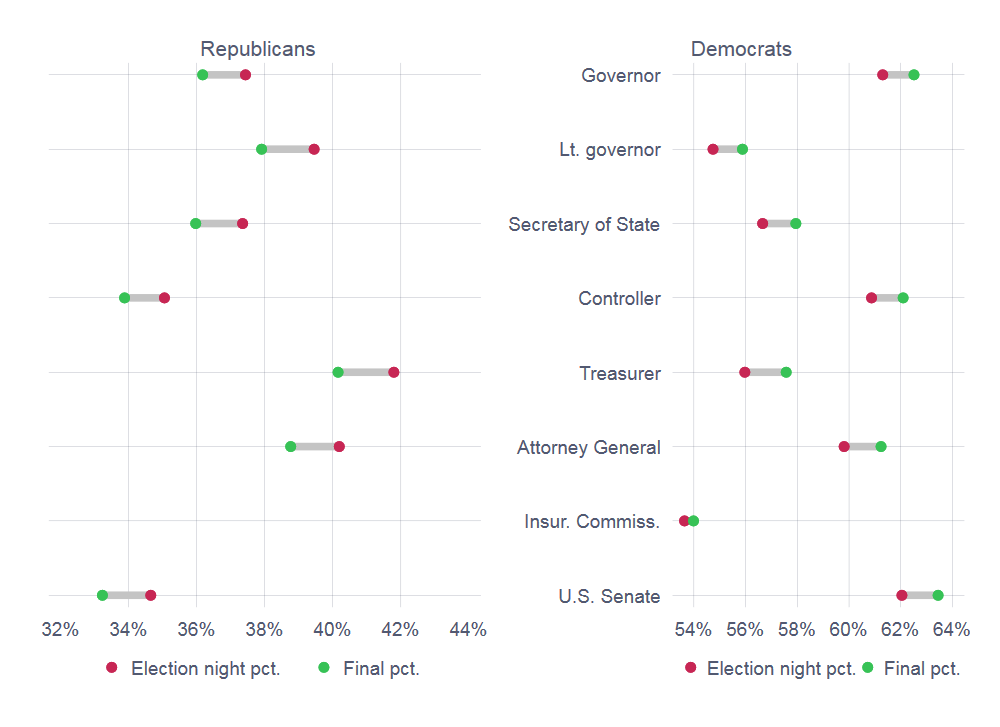
The accompanying graph helps to illustrate the magnitude of the blue shift for each of the statewide races with party labels on the ballot. (Click on the graph to biggify it.) In every race except insurance commissioner, Democratic-affiliated candidates as a whole saw their share of the votes grow by over a point, whereas the Republican-affiliated candidates saw their aggregate vote shares shrink by more than a point.

In the gubernatorial primary, for instance, all the Democratic candidates added together accounted for 61.31% of the primary votes cast, compared to 37.43% for the Republicans, a 23.88-point lead.  In the final count, Democratic candidates received 62.51% of all the votes counted, compared to 36.17% for the Republicans, causing the lead to grow to 26.34 points.  The blue shift in this case was 2.46 points.

It should be noted that the partisan shfits associated with the minor-party and no-party candidates did not go systematically one way or the other.  The only non-major-party candidate who was a factor in any of the primaries was Steve Poizner, the former insurance commissioner, who ran without a party label to get his old job back.  In this one race, the two Democrats in the contest gained very little percentage-wise as the count progressed, and Poizner lost very little.

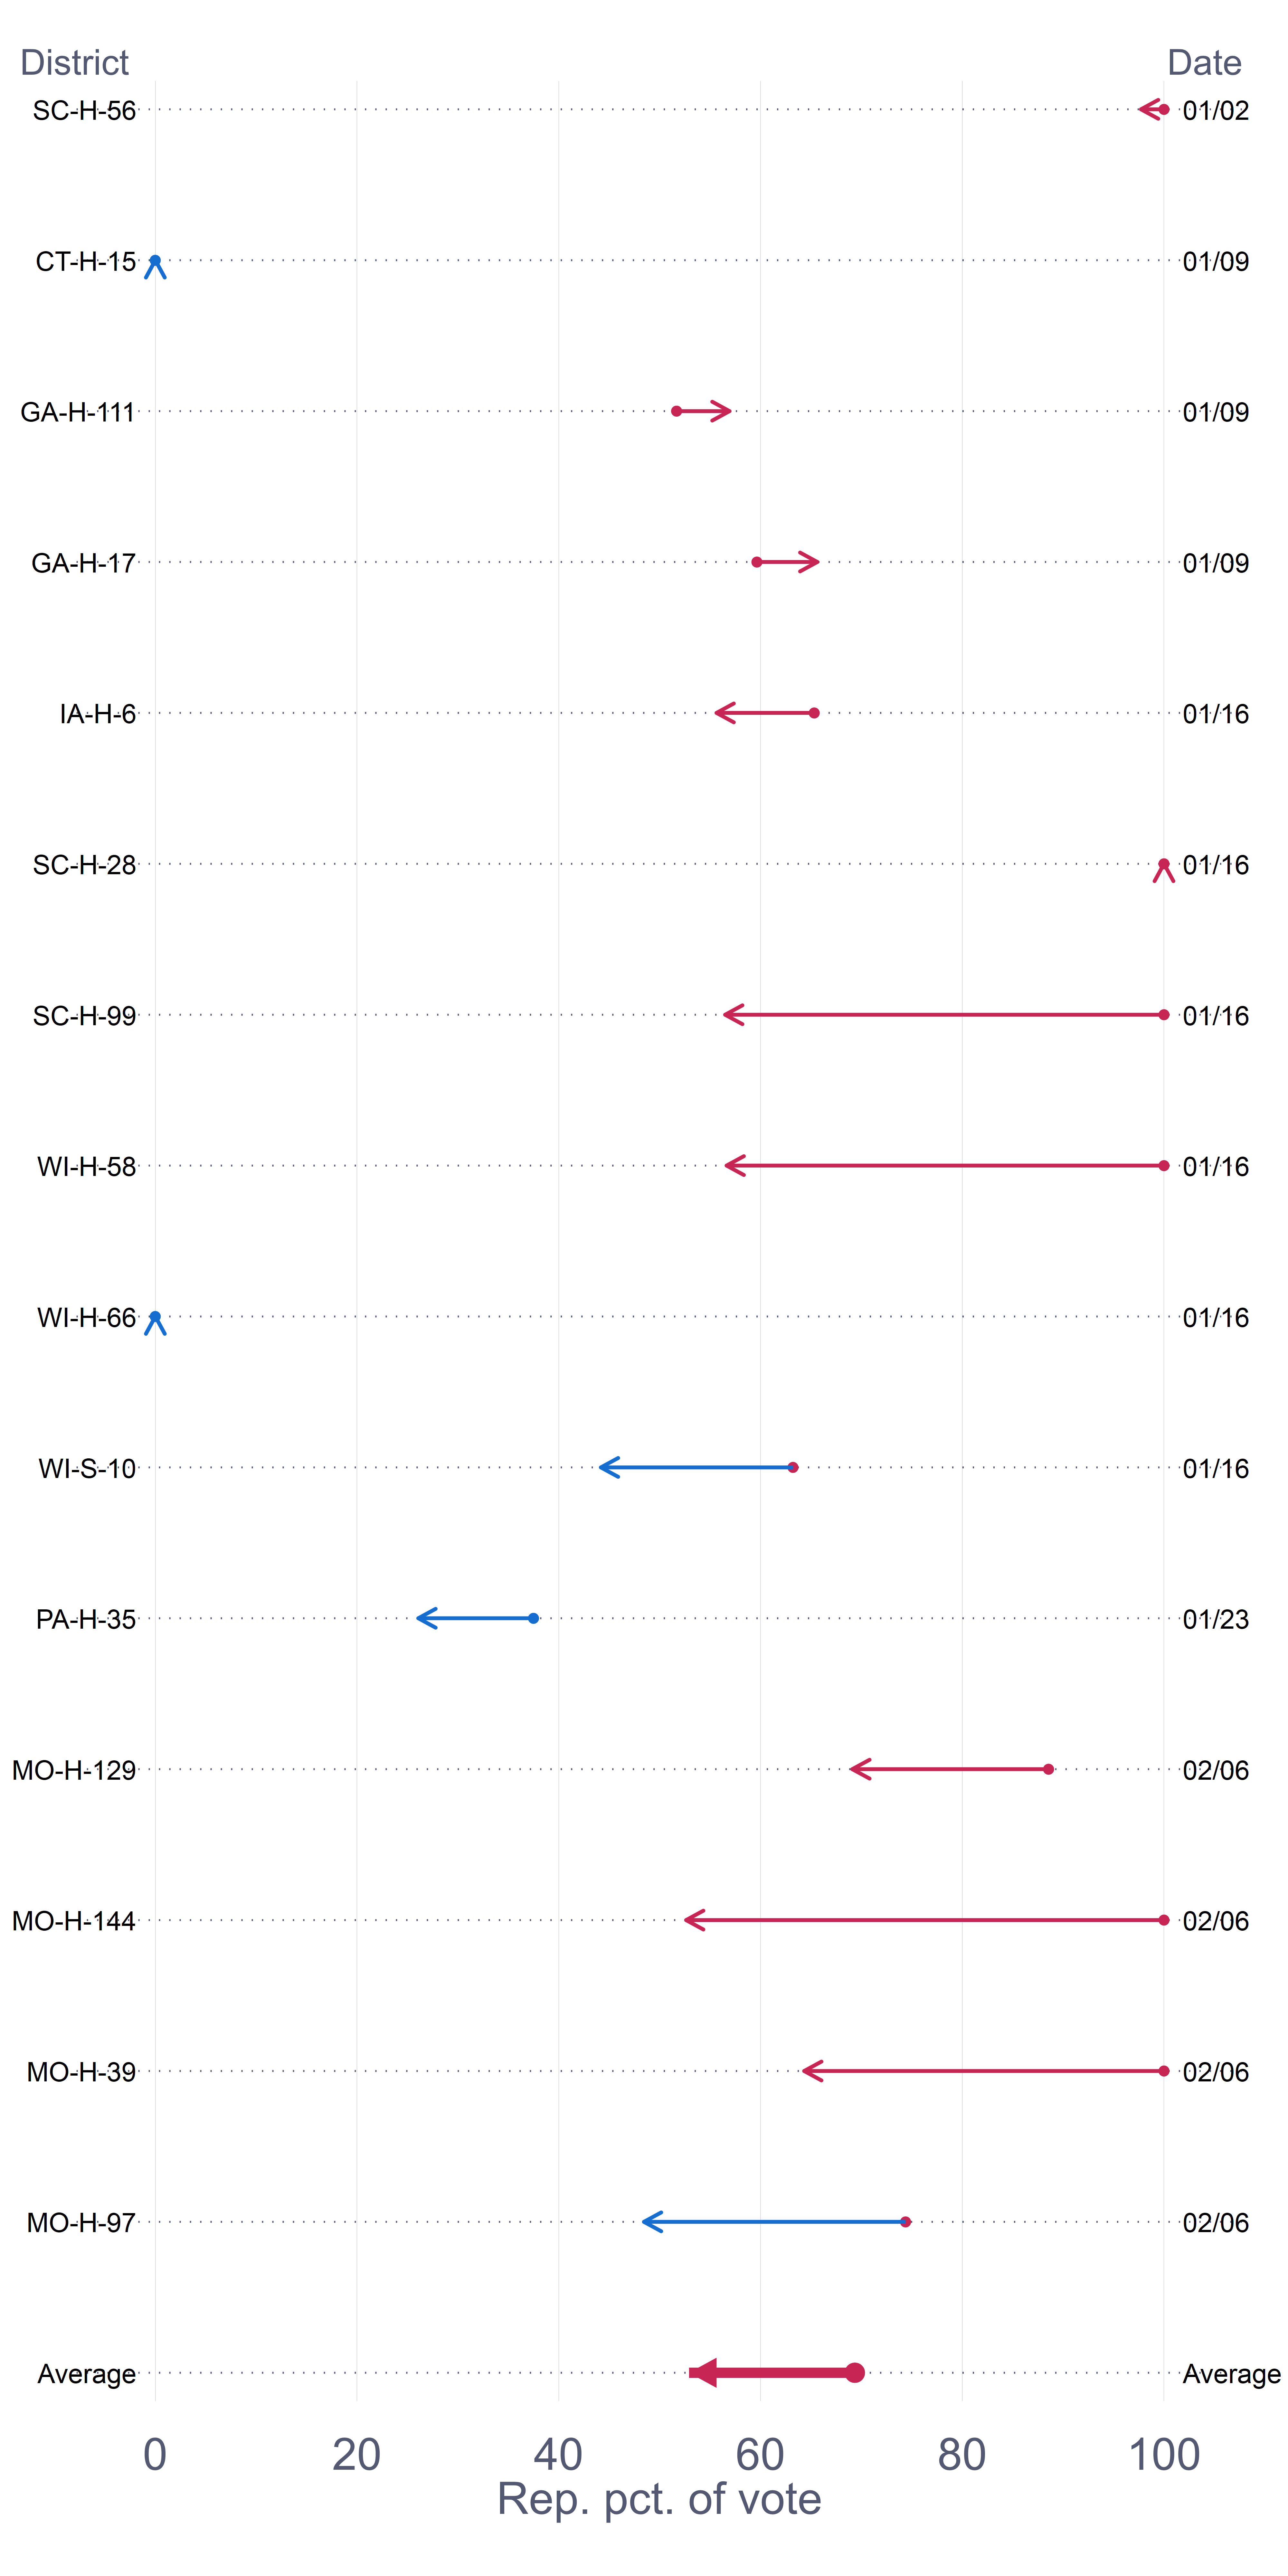
The aggregate blue shifts seen among Democratic and Republican candidates are clear, but do they benefit all candidates equally?  Not really.  To see this, take a look at the change in the vote shares enjoyed by all the Democratic and Republican candidates on the gubernatorial primary. (Click on the graph to enlargify it.)  For both the Republican and Democratic candidates, I have shown the magnitude of the shift in the vote share from election night to the final canvass.  The candidates are displayed with the top election-night vote-getter from each party at the top, and then the other candidates down below in the order of their votes.

All Republicans lost vote share during the canvass, with John Cox, who came in second overall, losing the most — nearly a full point.  Of course, he was far ahead of Travis Allen (and also Antonio Villaraigosa, the second-place Democrat), so he had plenty to lose.  Indeed, since he was the only Republican candidate whose vote share was in the double digits, it’s not surprising that virtually all of the down-side of the blue shift was heaped on him.

Most of the top-ranked Democrats gained vote share as counting progressed.  The exception at the top was Villaraigosa, who lost 0.16 points from election night to the final canvass.  Why he was along among the top vote-getters in losing vote share, I will leave to others to figure out.

California is not alone in having a lot of ballots left to count after election night, but it is by far the largest state with so much to do in the days after an election.  With California a deep blue state, its healthy blue shift has not really been much of a factor in national elections.  This might change in November.  I haven’t yet drilled down to analyze the magnitude of the blue shift in California’s congresisonal primaries, but I suspect the patterns are similar to what we see at the state level.  If so, then a blue shift of a point or two in those elections in November could not only have state significance, but could be a factor as we seek an answer to the question of whether the Democrats will gain control of the U.S. House.

Voters Think about Voting Machines

The annual State Certification Testing of Voting Systems National Conference was recently held in Raleigh, North Carolina.  This is one of my favorite annual meetings, because it brings together state and local officials who are responsible for the care and feeding of voting technologies.  I learn a lot every year.

Check out the program, including slides and other documents, here.

The price of attending is that every participant must give a presentation.  This gave me an opportunity this year to pull together work I have done over the past several years about public opinion related to voting technology and election security.  This is the first in a series of blogs in which I share some of the material I presented in Raleigh.

Today’s post is about attitudes toward voting machines.  The current nationwide attention to election security has led to a renewed interest in voting technologies and to two topics in particular:  (1) the use of computers to cast and count ballots and (2) the age of the equipment and the need to replace machines that were bought in the aftermath of the 2000 election.

Beginning in 2012 I started asking respondents to public opinion surveys what they think about different voting technologies.  Not surprisingly, opinions among the public about voting machines have changed in recent years, particularly as the drumbeat against DREs has grown louder, and as the security of voting technologies has become more salient.

Public opinion in 2012

To see how opinion has changed in the recent past, it is useful to start in 2012, when I first asked a series of questions about voting machines in the Cooperative Congressional Election Study (CCES).

(The CCES is the largest academic study of political opinions conducted every two years before and after the federal election.  One nice thing about the CCES is that it allows researchers to ask their own questions of a representative sample of adults within the context of a larger survey.)

The responses to the questions I asked revealed that DREs were clearly the technology of choice. in 2012

The bottom line was measured by asking respondents which voting technology they would prefer to vote on.  The technologies were defined as follows:

  • Paper ballots scanned and counted by a computer. (Opscans)
  • Electronic voting machines with a touch screen. (DREs)
  • Paper ballots counted by hand. (Paper)

Of the 2,000 respondents, 56% preferred DREs, 25% opscans, 7% paper, and 11% had no opinion. (See the table below.)

Especially interesting are attitudes of respondents based on the voting equipment used in their home county.  The table above shows how this breaks down.  Respondents from counties that used DREs preferred them over opscans, 74%-13%.  Surprisingly, respondents from opscan counties also preferred DREs, by a comfortable 50%-30% edge.

Lying behind the overall preference for DREs over opscans — and the strong preference for either of these technologies compared to hand-counted paper — was a belief in the functional superiority of DREs, especially to count ballots and for usability.

To probe these deeper attitudes about voting machines, I asked respondents what they thought about the three major types of voting technologies.  In particular, I asked whether the respondent thought it was easy (1) for dishonest people to steal votes, (2) for disabled voters to use, and (3) for election officials to count votes accurately.

As the table below shows, on the whole, DREs won out over opscans — they were virtually tied on the question of vote-stealing, whereas DREs won hands-down on usability and counting accuracy.  Both opscans and DREs won out over hand-counted paper.

Probably the most interesting results come in analyzing respondents based on the type of voting technology used in their communities.  Here, we find surprisingly little difference between users of opscans and DREs.  For instance, 26% of opscan users thought it was easy to steal votes using opscans, compared to 31% of DRE users.  Most importantly, in 2012, even users of opscans believed that DREs were easier to use by voters with disabilities, and were easier for election officials to count votes accurately.

Public opinion today

Opinions have changed since 2012.

In 2016, I had the opportunity to ask the same set of questions in the CCES.  In addition, suspecting that opinions were changing rapidly, I was able to put a couple of questions onto the YouGov Omnibus in the fall of 2017.  Here’s what I’ve found:

  1. Support for DREs has fallen since 2012 while support for opscans has risen. (See the accompanying figure. Click on it to enbiggen.)  A particularly sharp drop in support for DREs occurred in just one year, from 2016 to 2017.  As of last fall, DREs no longer had a commanding lead over opscans among respondents overall, and opscan users no longer prefer DREs over opscans.


  1. The perceived functional superiority of DREs is disappearing. This is illustrated in the figure below, which shows the percentage of people who believe it is easy to steal votes and to count votes, on opscans, DREs, and hand-counted paper.  (Click on the image to largify it.) There was a significant increase in the belief that it was easy to steal votes on all voting technologies between 2012 and 2016, but the increase was slightly greater for DREs than for opscans.  There was also a significant increase in the belief that it was easy to count votes on both opscans and DREs (but not hand-counted paper) between 2012 and 2016, with some pulling back from those positions in 2017.  Whether we take the 2016 or 2017 numbers, however, it is clear that DREs no longer are the clear winners on the vote-counting dimension.

Thus, as criticism of DREs has grown in public discourse, and computer security has become a more salient issue in election administration, the bloom has come off the DRE rose.  This is good news for those who have long advocated that DREs be abandoned for paper.  There is a caution here, however. Although support for DREs has declined significantly over the past five years, DRE users still believe it is the superior technology compared to opscans.  This suggests that as election administrators transition away from DREs over the next several years, they may find themselves needing to deal with local public opinion that may be skeptical of the move, and regard opscans as an inferior technology.

Tackling Long Election Lines in Theory and Practice

Last week the Bipartisan Policy Center (BPC) hosted an event to celebrate the four years since the Presidential Commission on Election Administration (PCEA) issued its report with recommendations to improve the experience of American voters.  (You can view videos of the event’s sessions here.)  The two major issues addressed in panels were long lines at the polls and the modernization of voter registration rolls—two of the primary concerns outlined in the PCEA’s report.

On the issue of long lines, the event provided the opportunity to release a report on Improving the Voter Experience, which provided results about a major project the BPC and the Caltech/MIT Voting Technology Project (VTP) collaborated on to monitor polling place wait times in 2016. That report is based largely on data provided by 88 counties from 11 states that participated in the line-length program.  These counties represented 15.6 million registered voters, 11.1 votes cast (8% of nationwide turnout), and 4,006 precincts.  This is the largest study ever conducted of how long voters wait to cast their ballots.

The report is full of facts that came from an analysis of all the data that was gathered by the 88 jurisdictions, and I encourage you to read the full document.  Here are some of the most important findings in brief:

  1. Most voters wait very little, if at all, to vote. Consistent with past survey research that’s been done on the subject, the modal (most-common) line length recorded in the project was zero.  Just over 2/3 of precincts had average wait times of less than 10 minutes.
  2. The longest lines, and wait times, are first thing in the morning. Almost every precinct in the study had people lined up waiting to vote when the polls opened on Election Day.  (As an aside, the fact that virtually every polling place has a line when the polls open suggests how easy it is for a news photographer to get a picture of a long line early on Election Day, and how meaningless these pictures are as evidence of problems.)  The average precinct had between 30 and 45 minutes’ worth of voters at the door when polls opened.  This is the most significant source of wait times, both when things go well and when things go poorly.  While we saw evidence of surges in turnout at other times of the day, such as around noon and after work, those surges were minor ripples compared to the tsunami of voters at the start of the day.
  3. If long lines are resolved after two hours, a precinct is highly unlikely to experience long waits the rest of the day. If the morning rush isn’t cleared up in three hours, count on lines throughout the day.  The findings of the study revealed the critical nature of managing wait times at the opening of the polls.  The line at the start of the day isn’t an issue so much as the line at the end of the first hour.  If a polling station’s line hasn’t been cut (at least) in half after the first hour, it will be difficult to make progress on wait times for the rest of the day.  I have talked to election officials who, after seeing the data from the project, have said they will use new resources they get for staffing to increase the number of staff who work in the morning.  (These are officials who live in states where poll workers are allowed to work in shifts.)

The report also brings to mind several points about process.

  1. We can improve election administration performance if we put our minds to it. President Obama was inspired to create the PCEA because of press reports of long waits to vote — some up to six hours long — in 2012.  In the PCEA’s report, the commission set a benchmark that no voter should have to wait more than 30 minutes to cast a ballot.  The survey research reveals that great progress was made toward hitting that benchmark in 2016.  According to responses to the Survey of the Performance of American Elections, in 2012, 13% of in-person voters waited more than 30 minutes to vote.  In 2016, that was reduced to 9%.  The most dramatic improvements occurred in the states that had the longest wait times in 2012.   The percentage of voters who waited more than 30 minutes fell from 39% to 4% in Florida, from 39% to 17% in D.C., and from 28% to 10% in Virginia.  We still have more work to do to make the commission’s benchmark a reality:  more than 5% of voters waited over 30 minutes in 25 states in 2016.  Still, the improvement in 2016 in the most troubling states reveals that election officials can make great strides in improving polling place management if they put their minds to it.  (As an aside, I think the wait-time success story bodes well for handling the current cybersecurity concerns, but only if officials put the same effort into addressing the issue.)
  2. If you don’t measure it, you can’t manage it. A barrier to managing polling place wait times before 2012 was the lack of detailed knowledge about how long voters waited to cast a ballot.  Survey research was valuable to help give the public and policymakers an idea about where the longest wait times were happening, but it didn’t provide “news you can use” to improve wait times.  After all, if we learn that wait times are much shorter in Vermont than in Florida, it doesn’t help if I tell you to move to Vermont if you want to vote more quickly in the future.  To help election officials pinpoint precisely where and when long wait times emerge, they need to measure wait times directly.  This means counting the number of voters waiting in line on a regular basis, gathering data about how many people arrived to vote during a given time, and then using Little’s Law to calculate what the wait times were.
  3. You can measure it, and you can manage it. The wait time project highlighted in the Improving Voter Experience report offers a simple, high-impact way for election officials to gather the data they need to find out when and where they long wait times are happening.  Election officials can go to this webpage and answer the call to participate in the program for 2018.

Finally, this report, which highlights data-gathering, reminds us that there are tools available to help local officials plan ahead of time to make sure they have enough staff, poll books, voting booths, etc. to handle the number of voters who walk through the doors.  The VTP continues to host, at the PCEA’s invitation, a set of online tools to aid in that management.  The Center for Technology and Civic Life’s Election Toolkit also contains helpful tools.  For those interested in a deeper dive into the science behind line management as applied to elections, I wrote the report Managing Polling Place Resources a couple of years ago to help translate queuing theory to the polling place.

What does “election hacking” mean to the public?

Yesterday I wrote about a recent poll I conducted that revisited the question of whether voters thought computer hacking was a major problem in the November 2016 election.  That post noted that more Americans have come to believe computer hacking was a major problem in 2016 than they believed back then.  However, the majority of opinion change has come from Democrats.  You can read that post here.

The question that was asked in the survey specifically mentioned “computer hacking” in the “administration of the election.”  However, the issue of “hacking the election” rarely is that specific when it comes up in the news or informal conversations.  So, I decided to ask the respondents this question at the very top of the survey:

There has been talk in the news recently about computer hacking in American elections. When someone talks about hacking American elections as a general matter, which of the following do you think about first?

The following table shows the possible response categories and how they were distributed among the respondents.  A plurality of respondents chose one of the two options involving foreign actors, whether using social media to influence voters (20%) or breaking into the computers that run elections (25%).  A good number of people, 20%, said that “nothing in particular” came to mind when they hear talk of computer hacking in elections.

Table 1.  Question: When someone talks about hacking American elections as a general matter, which of the following do you think about first?
All respondents Democrats Republicans
Foreign actors using social media, like Facebook, to influence how people vote 20% 28% 18%
Americans using social media, like Facebook, to influence how people vote 9% 7% 12%
Foreign actors trying to break into computer equipment used to run elections, like voter databases and voting machines. 25% 33% 21%
Americans trying to break into computer equipment used to run elections, like vo
ter databases and voting machines.
17% 12% 24%
Something else 8% 7% 8%
Nothing in particular 20% 13% 18%
N 2,000 880 603

There is a partisan divide in how respondents think about the topic of election computer hacking, but the pattern is more complicated than Democrats simply thinking there’s a big problem and Republicans not. A majority of Democrats chose one of the two responses that focus on foreigners, compared to only 39% of Republicans.  However, Republicans were much more likely to choose the response about Americans breaking into election equipment.  Like I said, the partisan divide on this question is not straightforward.

It’s hard to know what’s going on here, with only one question in a limited survey.  However, my favorite hypothesis is that this is evidence that Democrats are focused on the “Russian hacking” narrative about the 2016 election, whereas Republicans, when they think about problems associated with the election, are drawn toward corruption of election administration itself.  My guess is that had I asked respondents which was the bigger election administration problem, breaking into voting equipment by foreigners or inside corruption of the process, the parties would have neatly divided on the question — but, that’s a question to explore in the future.

Returning to the issue of political knowledge, it’s not surprising that people who follow the news most closely are more likely to have an opinion about the question (in other words, the “nothing in particular” response is less common) and that the partisan patterns seen above are heightened.  This is shown in the next table

Table 2.  Question: When someone talks about hacking American elections as a general matter, which of the following do you think about first? (Sub-sample:  respondents who report following the news “most of the time.”
All respondents Democrats Republicans
Foreign actors using social media, like Facebook, to influence how people vote 30% 37% 25%
Americans using social media, like Facebook, to influence how people vote 6% 4% 9%
Foreign actors trying to break into computer equipment used to run elections, like voter databases and voting machines. 32% 41% 22%
Americans trying to break into computer equipment used to run elections, like vote

r databases and voting machines.

16% 8% 24%
Something else 7% 6% 8%
Nothing in particular 9% 5% 11%
N 923 465 603

In particular, three-quarters of high-information Democratic respondents chose one of the two foreign-actor responses, whereas high-information Republicans seem to have a variety of first-thoughts about election computer hacking.  (In fact, it’s as if the high-information Republican respondents are choosing the response categories almost randomly, in stark contrast with the Democrats.)

To put yesterday’s and today’s posts together, it is interesting to note that there is a link between first thoughts concerning election hacking and the degree to which one thinks that computer hacking was a major problem in 2016.  Respondents saying that foreign hacking of computers used in election administration was the first thing that came to their minds were the most likely to say that computer hacking was a major problem in 2016.  (See the figure below.* Click on the figure to enlargify.)  This was especially true among Democrats, and only somewhat true among Republicans.

I concluded yesterday’s post by suggesting that Democratic and Republican constituents were likely to exert different levels of pressure on their parties’ legislators to do something about computer security in elections.  Today’s post suggests an amendment to that conclusion. In particular, the Democratic mass public seems convinced that (1) computer security in elections is a big problem, (2) the problem comes from outside the country, but (3) they can’t choose whether social media manipulation or voting machine hacking is a bigger problem.  In other words, security is a problem, and we’re being attacked from abroad.

The Republican mass public is not convinced that computer hacking of elections is a major problem; to the degree it might be a problem, they are more conflicted over whether it’s a domestic or foreign threat.

As is often the case in politics, it’s the side that has a clear diagnosis of a problem and its solution that drives the debate.  In that case, it’s the Democrats.  Of course, they don’t have the majority, at least in the nation’s capital, which may be a prescription for a lot of talk, and not a lot of action, from our national legislators.

Note:  The research was supported by a grant from NEO Philanthropy, which bears no responsibility for the results or analysis.

*The figure originally had an error in how the x-axis categories were labeled.  It has been corrected.

Partisans Divide over Election Hacking

A recent survey of 2,000 adults shows that Americans have become more concerned about election hacking than they were in 2016, and that a partisan divide has widened over these concerns.

This is the second in a series of surveys I’ve taken in the past several months, where I have looked at opinions held by Americans about problems facing the electoral process. In a series of previous posts, I looked at public attitudes toward the Pence-Kobach Commission, on the heels of its termination in January. (You can find those posts here, here, here, and here.)

In this post, I look at the issue of hacking.

The story starts in November 2016, when I threw two questions onto the end of the Survey of the Performance of American Elections. These questions asked respondents to report how much of a problem they though computer hacking was in the administration of elections in 2016, both nationwide and locally.

Recall that news and rumors of hacking — of social media, campaign websites, voting machines, and voter registration files — were a part of the news diet at the time, but it hadn’t developed into the major, multi-pronged story that it is now.

Back in November 2016, 17% of respondents thought computer hacking in elections was a major problem nationwide, while 10% thought it was a major problem locally.

What a difference a year makes. Last week, when I asked identical questions again, the percentage of Americans believing computer hacking in 2016 was a major problem had doubled — to 38% who believed it was a major problem nationwide, 20% locally.

Table 1.  Question:  How much of a problem do you believe computer hacking was [nationwide/locally] in the administration of elections in 2016?

Nationwide

Locally

Nov. 2016

Mar. 2018 Nov. 2016

Mar. 2018

Major problem

17%

38% 10%

20%

Minor problem

29%

28% 19%

25%

Not a problem

28%

15% 46%

29%

Not sure

26%

20% 25%

26%

N

10,199

2,000 10,199

2,000

What’s especially noteworthy about this change is the partisan detail. Although respondents in all three major partisan categories (Democrats, Republicans, and Independents) were more likely to view computer hacking in 2016 as a major problem, the biggest shift came among Democrats, who went from 23% viewing hacking as a major nationwide problem when asked about it in November 2016, to 56% when asked the same question this month. (See the accompanying figures; click on any of the figures to enlarge them.) The fraction of Independents viewing hacking in the 2016 election as a major nationwide problem grew from 16% to 30%; the fraction among Republicans grew from 10% to 18%.

Similar partisan patterns appear when we look at the question of computer hacking as a local election administration problem. Among Democrats, the percentage saying that computer hacking was a major local problem in the 2016 election was 14% in November 2016, compared to 29% when the same question was asked this month. Among Republicans, the percentage had grown from 4% to 9%; among Independents, it had grown from 10% to 17%.

These results have important implications for the politics of election hacking and the policy response. Here are two quick thoughts:

  • Leaving aside partisanship, there is greater concern with hacking as a nationwide problem than as a local problem. This may mean greater pressure on state and national officials to address problems of election cybersecurity than on local officials. Of course, as anyone in the elections business knows, the decentralized nature of election administration in America means there are lots of small jurisdictions that are probably the most vulnerable to attacks. Whether political pressure will line up with the nature of the threat is a question that is raised by these results.
  • Adding partisanship to the mix, and there is a significant mismatch between the Democratic and Republican mass publics about the severity of the problem. To the degree that election security reaches the political branches, this means that Democrats are likely to feel more pressure by their strongest supporters to do something about security threats, such as pass legislation like the bipartisan Secure Elections Act, than Republicans. Luckily, state and local election administrators don’t need partisan pressure to be attentive to issues of security, but the partisan perception of the threat may make it hard for them to get much help legislators on the issue, depending on local circumstances.

That’s enough on the partisanship angle for now. The survey contained a couple of other questions about perceptions of the threat of computer hacking in elections, which I hope to write about in the coming days.

Methodological note. The March 2018 survey referenced in this post was conducted by YouGov as a part of their omnibus survey. The November 2016 Survey of the Performance of American Elections was also conducted by YouGov as a special project. Both surveys were weighted to produce a representative sample of American adults. The questions about computer hacking asked in each survey were identical.

A Viewer’s Guide to Special Election Watch

Today starts a regular feature of the MIT Election Data and Science Lab called “Special Election Watch.”  The idea is to follow special elections in 2018 as a guide to the extent of the Democratic swing in the November 2018 election.  First, a couple of words of background, and then a guide to the graph we will be updating regularly.

Political scientists have long followed the partisan “swing” from one election to the other.  Analysis of the “uniform national swing” has been a staple of discussing British politics going back to the 1940s.  The question of whether the swing is so uniform in the U.S. has a distinguished pedigree, perhaps most notably represented by a small book by Tom Mann, Unsafe at Any Margin, in 1979 and an article by Gary Jacobson,  “The Marginals Never Vanished” in 1988.

Despite the fact that the partisan swing of electoral fortunes varies across districts in a particular election, the average swing across districts is a good starting point for gauging the degree to which one of the political parties will be favored.

Which brings us to the special election watch.  It’s widely accepted that 2018 will be a good electoral year for the Democrats.  But, by how much?  One common measure is the so-called generic congressional poll.  Another way to measure relative electoral strength is to calculate the change in electoral fortunes of the parties as they defend legislative seats in special elections.  That’s the approach we’ll be following here.

Ballotpedia’s 2018 election calendar currently lists over 40 special elections between now and June for state legislative seats.  As each one is held, we’ll be following the returns and comparing them to the results when the seat was last contested, usually in 2016.  The accompanying graph shows the results for this year’s special elections up to last Tuesday. (Click on the graph to biggify it.)

Here’s the guide to how to read the graph.  Each row represents a state legislative special election, with the district indicated on the left and the date of the election on the right.  The code for the district is the postal state code + “H” for House or “S” for Senate + district number.  The circle represents the percentage of the vote received by the Republican candidate in the last regular election; it’s red if the Republican won and blue if the Democrat won.  The arrow points to the Republican percentage in the special election; the arrow is red if the Republican won the special election and blue if the Democrat won.  At the very bottom, we show the average.

As of last Tuesday, taking all the special elections into account, the average swing has been about 16 points in favor of Democratic candidates.

Of course, there is more to this graph than just the average.  For instance, a large number of these seats were originally won without a contest.  Indeed, of the 15 elections shown here, 8 were originally won without a contest, 6 by Republicans and 2 by Democrats.  Not surprisingly, the average pro-Democratic swing was greatest in the previously uncontested seats (27 points) than in the seats that had been contested (4 points).  About half of all state legislative races were uncontested in 2016. If the patterns in the special elections hold in the general elections, we can expect a sharp drop in uncontested elections at the state level, which will be a significant event in itself.

This past week, there has been considerable press coverage of the special election in the 97th Missouri House district, which flipped to the Democratic column after it had given Donald Trump a large majority in 2016.  While seat-flipping is certainly notable, the larger story was the overall mobilization of Democratic voters in the four Missouri districts that had special elections on the same day.  Two of the districts (the 39th and 144th) had gone uncontested in 2016.  The fact that these districts attracted strong Democratic candidates, one of whom came close to winning, is almost as important as the Democratic victory in the 97th, at least from the perspective of measuring the relative appeal of the two parties’ legislative candidates these days.

The 2018 election year is just starting.  It’s a long way to November.  However, as Gary Jacobson and Sam Kernell taught us in their classic book, Strategy and Choice in Congressional Elections, the most important events of a congressional election year happen at the beginning, when the candidates, parties, and potential backers size up the field.  So far, the elections that are currently being held are consistent with even more good Democratic candidates jumping in and even more good Republicans staying (or moving to) the sidelines.


The Public Says Good-Bye to the Trump Vote-Fraud Commission, Part IV: Messaging about Fraud

This is the fourth of a four-part series looking at public attitudes related to President Trump’s fraud commission.  Part I introduced the series and explored whether voters had become more concerned about vote fraud since late 2016.  Part II explored who was knowledgeable about the commission.  Part III examined public opinion about the termination of the commission.  Today, I look at messaging about voter fraud, and then offer up some summary thoughts about the work of the commission, its termination, and the future.

Messaging about voter fraud

The value of a presidential commission is that it draws attention to an issue and can serve as a focal point as public opinion is mobilized for policy change.  Both ardent supporters and opponents of the Presidential Commission on Election Integrity saw the commission as filling this role in the case of vote fraud and voter registration.

Because the most prominent member of the commission, Kansas Secretary of State Kris Kobach, has developed a reputation as a determined opponent of voter fraud, it was reasonable to expect that had the commission continued conducting business, it would have been an amplifier of claims about the high prevalence of voter fraud in the U.S.  The commission never served this function, both because of its premature demise and because the news surrounding the commission was muddied by its controversy.

However, let’s consider the counterfactual.  What if the commission had not been terminated, and what if Kobach’s message about high rates of fraud had been given clear expression?  What would the effects of this messaging be?

We’re helped in answering this question by Kobach, who was interviewed by Breitbart on the subject of voter fraud on the day the commission was terminated.  In that interview, Kobach claimed that the vote fraud commission had revealed:

  • 938 convictions for voter fraud since the year 2000
  • Fewer than 1 in 100 cases ends in a conviction
  • In Kansas, alone, there are 127 known cases of non-citizen aliens registering to vote
  • In 21 states, there were 8,471 cases of double voting discovered

I turned these claims into a question that was asked of my survey respondents. (Go back to the previous posts to see details about the sample and other analysis.)  In particular, I randomly presented one of these claims to each respondent, identifying it as having been made by “the vice chair of the fraud commission.”  I then asked, “Does this statement make you more or less concerned about voter fraud?”

A plurality of respondents (47%) said they were unmoved by the statement they were shown, 40% said it made them more concerned about fraud, and 13% said they were less concerned.  (See Table 1.) Most Democrats said their views were unchanged; most Republicans said they were more concerned.


Table 1.  Question:  Does [the statement you were just shown] make you more or less concerned about voter fraud?
All respondents (N = 2000) Democrats (N=851) Republicans (N=652)
More concerned 40% 30% 55%
Less concerned 13% 16% 9%
No change 47% 55% 36%

Thus, the respondents processed claims about voter fraud through the lens of partisanship.  This is consistent with much of the modern research into the effects of persuasive communicates, which generally teaches us that people readily internalize information that confirms prior beliefs and reject information that is dis-confirming.

This process is typically the most potent among the most politically engaged, who are the most aware about “what goes with what,” that is, most aware of the positions associated with the two parties.  And, true enough, that pattern shows up here, as well.  For instance, while 55% of Democrats stated that the statement they read about voter fraud did not change their concerns about fraud, 72% of the “hyper-aware” Democrats said they were unmoved.  (Recall, the “hyper-aware” respondents were those who both (1) closely followed news about the commission and (2) could pick out Kobach as a member of the commission.)  Among hyper-aware Republicans, 61% said they were even more concerned about fraud after reading the statement, compared to 55% of Republicans overall. 

In other words, among the most engaged partisans, being presented with a claim about voter fraud just pushed them further apart from each other.

A similar pattern also emerges when we examine the responses to these statements in light of how concerned the respondents said they were about vote fraud at the start of the survey. (See Figure 1).  Among those who initially said they were the least concerned about vote fraud, 73% said that the statement they read about fraud didn’t change their mind.  Among those who initially identified themselves as being the most concerned about fraud, 72% said the statement made them even more concerned.

As an aside, the pattern in Figure 1 persists among all levels of attention to the commission, or even all levels of attention to politics in general.  What this means is that attitudes about vote fraud are probably already pretty entrenched among citizens, and that claims about fraud have little-to-no influence on those attitudes, at least in the short run.

Among the four statements, which had the greatest effect on concerns about fraud? Table 2 provides the answer to the question.

Table 2.  Effect of statement read to respondent on respondent’s self-report about change in attitudes about vote fraud. (N=1,998)
More concerned Less concerned No change
938 convictions for fraud since 2000 30% 18% 52%
Over 100,000 cases of voter fraud prosecuted since 2000 35% 11% 55%
127 known cases of non-citizen voters in Kansas 47% 11% 42%
8,471 cases of double voting in 21 states 47% 12% 41%

What stands out here is the fact that the last two comments tended to elicit more expressions of additional concern than the first two.  Figuring out why this is requires some speculation, because each of the items mixes and matches stimuli.  Still, it strikes me that the last two items pertain to specific types of voter fraud (non-citizen voting and double voting), whereas the first two items refer to fraud in general terms.  It is possible that specific cases of fraud are more compelling than the general problem of fraud.  Or, it is possible that non-citizen and double voting in particular are especially compelling ways to frame the fraud question.  In any event, I am sure that others who are more expert in the field of persuasive communications than I am will be exploring this question further.

*      *      *

This has been a fast-and-furious tour of the new survey data about the Trump fraud commission and its termination.  I hope to be writing more about this in the weeks and months ahead.  For now, it is important to note that support for the commission and its termination was not as firmly linked to partisan attitudes as attitudes about fraud itself.  I have gone on record as saying that the termination of the commission only shifts the politics of vote fraud to other venues.  It remains to be seen whether those venues will be seen as having greater authority than the commission, and thus (perhaps) greater influence on what the public believes about fraud.

One reassuring message from the survey responses is that even Americans who were the most concerned about voter fraud were not up in arms about the commission’s termination.  This suggests an opening for bipartisan endeavors to secure the voting rolls that may be effective with the broad middle of public opinion.  There are already effective models of such efforts, ranging from states that carefully adhere to the NVRA, to the Electronic Registration Information Center.  Efforts such as these are likely to be more effective in securing voter registration lists while maintaining access to the ballot box than promoting messages that polarize attitudes further than they already are.

Note:  The research was supported by a grant from NEO Philanthropy, which bears no responsibility for the results or analysis.

The Public Says Good-Bye to the Trump Vote-Fraud Commission, Part III: Opinions about Termination

This is the third of a four-part series looking at public attitudes related to President Trump’s fraud commission.  Part I introduced the series and explored whether voters had become more concerned about vote fraud since late 2016.  Part II explored who was knowledgeable about the commission.  In today’s post, I look at support for the commission’s termination.

Among the respondents who said they had heard of the commission (which as 79% of respondents), 44% agreed with the commission’s termination at least somewhat, 31% disagreed, and 25% had no opinion.  (See Table 1.)  Among the aware, 53% agreed with the termination.  This rises to 63% among the hyper-aware.

Table 1.  Question:  Do you agree or disagree with President Trump’s decision to terminate the election fraud commission?
All respondents (N = 1,568) Democrats (N = 700) Republicans (N=531)
Strongly agree 27% 41% 17%
Somewhat agree 17% 13% 25%
Somewhat disagree 17% 11% 24%
Strongly disagree 14% 18% 8%
Don’t know 25% 17% 26%
No response 0.3% 0.1% 0.0%

The relatively large number of “don’t know” responses is typical, in my experience, when asking about questions related to election administration.  Not surprisingly, Democrats were more likely to agree with the termination (54%) than Republicans (42%) and more likely to have an opinion, as well (17% “don’t know” vs. 26% for Republicans).  Given the large percentage of Republicans who expressed concern over fraud in the first question, the big surprise here is that a plurality of Republicans actually agreed with the commission’s termination — a majority if we exclude the respondents who had no opinion.

Another surprise is the relatively large number of Democrats who strongly disagreed with the commission’s termination. In fact, more Democrats disagreed with the commission’s termination than Republicans.  Part of the reason for this is that Democrats were just more likely to express an opinion, but even among those expressing opinions, Democrats were more likely to disagree.

Who are these Democrats?  First, they were much more likely to say they were very concerned about vote fraud at the outset (45%, vs 8% of all other Democrats).  They were also more likely to say they were moderate (44%) than other Democrats (38%).  They were also less attentive to politics in general and were much less likely to identify Kris Kobach as a commission member (32%) than other Democrats (68%).

Thus, the Democrats who strongly disagreed with the commission’s termination were not especially attentive to the commission’s work and had more ideologically moderate views than the rest of their co-partisans.  In contrast, the Republicans who strongly disagreed with the termination of the commission were not all that different from the rest of their party.

It is quite possible that the Democrats who strongly disagreed with the commission’s termination simply had the wrong idea about what the commission’s charge was.  Unfortunately, the limitations of this survey didn’t allow me to probe that question further.

In the end, the public seemed relatively satisfied to see the fraud commission go away.  Whether they would have had the same opinion had the commission been able to pursue its mission through 2018 is something we will never know.

Tomorrow’s post: The effectiveness of claims about vote fraud.

Note:  The research was supported by a grant from NEO Philanthropy, which bears no responsibility for the results or analysis.

The Public Says Good-Bye to the Trump Vote-Fraud Commission, Part II: Knowledge of the Commission

This is the second part of a four-part series concerning public attitudes toward the Trump Vote-Fraud Commission.  The first part includes an overview of the series, some information about the survey methodology itself, and a substantive section on attitudes about fraud.  Today, I take on the issue of knowledge about the commission itself.

President Trump’s fraud commission is one of those inside-baseball issues that elicits three types of reactions: (1) strong, informed reaction among the most politically knowledgeable, (2) strong, uninformed reaction among a larger group of engaged political spectators, and (3) a variety of “non-opinions” among the rest.  I used two questions to see how closely the public followed the commission’s work, to see if we could discern differences of opinion among these three groups.

First, I simply asked respondents to report which of a series of statements most closely described how closely they had followed the commission’s work.  Table 1 shows those statements, and the fraction of respondents who chose each.


Table 1.  Question:  Which of the following statements most closely describes how much you paid attention to President Trump’s election fraud commission before you took this survey? (N=2,000; 0.06% gave no response)
I really hadn’t heard about it before.

21%

I had heard about it, but I didn’t pay much attention to it.

30%

I had heard about it, and remember reading a little bit about it.

28%

I had heard about it, and followed news about it with interest.

21%


Overall, the public appeared to be split about 50/50 between those who paid at least some attention to the commission and those who didn’t.  Democrats and Republicans followed it in roughly similar proportions, 51% for Democrats and 54% for Republicans.

Of course, the nature of questions like this is that people tend to over-report being attentive to the news of the day.  To try and get a sense about how closely people really followed the commission, I also gave the respondents a test, to see if they knew of the commission’s most prominent member, Kris Kobach.

I asked them, “Based on what you might have read or heard about the voter fraud commission, which of the following prominent election officials served as one of its leaders?”  I then gave them four choices, which were shown to respondents in random order.  One choice was Kobach.  The other three were prominent election administrators from around the country, none of whom served on the commission.

Overall, 40% of respondents correctly picked Kobach.  Of those who reported that they had followed news about the commission with interest, 60% got the answer right.  Among everyone else, only 35% got it right, a result barely better than chance.

These results aren’t intended to play “gotcha” with the American public, but rather, to show that it is easy for those of us in the election administration world to over-estimate the attention being paid to things like the fraud commission.

For the rest of this post, I will call the people who reported that they had followed news about the commission with interest “aware” (21% of respondents) and those among this group who correctly picked out Kobach as the “hyper-aware” (13%).


Tomorrow’s post:  opinions about termination

Note:  The research was supported by a grant from NEO Philanthropy, which bears no responsibility for the results or analysis.

The Public Says Good-Bye to the Trump Voter-Fraud Commission: Introduction to a Series

This post begins a four-part series about some public opinion research I recently did to gauge attitudes about the termination of the Presidential Advisory Commission on Election Integrity.  The survey was conducted in late January of a representative sample of adults, sample size of 2,000.  There’s more to be said from this data than can fit into one blog post, which is why I’ve decided to stretch it out across four days.

To whet your appetite for what is to come, here’s the executive summary of the whole series:

  • Respondents were slightly more concerned about voter fraud in January 2018 than immediately before the 2016 election.
  • Respondents were split about 50/50 in whether they followed the work of President Trump’s fraud commission.
  • 44% of respondents agreed with the commission’s termination at least somewhat, 31% disagreed, and 25% had no opinion. A majority of Democrats and a plurality of Republicans approved of its termination.  More knowledgeable respondents were more likely to agree with the termination.
  • Respondents who reported they were already the most concerned about vote fraud report becoming even more concerned about vote fraud when read statements making claims about the frequency of fraud.

Today, I introduce the subject of the series and evidence about overall opinions about vote fraud.  In subsequent days I will touch on knowledge of the commission, options about terminating the commission, and some evidence about messaging concerning vote fraud.

Introduction to the Series

Almost a month ago, President Donald Trump terminated his Presidential Advisory Commission on Election Integrity.  The commission’s request during the summer for states’ voter files set its early life off to a rocky start, and helped create a degree of bipartisan opposition among election administrators that was surprising in its near-unanimity.

Many were worried that the commission would create doubts in the public’s mind about the integrity of the electoral system.  Democrats were especially worried that the commission’s work would lend credibility to discredited claims that millions of illegal votes were cast in the 2016 election.  This could have laid the groundwork for the weakening of voter-registration-protection provisions in the National Voter Registration Act, the “motor voter” law.

We’ll never be able to test whether the greatest fears of the commission’s opponents came to fruition, but we can catch a small glimpse into how the public thought about the commission’s work during its truncated lifetime, and its demise.

To capture a snapshot of public attitudes, I commissioned YouGov to ask a small battery of questions about election fraud and the commission’s demise to 2,000 respondents last week.  (The poll was in the field between January 23 and 26, 2018.  It would have been in the field earlier, but university IRBs move slowly, as they should.)

The questions I asked were intended, first, to see if attention to and worry about voter fraud had changed in the year that has passed since the 2016 election.  I was also interested in whether the public had knowledge about the commission at all, and whether they approved of its termination.  Finally, I wanted to see whether the types of messages the commission may have publicized, had it not been terminated, would have resonated with the public.

There were two major take-aways for me.  The first had to do with the facts.  About half of Americans followed the commission, though a small minority followed it very closely.  The public has become slightly more concerned about voter fraud, compared to the pre-2016 election period, with Democrats showing the most movement.  The public mostly supports the termination of the commission, with Democrats strongly supporting its termination and Republicans being more equivocal.

The second take-away relates to how public opinion works in this partisan era.  For the past decade, as partisanship has started to structure so much of how Americans view politics, the major framing device to understand this phenomenon has been something called “motivated reasoning.”  Applied to opinion about public policy, motivated reasoning helps us understand how citizens interpret new information, including conflicting information, through a partisan lens.  It also helps us understand how people with extreme views just keep getting more extreme.  As we’ll see, when presented with claims about evidence of voter fraud, respondents who were already the most concerned about voter fraud became even more concerned.  The respondents who were the least concerned about fraud out the outset either became less concerned, or didn’t change their stance, when presented with the same claims.

Overall opinions about voter fraud

To start, I asked respondents how concerned they were about voter fraud, along a five-point scale.  The distribution of responses is given in Table 1.


Table 1.  Question:  The following are two statements that might be used to describe voting and elections.  Using the scale provided, please indicate which statement more closely describes how you feel. (N = 2,000; 9% gave no response)
I am not concerned about vote fraud

1

2 3 4 5

I am concerned about vote fraud

18% 14% 17% 17%

26%

For simplicity’s sake, let’s call people who rated themselves a 1 or 2 “not concerned” and those who rated themselves a 4 or 5 “concerned.”  Among the respondents, 43% said they were concerned, and 32% said they were not.  (Another 17% were in the middle, plus the 9% who did not respond to the question.)  Not surprisingly, more Republicans (61%) said they were concerned than Democrats (31%).

In contrast, when I asked the identical question in the CCES right before the 2016 election, 37% were concerned and 40%, were not. This shift in opinion across the year — 6 percentage points more saying they were concerned and 8 points fewer saying they were not — is small, but statistically significant.

One interesting detail in this shift is that Democrats, more than Republicans, have moved in the direction of being concerned about fraud over the past year.  A bit over a year ago, 21% of Democrats said they were concerned about vote fraud, compared to 31% last week.  In contrast, 57% of Republicans said they were concerned about voter fraud in 2016, barely any different from the most recent results.

It’s not obvious why Democrats would state they were more worried about fraud across the past year and not Republicans.  One possibility is that Democrats and Republicans have different ideas about what constitutes voter fraud when considered in the abstract.  Democrats may be more likely to think about Russian hacking while Republicans may be thinking about double-voting and non-citizen voting.  Still, there’s a built-in asymmetry in the debate about voter fraud, however it’s defined.  It’s easier to illustrate cases of vote fraud, even when they’re rare, than to illustrate the lack of fraud, similar to the problem of proving a negative.  Plus, Republicans were already much more concerned about voter fraud than Democrats, so that Democrats could more easily be moved in the “worried” direction.

In any event, it looks like the public has moved slightly in the direction of being more concerned about fraud.  Whether that movement was caused by the commission’s work is unclear.  (I suspect the direct causal effect was slight.)  Had the commission been able to continue its business, and had been able to maintain a unified narrative (which is a big “if”), it does appear that public opinion was trending in the direction that was sympathetic to the commission leadership’s policy agenda.


Tomorrow’s post: Knowledge about the Commission

Note:  The research was supported by a grant from NEO Philanthropy, which bears no responsibility for the results or analysis.